Siegbahn notation
The Siegbahn notation is used in X-ray spectroscopy to name the spectral lines that are characteristic to elements. It was introduced by Manne Siegbahn.
The characteristic lines in X-ray emission spectra correspond to atomic electronic transitions where an electron jumps down to a vacancy in one of the inner shells of an atom. Such a hole in an inner shell may have been produced by bombardment with electrons in an X-ray tube, by other particles as in PIXE, by other X-rays in X-ray fluorescence or by radioactive decay of the atom's nucleus.
Although still widely used in spectroscopy, this notation is unsystematic and often confusing. For these reasons, International Union of Pure and Applied Chemistry (IUPAC) recommends another newer nomenclature. The table below shows a few of the common electronic levels with their names in Siegbahn and IUPAC notation.
| Low energy level | High energy level | Siegbahn notation | IUPAC notation |
|---|---|---|---|
| K (1s−1) | L3 (2p3/2−1) | Kα1 | K-L3 |
| L2 (2p1/2−1) | Kα2 | K-L2 | |
| M3 (3p3/2−1) | Kβ1 | K-M3 | |
| M2 (3p1/2−1) | Kβ3 | K-M2 | |
| L3 (2p3/2−1) | M5 (3d5/2−1) | Lα1 | L3-M5 |
| M4 (3d3/2−1) | Lα2 | L3-M4 | |
| L2 (2p1/2−1) | M4 (3d3/2−1) | Lβ1 | L2-M4 |
| M5 (3d5/2−1) | N7 (4f7/2−1) | Mα1 | M5-N7 |
History
The use of the letters K and L to denote X-rays originates in a 1911 paper by Charles Glover Barkla, titled The Spectra of the Fluorescent Röntgen Radiations.[1] ("Röntgen radiation" is an archaic name for "x-rays") By 1913, Henry Moseley had clearly differentiated two types of x-ray lines for each element, naming them α and β.[2] In 1914, as part of his thesis, Ivar Malmer (sv:Ivar Malmer), a student of Manne Siegbahn, discovered that the α and β lines were not single lines, but doublets. In 1916, Siegbahn published this result in the journal Nature, using what would come to be known as the Siegbahn notation.[3]
K-alpha
K-alpha emission lines result when an electron transitions to the innermost "K" shell (principal quantum number 1) from a 2p orbital of the second or "L" shell (with principal quantum number 2). The line is actually a doublet, with slightly different energies depending on spin–orbit interaction energy between the electron spin and the orbital momentum of the 2p orbital. K-alpha is typically by far the strongest X-ray spectral line for an element bombarded with energy sufficient to cause maximally intense X-ray emission.
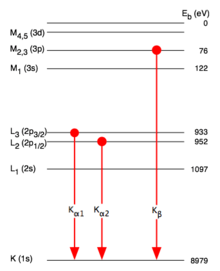
K-alpha emission is composed of two spectral lines, K-alpha1 and K-alpha2 (see figure to the right).[4] The K-alpha1 emission is higher in energy and thus has a lower wavelength than the K-alpha2 emission. A larger number of electrons follow the K-alpha1 transition (L3 → K) relative to the K-alpha2 (L2 → K) transition which causes the K-alpha1 emission to be more intense than K-alpha2. For all elements, the ratio of the intensities of K-alpha1 and K-alpha2 is very close to 2:1.[5] K-alpha1 and K-alpha2 are close enough in wavelength that an average of the two wavelengths, K-alpha, is used in x-ray diffractometry without separation by a monochromator, which would cause a significant loss in the intensity of the incident beam.
The analogous K-alpha spectra line in hydrogen is known as Lyman alpha; however because of hydrogen's small nuclear charge, this line is in the ultraviolet, not the X-ray range.
An example of K-alpha lines are those seen for iron as iron atoms radiating X-rays spiralling into a black hole at the center of a galaxy.[6] For such purposes, the energy of the line is adequately calculated to 2-digit accuracy by the use of Moseley's law: EK-alpha1=(3/4)Ry(Z-1)2=(10.2 eV)(Z − 1)2, where Z is the atomic number and Ry=Rydberg energy=13,6 eV.[7] For example, K-alpha for iron (Z = 26) is calculated in this fashion (10.2 eV)(25)2 = 6.375 keV. For astrophysical purposes, Doppler and other effects (such as gravitational broadening) show the iron K-alpha line to better accuracy than 6.4 keV.[8][9]
Values of transition energies
- Values of different kinds of transition energies like Kα, Kβ, Lα, Lβ and so on for different elements can be found in the NIST X-Ray Transition Energies Database and Spectr-W3 Atomic Database for Plasma Spectroscopy.[10]
- K-alpha emission values for hydrogen-sum and helium-like ions can be found on Table 1-5 of the LBNL X-Ray Data Booklet.[11]
K-beta
K-beta emissions, similar to K-alpha emissions, result when an electron transitions to the innermost "K" shell (principal quantum number 1) from a 3p orbital of the third or "M" shell (with principal quantum number 3).
Values can be found in the X-Ray Transition Energies Database.[12][13]
References
- Barkla, Charles G (1911). "The Spectra of the Fluorescent Röntgen Radiations". The London, Edinburgh, and Dublin Philosophical Magazine and Journal of Science. 22 (129): 396–412. doi:10.1080/14786440908637137.
- Henry Moseley (1913). "The high-frequency spectra of the elements". The London, Edinburgh, and Dublin Philosophical Magazine and Journal of Science. 26 (156): 1024–1034. doi:10.1080/14786441308635052.
- MANNE SIEGBAHN (17 Feb 1916). "Relations between the K and L Series of the High-Frequency Spectra". Nature. 96 (2416): 676. doi:10.1038/096676b0.
- Clark, C. M.; Dutrow, B. L. "Single-crystal X-ray Diffraction". Geochemical Instrumentation and Analysis. Carleton College. Retrieved 22 April 2019.
- Klug, H. P.; Alexander, L. E. (1974). X-Ray diffraction procedures: for polycrystalline and amorphous materials (2nd ed.). John Wiley and Sons, Inc. p. 86. ISBN 978-0-471-49369-3.
- Fukumura, Keigo; Tsuruta, Sachiko (2004-10-01). "Iron Kα Fluorescent Line Profiles from Spiral Accretion Flows in Active Galactic Nuclei". The Astrophysical Journal. 613 (2): 700–709. arXiv:astro-ph/0405337. Bibcode:2004ApJ...613..700F. doi:10.1086/423312.
- Mohr, Peter J.; Newell, David B.; Taylor, Barry N. (2016). "CODATA recommended values of the fundamental physical constants: 2014". Reviews of Modern Physics. 88 (3). arXiv:1507.07956. doi:10.1103/RevModPhys.88.035009.
- "X-ray Transition Energies - Search Result". physics.nist.gov. Retrieved 2020-02-03.
- Lee, Julia C.; Iwasawa, Kazushi; Houck, John C.; Fabian, Andrew C.; Marshall, Herman L.; Canizares, Claude R. (2002-05-10). "The Shape of the Relativistic Iron Kα Line from MCG −6-30-15 Measured with the [ITAL]Chandra[/ITAL] High Energy Transmission Grating Spectrometer and the [ITAL]Rossi X-Ray Timing Explorer[/ITAL]". The Astrophysical Journal. 570 (2): L47–L50. arXiv:astro-ph/0203523. Bibcode:2002ApJ...570L..47L. doi:10.1086/340992.
- Spectr-W3 database
- Lawrence Berkeley National Laboratory X-Ray Data Booklet
- AtomDB
- NIST X-Ray Transition Energies Database