Jordan Rift Valley
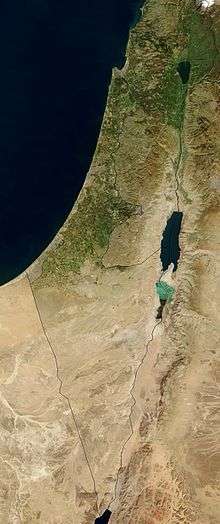
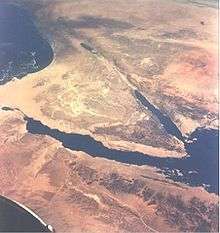
The Jordan Rift Valley, often just Jordan Valley (Hebrew: בִּקְעָת הַיַרְדֵּן Bik'at HaYarden, Arabic: الغور Al-Ghor or Al-Ghawr), also called the Syro-African Depression, is an elongated depression located in modern-day Israel, Jordan, and Palestine. This geographic region includes the entire length of the Jordan River – from its sources, through the Hula Valley, the Korazim block, the Sea of Galilee, the (Lower) Jordan Valley, all the way to the Dead Sea, the lowest land elevation on Earth – and then continues through the Arabah depression, the Gulf of Aqaba whose shorelines it incorporates, until finally reaching the Red Sea proper at the Straits of Tiran.
History and physical features
The Jordan Rift Valley was formed many millions of years ago in the Miocene epoch (23.8 – 5.3 Myr ago) when the Arabian Plate moved northward and then eastward away from Africa. One million years later, the land between the Mediterranean and the Jordan Rift Valley rose so that the sea water stopped flooding the area.
The geological and environmental evolution of the valley since its inception in the Oligocene can be seen in a variety of sedimentary and magmatic rock units, preserved as continuous sequences in the deeper basins. The outcropping formations around the basins represent alternating deposition and erosion phases.[1]
The lowest point in the Jordan Rift Valley is in the Dead Sea, the lowest spot of which is 790 m (2,590 ft) below sea level. The shore of the Dead Sea is the lowest land on earth, at 400 m (1,300 ft) below sea level. Rising sharply to almost 1,000 m (3,300 ft) in the west, and similarly in the east, the rift is a significant topographic feature over which a few narrow paved roads and difficult mountain tracks lead.[2] The valley north of the Dead Sea has long been a site of agriculture because of water available from the Jordan River and numerous springs located on the valley's flanks.
Dead Sea Transform
The plate boundary which extends through the valley is variously called the Dead Sea Transform (DST) or Dead Sea Rift. The boundary separates the Arabian Plate from the African Plate, connecting the divergent plate boundary in the Red Sea (the Red Sea Rift) to the East Anatolian Fault in Turkey.[3]
The DST fault system is generally considered to be a transform fault that has accommodated a 105-kilometre (65 mi) northwards displacement of the Arabian Plate.[4][5] This interpretation is based on observation of offset markers, such as river terraces, gullies and archaeological features, giving horizontal slip rates of several mm per year over the last few million years.[6] GPS data give similar rates of present-day movement of the Arabian Plate relative to the Africa Plate.[7] It has also been proposed that the fault zone is a rift system that is an incipient oceanic spreading center, the northern extension of the Red Sea Rift.[8]
Climate
| Climate data for Dead Sea, Sedom (-390m) | |||||||||||||
|---|---|---|---|---|---|---|---|---|---|---|---|---|---|
| Month | Jan | Feb | Mar | Apr | May | Jun | Jul | Aug | Sep | Oct | Nov | Dec | Year |
| Record high °C (°F) | 26.4 (79.5) |
30.4 (86.7) |
33.8 (92.8) |
42.5 (108.5) |
45.0 (113.0) |
46.4 (115.5) |
47.0 (116.6) |
44.5 (112.1) |
43.6 (110.5) |
40.0 (104.0) |
35.0 (95.0) |
28.5 (83.3) |
47.0 (116.6) |
| Average high °C (°F) | 20.5 (68.9) |
21.7 (71.1) |
24.8 (76.6) |
29.9 (85.8) |
34.1 (93.4) |
37.6 (99.7) |
39.7 (103.5) |
39.0 (102.2) |
36.5 (97.7) |
32.4 (90.3) |
26.9 (80.4) |
21.7 (71.1) |
30.4 (86.7) |
| Daily mean °C (°F) | 16.6 (61.9) |
17.7 (63.9) |
20.8 (69.4) |
25.4 (77.7) |
29.4 (84.9) |
32.6 (90.7) |
34.7 (94.5) |
34.5 (94.1) |
32.4 (90.3) |
28.6 (83.5) |
23.1 (73.6) |
17.9 (64.2) |
26.1 (79.0) |
| Average low °C (°F) | 12.7 (54.9) |
13.7 (56.7) |
16.7 (62.1) |
20.9 (69.6) |
24.7 (76.5) |
27.6 (81.7) |
29.6 (85.3) |
29.9 (85.8) |
28.3 (82.9) |
24.7 (76.5) |
19.3 (66.7) |
14.1 (57.4) |
21.9 (71.4) |
| Record low °C (°F) | 5.4 (41.7) |
6.0 (42.8) |
8.0 (46.4) |
11.5 (52.7) |
19.0 (66.2) |
23.0 (73.4) |
26.0 (78.8) |
26.8 (80.2) |
24.2 (75.6) |
17.0 (62.6) |
9.8 (49.6) |
6.0 (42.8) |
5.4 (41.7) |
| Average precipitation mm (inches) | 7.8 (0.31) |
9.0 (0.35) |
7.6 (0.30) |
4.3 (0.17) |
0.2 (0.01) |
0.0 (0.0) |
0.0 (0.0) |
0.0 (0.0) |
0.0 (0.0) |
1.2 (0.05) |
3.5 (0.14) |
8.3 (0.33) |
41.9 (1.65) |
| Average precipitation days | 3.3 | 3.5 | 2.5 | 1.3 | 0.2 | 0.0 | 0.0 | 0.0 | 0.0 | 0.4 | 1.6 | 2.8 | 15.6 |
| Average relative humidity (%) | 41 | 38 | 33 | 27 | 24 | 23 | 24 | 27 | 31 | 33 | 36 | 41 | 32 |
| Source: Israel Meteorological Service[9] | |||||||||||||
| Climate data for Gilgal (−255m) | |||||||||||||
|---|---|---|---|---|---|---|---|---|---|---|---|---|---|
| Month | Jan | Feb | Mar | Apr | May | Jun | Jul | Aug | Sep | Oct | Nov | Dec | Year |
| Record high °C (°F) | 28.0 (82.4) |
33.5 (92.3) |
40.5 (104.9) |
44.7 (112.5) |
46.5 (115.7) |
47.5 (117.5) |
48.1 (118.6) |
49.0 (120.2) |
45.7 (114.3) |
44.2 (111.6) |
37.9 (100.2) |
32.5 (90.5) |
49.0 (120.2) |
| Average high °C (°F) | 20.1 (68.2) |
21.6 (70.9) |
25.6 (78.1) |
30.3 (86.5) |
35.6 (96.1) |
38.7 (101.7) |
40.4 (104.7) |
40.0 (104.0) |
37.7 (99.9) |
33.8 (92.8) |
27.7 (81.9) |
22.1 (71.8) |
31.1 (88.1) |
| Daily mean °C (°F) | 14.5 (58.1) |
15.5 (59.9) |
18.7 (65.7) |
22.8 (73.0) |
27.3 (81.1) |
30.5 (86.9) |
32.4 (90.3) |
32.5 (90.5) |
30.5 (86.9) |
26.9 (80.4) |
21.1 (70.0) |
16.4 (61.5) |
24.1 (75.4) |
| Average low °C (°F) | 8.9 (48.0) |
9.4 (48.9) |
11.8 (53.2) |
15.3 (59.5) |
19.1 (66.4) |
22.3 (72.1) |
24.5 (76.1) |
25.0 (77.0) |
23.2 (73.8) |
19.9 (67.8) |
14.4 (57.9) |
10.6 (51.1) |
17.0 (62.7) |
| Record low °C (°F) | 0.3 (32.5) |
0.0 (32.0) |
2.5 (36.5) |
3.0 (37.4) |
11.2 (52.2) |
15.2 (59.4) |
20.0 (68.0) |
19.5 (67.1) |
14.0 (57.2) |
12.1 (53.8) |
4.6 (40.3) |
0.2 (32.4) |
0.0 (32.0) |
| Source: Israel Meteorological Service[10] | |||||||||||||
References
- The Jordan Rift Valley, Tel Aviv University
- David Eshel (3 May 2006). "Increasing Importance of the Jordan Rift Buffer". Defense Update. Archived from the original on 5 July 2008. Retrieved 5 July 2007.
- The Geophysical Institute Archived 23 June 2008 at the Wayback Machine
- Freund R.; Garfunkel Z.; Zak I.; Goldberg M.; Weissbrod T.; Derin B.; Bender F.; Wellings F.E.; Girdler R.W. (1970). "The Shear along the Dead Sea Rift (and Discussion)". Philosophical Transactions of the Royal Society of London. Series A, Mathematical and Physical Sciences. 267 (1181): 107. Bibcode:1970RSPTA.267..107F. doi:10.1098/rsta.1970.0027.
- Joffe S.; Garfunkel Z. (1987). "Plate kinematics of the circum Red Sea—a re-evaluation". Tectonophysics. 141 (1–3): 5–22. Bibcode:1987Tectp.141....5J. doi:10.1016/0040-1951(87)90171-5.
- Begin Z.B.; Steinitz G. (2005). "Temporal and spatial variations of microearthquake activity along the Dead Sea Fault, 1984–2004". Israel Journal of Earth Sciences. 54: 1–14. doi:10.1560/QTVW-HY1E-7XNU-JCLJ.
- Gomez, F., Karam, G., Khawlie, M., McClusky S., Vernant P., Reilinger R., Jaafar R., Tabet C., Khair K., and Barazangi M (2007). "Global Positioning System measurements of strain accumulation and slip transfer through the restraining bend along the Dead Sea fault system in Lebanon" (PDF). Geophysical Journal International. 168 (3): 1021–1028. Bibcode:2007GeoJI.168.1021G. doi:10.1111/j.1365-246X.2006.03328.x. Archived from the original (PDF) on 13 July 2015.CS1 maint: multiple names: authors list (link)
- Mart Y.; Ryan W.B.F.; Lunina O.V. (2005). "Review of the tectonics of the Levant Rift system: the structural significance of oblique continental breakup". Tectonophysics. 395 (3–4): 209–232. Bibcode:2005Tectp.395..209M. doi:10.1016/j.tecto.2004.09.007.
- "Averages and Records for several places in Israel". Israel Meteorological Service. June 2011. Archived from the original on 14 September 2010.
- "Averages and Records for several places in Israel" (PDF). Israel Meteorological Service. January 2016. Archived from the original (PDF) on 30 January 2016.
External links
| Wikimedia Commons has media related to Jordan Rift Valley. |