Joint Polarization Experiment
The Joint Polarization Experiment (JPOLE) was a test for evaluating the performance of the WSR-88D in order to modify it to include dual polarization. This program was a joint project of the National Weather Service (NWS), the Federal Aviation Administration (FAA), and the US Air Force Meteorological Agency (AFWA), which took place from 2000-2004. It has resulted in the upgrading of the entire meteorological radar network in the United States by adding dual polarization to better determine the type of hydrometeor, and quantities that have fallen.[3]
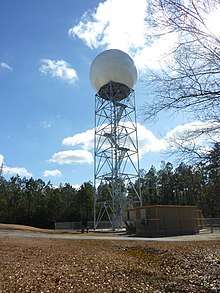 A WSR-88D, the subject of JPOLE | |
| Country of origin | USA |
|---|---|
| Introduced | 1988 |
| No. built | 160[1] |
| Type | Weather radar |
| Frequency | 2900 MHz (S-band) |
| PRF | 300 - 1200 Hz |
| Beamwidth | 0.95°[2] |
| Range | 460km |
| Diameter | 8.51 m |
| Azimuth | 0-360° |
| Elevation | -1°— 20° |
| Power | 750 kW |
History
During the years preceding JPOLE, NCAR was among the first centers in the field to utilize dual polarization for a weather radar, with staff Dusan S. Zrnic and Alexander V. Ryzhkov. In July 2000, the first planning meeting for JPOLE was held at the NSSL, and it was determined that the project would take place in two stages:
- The multi-season dual polarization data collection using a specially modified NEXRAD radar from spring 2002;
- a second, more intense observation campaign starting in the spring of 2003 with several instruments (other radars, weather stations, observers and in-situ flights in the boundary layer to compare with data from the JPOLE equipped radar. All of this data was then analyzed to determine the feasibility of the dual polarization concept operationally and to demonstrate the cost/benefit of the NEXRAD network modification. In addition, the second phase has made scientific advances in the field.
Description
JPOLE was introduced using a testbed NEXRAD weather radar mounted in Norman, Oklahoma, on the grounds of the National Severe Storms Laboratory (NSSL). The signal from its transmitter was split in two to obtain a conventional horizontal polarization and a vertical polarization.[4] The signals were sent to the antenna by two waveguides and could simultaneously transmit the two signals and furthermore receive the echoes returned by the precipitation in the emitted or orthogonal planes.[5]
In general, most hydrometeors have a larger axis in the horizontal (for example, drops of rain become oblates when falling because of the resistance of the air). Because of this, the dipolar axis of the water molecules therefore tends to align in the horizontal and, as such, the radar beam will generally be horizontally polarized to take advantage of maximum return properties. If we send at the same time a pulse with vertical polarization and another with horizontal polarization, we can note a difference of several characteristics between these returns:[6]
Differential Reflectivity ()

- If the targets have a flattened shape, by sampling with two waves [of which one is of vertical polarization (V) and the other horizontal (H)], we obtain stronger intensities returning the horizontal axis. On the other hand, if the orthogonal returns are equal, this indicates a round target. This is called differential reflectivity, or ().
Correlation Coefficient ()

- The radar beam probes a larger or smaller volume depending on the characteristics of the transmitting antenna. What comes back is the average of the waves reflected by the individual targets within the volume. Since the targets can change position in time relative to each one another, the intensity of the V and H waves remains constant only if the targets maintain homogeneity. The intensity ratio between the H and V channels returning from successive samples is called the correlation coefficient () and therefore gives an idea of the homogeneity, or lack thereof, of the targets in the volume surveyed.
Differential Phase Shift ()

- The phase of the wave changes as it passes through media of varying densities. By comparing the phase change rate of the return wave with the distance, the specific differential phase can help sample the quantity of material traversed.[7]
References
- "NOAA NEXt-Generation RADar (NEXRAD) Products - Data.gov". catalog.data.gov.
- "Weather Radar Technology Beyond NEXRAD". 31 July 2002. doi:10.17226/10394. ISBN 978-0-309-08466-6. Cite journal requires
|journal=(help) - Scharfenberg, Kevin A.; Miller, Daniel J.; Schuur, Terry J.; Schlatter, Paul T.; Giangrande, Scott E.; Melnikov, Valery M.; Burgess, Donald W.; Andra, David L.; Foster, Michael P.; Krause, John M. (1 October 2005). "The Joint Polarization Experiment: Polarimetric Radar in Forecasting and Warning Decision Making". Weather and Forecasting. 20 (5): 775–788. Bibcode:2005WtFor..20..775S. doi:10.1175/waf881.1.
- Service, US Department of Commerce, NOAA, National Weather. "Contact Us". www.weather.gov.
- Ryzhkov, Alexander V.; Schuur, Terry J.; Burgess, Donald W.; Heinselman, Pamela L.; Giangrande, Scott E.; Zrnic, Dusan S. (1 June 2005). "The Joint Polarization Experiment: Polarimetric Rainfall Measurements and Hydrometeor Classification". Bulletin of the American Meteorological Society. 86 (6): 809–824. Bibcode:2005BAMS...86..809R. doi:10.1175/bams-86-6-809.
- http://cimms.ou.edu/~schuur/jpole/JPOLE_Overview_Report.pdf
- "Polarimetric Radar Page". www.cimms.ou.edu.