Intelligence quotient
An intelligence quotient (IQ) is a total score derived from a set of standardized tests or subtests designed to assess human intelligence.[1] The abbreviation "IQ" was coined by the psychologist William Stern for the German term Intelligenzquotient, his term for a scoring method for intelligence tests at University of Breslau he advocated in a 1912 book.[2]
| Intelligence quotient | |
|---|---|
 One kind of IQ test item, modeled after items in the Raven's Progressive Matrices test | |
| ICD-10-PCS | Z01.8 |
| ICD-9-CM | 94.01 |
| Part of a series on |
| Psychology |
|---|
 |
|
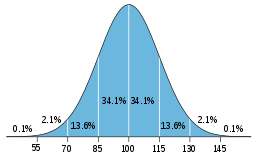
Historically, IQ was a score obtained by dividing a person's mental age score, obtained by administering an intelligence test, by the person's chronological age, both expressed in terms of years and months. The resulting fraction (quotient) is multiplied by 100 to obtain the IQ score.[3] For modern IQ tests, the median raw score of the norming sample is defined as IQ 100 and scores each standard deviation (SD) up or down are defined as 15 IQ points greater or less.[4] By this definition, approximately two-thirds of the population scores are between IQ 85 and IQ 115. About 2.5 percent of the population scores above 130, and 2.5 percent below 70.[5][6]
Scores from intelligence tests are estimates of intelligence. Unlike, for example, distance and mass, a concrete measure of intelligence cannot be achieved given the abstract nature of the concept of "intelligence".[7] IQ scores have been shown to be associated with such factors as morbidity and mortality,[8][9] parental social status,[10] and, to a substantial degree, biological parental IQ. While the heritability of IQ has been investigated for nearly a century, there is still debate about the significance of heritability estimates[11][12] and the mechanisms of inheritance.[13]
IQ scores are used for educational placement, assessment of intellectual disability, and evaluating job applicants. In research contexts, they have been studied as predictors of job performance[14] and income.[15] They are also used to study distributions of psychometric intelligence in populations and the correlations between it and other variables. Raw scores on IQ tests for many populations have been rising at an average rate that scales to three IQ points per decade since the early 20th century, a phenomenon called the Flynn effect. Investigation of different patterns of increases in subtest scores can also inform current research on human intelligence.
History
Precursors to IQ testing
Historically, even before IQ tests were devised, there were attempts to classify people into intelligence categories by observing their behavior in daily life.[16][17] Those other forms of behavioral observation are still important for validating classifications based primarily on IQ test scores. Both intelligence classification by observation of behavior outside the testing room and classification by IQ testing depend on the definition of "intelligence" used in a particular case and on the reliability and error of estimation in the classification procedure.
The English statistician Francis Galton made the first attempt at creating a standardized test for rating a person's intelligence. A pioneer of psychometrics and the application of statistical methods to the study of human diversity and the study of inheritance of human traits, he believed that intelligence was largely a product of heredity (by which he did not mean genes, although he did develop several pre-Mendelian theories of particulate inheritance).[18][19][20] He hypothesized that there should exist a correlation between intelligence and other observable traits such as reflexes, muscle grip, and head size.[21] He set up the first mental testing center in the world in 1882 and he published "Inquiries into Human Faculty and Its Development" in 1883, in which he set out his theories. After gathering data on a variety of physical variables, he was unable to show any such correlation, and he eventually abandoned this research.[22][23]

French psychologist Alfred Binet, together with Victor Henri and Théodore Simon had more success in 1905, when they published the Binet-Simon test, which focused on verbal abilities. It was intended to identify mental retardation in school children,[24] but in specific contradistinction to claims made by psychiatrists that these children were "sick" (not "slow") and should therefore be removed from school and cared for in asylums.[25] The score on the Binet-Simon scale would reveal the child's mental age. For example, a six-year-old child who passed all the tasks usually passed by six-year-olds—but nothing beyond—would have a mental age that matched his chronological age, 6.0. (Fancher, 1985). Binet thought that intelligence was multifaceted, but came under the control of practical judgment.
In Binet's view, there were limitations with the scale and he stressed what he saw as the remarkable diversity of intelligence and the subsequent need to study it using qualitative, as opposed to quantitative, measures (White, 2000). American psychologist Henry H. Goddard published a translation of it in 1910. American psychologist Lewis Terman at Stanford University revised the Binet-Simon scale, which resulted in the Stanford-Binet Intelligence Scales (1916). It became the most popular test in the United States for decades.[24][26][27][28]
General factor (g)
The many different kinds of IQ tests include a wide variety of item content. Some test items are visual, while many are verbal. Test items vary from being based on abstract-reasoning problems to concentrating on arithmetic, vocabulary, or general knowledge.
The British psychologist Charles Spearman in 1904 made the first formal factor analysis of correlations between the tests. He observed that children's school grades across seemingly unrelated school subjects were positively correlated, and reasoned that these correlations reflected the influence of an underlying general mental ability that entered into performance on all kinds of mental tests. He suggested that all mental performance could be conceptualized in terms of a single general ability factor and a large number of narrow task-specific ability factors. Spearman named it g for "general factor" and labeled the specific factors or abilities for specific tasks s.[29] In any collection of test items that make up an IQ test, the score that best measures g is the composite score that has the highest correlations with all the item scores. Typically, the "g-loaded" composite score of an IQ test battery appears to involve a common strength in abstract reasoning across the test's item content.
Spearman's argument proposing a general factor of human intelligence is still accepted, in principle, by many psychometricians. Today's factor models of intelligence typically represent cognitive abilities as a three-level hierarchy, where there are a large number of narrow factors at the bottom of the hierarchy, a handful of broad, more general factors at the intermediate level, and at the apex a single factor, referred to as the g factor, which represents the variance common to all cognitive tasks.
United States military selection in World War I
During World War I, the Army needed a way to evaluate and assign recruits to appropriate tasks. This led to the development of several mental tests by Robert Yerkes, who worked with major hereditarians of American psychometrics—including Terman, Goddard—to write the test.[30] The testing generated controversy and much public debate in the United States. Nonverbal or "performance" tests were developed for those who could not speak English or were suspected of malingering.[24] Based on Goddard's translation of the Binet-Simon test, the tests had an impact in screening men for officer training:
...the tests did have a strong impact in some areas, particularly in screening men for officer training. At the start of the war, the army and national guard maintained nine thousand officers. By the end, two hundred thousand officers presided, and two- thirds of them had started their careers in training camps where the tests were applied. In some camps, no man scoring below C could be considered for officer training.[30]
1.75 million men were tested in total, making the results the first mass-produced written tests of intelligence, though considered dubious and non-usable, for reasons including high variability of test implementation throughout different camps and questions testing for familiarity with American culture rather than intelligence.[30] After the war, positive publicity promoted by army psychologists helped to make psychology a respected field.[31] Subsequently, there was an increase in jobs and funding in psychology in the United States.[32] Group intelligence tests were developed and became widely used in schools and industry.[33]
The results of these tests, which at the time reaffirmed contemporary racism and nationalism, are considered controversial and dubious, having rested on certain contested assumptions: that intelligence was heritable, innate, and could be relegated to a single number, the tests were enacted systematically, and test questions actually tested for innate intelligence rather than subsuming environmental factors.[30] The tests also allowed for the bolstering of jingoist narratives in the context of increased immigration, which may have influenced the passing of the Immigration Restriction Act of 1924.[30]
L.L. Thurstone argued for a model of intelligence that included seven unrelated factors (verbal comprehension, word fluency, number facility, spatial visualization, associative memory, perceptual speed, reasoning, and induction). While not widely used, Thurstone's model influenced later theories.[24]
David Wechsler produced the first version of his test in 1939. It gradually became more popular and overtook the Stanford-Binet in the 1960s. It has been revised several times, as is common for IQ tests, to incorporate new research. One explanation is that psychologists and educators wanted more information than the single score from the Binet. Wechsler's ten or more subtests provided this. Another is that the Stanford-Binet test reflected mostly verbal abilities, while the Wechsler test also reflected nonverbal abilities. The Stanford-Binet has also been revised several times and is now similar to the Wechsler in several aspects, but the Wechsler continues to be the most popular test in the United States.[24]
IQ testing and the Eugenics movement in the United States
Eugenics, the set of beliefs and practices which aims at improving the genetic quality of the human population,[34][35] played a significant role in the history and culture of the United States during the Progressive Era, from the late 19th century until US involvement in World War II.[36][37]
The American eugenics movement was rooted in the biological determinist ideas of the British Scientist Sir Francis Galton. In 1883, Galton first used the word eugenics to describe the biological improvement of human genes and the concept of being "well-born".[38][39] He believed that differences in a person's ability were acquired primarily through genetics and that eugenics could be implemented through selective breeding in order for the human race to improve in its overall quality, therefore allowing for humans to direct their own evolution.[40]
Goddard was a eugenicist. In 1908, he published his own version, The Binet and Simon Test of Intellectual Capacity, and cordially promoted the test. He quickly extended the use of the scale to the public schools (1913), to immigration (Ellis Island, 1914) and to a court of law (1914).[41]
Unlike Galton, who promoted eugenics through selective breeding for positive traits, Goddard went with the US eugenics movement to eliminate "undesirable" traits.[42] Goddard used the term "feeble-minded" to refer to people who did not perform well on the test. He argued that "feeble-mindedness" was caused by heredity, and thus feeble-minded people should be prevented from giving birth, either by institutional isolation or sterilization surgeries.[41] At first, sterilization targeted the disabled, but was later extended to poor people. Goddard's intelligence test was endorsed by the eugenicists to push for laws for forced sterilization. Different states adopted the sterilization laws at different pace. These laws, whose constitutionality was upheld by the Supreme Court in their 1927 ruling Buck v. Bell, forced over 64,000 people to go through sterilization in the United States.[43]
California's sterilization program was so effective that the Nazis turned to the government for advice on how to prevent the birth of the "unfit".[44] While the US eugenics movement lost much of its momentum in the 1940s in view of the horrors of Nazi Germany, advocates of eugenics (including Nazi geneticist Otmar Freiherr von Verschuer) continued to work and promote their ideas in the United States.[44] In later decades, some eugenic principles have made a resurgence as a voluntary means of selective reproduction, with some calling them "new eugenics".[45] As it becomes possible to test for and correlate genes with IQ (and its proxies),[46] ethicists and embryonic genetic testing companies are attempting to understand the ways in which the technology can be ethically deployed.[47]
Cattell–Horn–Carroll theory

Raymond Cattell (1941) proposed two types of cognitive abilities in a revision of Spearman's concept of general intelligence. Fluid intelligence (Gf) was hypothesized as the ability to solve novel problems by using reasoning, and crystallized intelligence (Gc) was hypothesized as a knowledge-based ability that was very dependent on education and experience. In addition, fluid intelligence was hypothesized to decline with age, while crystallized intelligence was largely resistant to the effects of aging. The theory was almost forgotten, but was revived by his student John L. Horn (1966) who later argued Gf and Gc were only two among several factors, and who eventually identified nine or ten broad abilities. The theory continued to be called Gf-Gc theory.[24]
John B. Carroll (1993), after a comprehensive reanalysis of earlier data, proposed the three stratum theory, which is a hierarchical model with three levels. The bottom stratum consists of narrow abilities that are highly specialized (e.g., induction, spelling ability). The second stratum consists of broad abilities. Carroll identified eight second-stratum abilities. Carroll accepted Spearman's concept of general intelligence, for the most part, as a representation of the uppermost, third stratum.[48][49]
In 1999, a merging of the Gf-Gc theory of Cattell and Horn with Carroll's Three-Stratum theory has led to the Cattell–Horn–Carroll theory (CHC Theory). It has greatly influenced many of the current broad IQ tests.[24]
In CHC theory, a hierarchy of factors is used; g is at the top. Under it are ten broad abilities that in turn are subdivided into seventy narrow abilities. The broad abilities are:[24]
- Fluid intelligence (Gf) includes the broad ability to reason, form concepts, and solve problems using unfamiliar information or novel procedures.
- Crystallized intelligence (Gc) includes the breadth and depth of a person's acquired knowledge, the ability to communicate one's knowledge, and the ability to reason using previously learned experiences or procedures.
- Quantitative reasoning (Gq) is the ability to comprehend quantitative concepts and relationships and to manipulate numerical symbols.
- Reading and writing ability (Grw) includes basic reading and writing skills.
- Short-term memory (Gsm) is the ability to apprehend and hold information in immediate awareness, and then use it within a few seconds.
- Long-term storage and retrieval (Glr) is the ability to store information and fluently retrieve it later in the process of thinking.
- Visual processing (Gv) is the ability to perceive, analyze, synthesize, and think with visual patterns, including the ability to store and recall visual representations.
- Auditory processing (Ga) is the ability to analyze, synthesize, and discriminate auditory stimuli, including the ability to process and discriminate speech sounds that may be presented under distorted conditions.
- Processing speed (Gs) is the ability to perform automatic cognitive tasks, particularly when measured under pressure to maintain focused attention.
- Decision/reaction time/speed (Gt) reflects the immediacy with which an individual can react to stimuli or a task (typically measured in seconds or fractions of seconds; it is not to be confused with Gs, which typically is measured in intervals of 2–3 minutes). See Mental chronometry.
Modern tests do not necessarily measure all of these broad abilities. For example, Gq and Grw may be seen as measures of school achievement and not IQ.[24] Gt may be difficult to measure without special equipment. g was earlier often subdivided into only Gf and Gc, which were thought to correspond to the nonverbal or performance subtests and verbal subtests in earlier versions of the popular Wechsler IQ test. More recent research has shown the situation to be more complex.[24] Modern comprehensive IQ tests do not stop at reporting a single IQ score. Although they still give an overall score, they now also give scores for many of these more restricted abilities, identifying particular strengths and weaknesses of an individual.[24]
Other theories
An alternative to standard IQ tests, meant to test the proximal development of children, originated in the writings of psychologist Lev Vygotsky (1896–1934) during his last two years of his life.[50][51] According to Vygotsky, the maximum level of complexity and difficulty of problems that a child is capable to solve under some guidance indicates their level of potential development. The difference between this level of potential and the lower level of unassisted performance indicates the child's zone of proximal development.[52] Combination of the two indexes—the level of actual and the zone of the proximal development—according to Vygotsky, provides a significantly more informative indicator of psychological development than the assessment of the level of actual development alone.[53][54] His ideas on the zone of development were later developed in a number of psychological and educational theories and practices, most notably under the banner of dynamic assessment, which seeks to measure developmental potential[55][56][57] (for instance, in the work of Reuven Feuerstein and his associates,[58] who has criticized standard IQ testing for its putative assumption or acceptance of "fixed and immutable" characteristics of intelligence or cognitive functioning). Dynamic assessment has been further elaborated in the work of Ann Brown, and John D. Bransford and in theories of multiple intelligences authored by Howard Gardner and Robert Sternberg.[59][60]
J.P. Guilford's Structure of Intellect (1967) model of intelligence used three dimensions which when combined yielded a total of 120 types of intelligence. It was popular in the 1970s and early 1980s, but faded owing to both practical problems and theoretical criticisms.[24]
Alexander Luria's earlier work on neuropsychological processes led to the PASS theory (1997). It argued that only looking at one general factor was inadequate for researchers and clinicians who worked with learning disabilities, attention disorders, intellectual disability, and interventions for such disabilities. The PASS model covers four kinds of processes (planning process, attention/arousal process, simultaneous processing, and successive processing). The planning processes involve decision making, problem solving, and performing activities and requires goal setting and self-monitoring.
The attention/arousal process involves selectively attending to a particular stimulus, ignoring distractions, and maintaining vigilance. Simultaneous processing involves the integration of stimuli into a group and requires the observation of relationships. Successive processing involves the integration of stimuli into serial order. The planning and attention/arousal components comes from structures located in the frontal lobe, and the simultaneous and successive processes come from structures located in the posterior region of the cortex.[61][62][63] It has influenced some recent IQ tests, and been seen as a complement to the Cattell-Horn-Carroll theory described above.[24]
Current tests
There are a variety of individually administered IQ tests in use in the English-speaking world.[64][65] The most commonly used individual IQ test series is the Wechsler Adult Intelligence Scale (WAIS) for adults and the Wechsler Intelligence Scale for Children (WISC) for school-age test-takers. Other commonly used individual IQ tests (some of which do not label their standard scores as "IQ" scores) include the current versions of the Stanford-Binet Intelligence Scales, Woodcock-Johnson Tests of Cognitive Abilities, the Kaufman Assessment Battery for Children, the Cognitive Assessment System, and the Differential Ability Scales.
IQ tests that measure intelligence also include:
- Raven's Progressive Matrices
- Cattell Culture Fair III
- Reynolds Intellectual Assessment Scales
- Thurstone's Primary Mental Abilities[66][67]
- Kaufman Brief Intelligence Test[68]
- Multidimensional Aptitude Battery II
- Das–Naglieri cognitive assessment system
- Naglieri Nonverbal Ability Test
IQ scales are ordinally scaled.[69][70][71][72][73] While one standard deviation is 15 points, and two SDs are 30 points, and so on, this does not imply that mental ability is linearly related to IQ, such that IQ 50 means half the cognitive ability of IQ 100. In particular, IQ points are not percentage points.
Reliability and validity
| Pupil | KABC-II | WISC-III | WJ-III |
|---|---|---|---|
| Asher | 90 | 95 | 111 |
| Brianna | 125 | 110 | 105 |
| Colin | 100 | 93 | 101 |
| Danica | 116 | 127 | 118 |
| Elpha | 93 | 105 | 93 |
| Fritz | 106 | 105 | 105 |
| Georgi | 95 | 100 | 90 |
| Hector | 112 | 113 | 103 |
| Imelda | 104 | 96 | 97 |
| Jose | 101 | 99 | 86 |
| Keoku | 81 | 78 | 75 |
| Leo | 116 | 124 | 102 |
Reliability
Psychometricians generally regard IQ tests as having high statistical reliability.[10][76] Reliability represents the measurement consistency of a test.[77] A reliable test produces similar scores upon repetition.[77] On aggregate, IQ tests exhibit high reliability, although test-takers may have varying scores when taking the same test on differing occasions, and although they may have varying scores when taking different IQ tests at the same age. Like all statistical quantities, any particular estimate of IQ has an associated standard error that measures uncertainty about the estimate. For modern tests, the standard error of measurement is about three points.
For individuals with very low scores, the 95% confidence interval may be greater than 40 points, potentially complicating the accuracy of diagnoses of intellectual disability.[78] By the same token, high IQ scores are also significantly less reliable than those near to the population median.[79] Reports of IQ scores much higher than 160 are considered dubious.[80]
With regard to unrepresentative scores, low motivation or high anxiety can occasionally lower a person's score.[77]
Validity as a measure of intelligence
A test being reliable does not automatically equate to a test's validity.[77] While IQ tests are generally considered to measure some forms of intelligence, they may fail to serve as an accurate measure of broader definitions of human intelligence such as creativity and social intelligence. For this reason, Psychologist Wayne Weiten argues that their construct validity must be carefully qualified, and not be overstated.[77] According to Weiten, "IQ tests are valid measures of the kind of intelligence necessary to do well in academic work. But if the purpose is to assess intelligence in a broader sense, the validity of IQ tests is questionable."[77]
Along these same lines, critics such as Keith Stanovich do not dispute the reliability of IQ test scores or their capacity to predict some kinds of achievement, but argue that basing a concept of intelligence on IQ test scores alone neglects other important aspects of mental ability.[10][81] Robert Sternberg, another significant critic of IQ as the main measure of human cognitive abilities, argued that reducing the concept of intelligence to the measure of g does not fully account for the different skills and knowledge types that produce success in human society.[82]
A 2005 study found that "differential validity in prediction suggests that the WAIS-R test may contain cultural influences that reduce the validity of the WAIS-R as a measure of cognitive ability for Mexican American students,"[83] indicating a weaker positive correlation relative to sampled white students. Other recent studies have questioned the culture-fairness of IQ tests when used in South Africa.[84][85] Standard intelligence tests, such as the Stanford-Binet, are often inappropriate for autistic children; the alternative of using developmental or adaptive skills measures are relatively poor measures of intelligence in autistic children, and may have resulted in incorrect claims that a majority of autistic children are of low intelligence.[86]
Some scientists have disputed the value of IQ as a measure of intelligence altogether. In The Mismeasure of Man (1981, expanded edition 1996), evolutionary biologist Stephen Jay Gould compared IQ testing with the now-discredited practice of determining intelligence via craniometry, arguing that both are based on the fallacy of reification, “our tendency to convert abstract concepts into entities”.[87] Gould's argument sparked a great deal of debate,[88][89] and the book is listed as one of Discover Magazine's "25 Greatest Science Books of All Time".[90]
Despite these objections, clinical psychologists generally regard IQ scores as having sufficient statistical validity for many clinical purposes.[24][91]
Test bias or differential item functioning
Differential item functioning (DIF), sometimes referred to as measurement bias, is a phenomenon when participants from different groups (e.g. gender, race, disability) with the same latent abilities give different answers to specific questions on the same IQ test.[92] DIF analysis measures such specific items on a test alongside measuring participants' latent abilities on other similar questions. A consistent different group response to a specific question among similar type of questions can indicate an effect of DIF. It does not count as differential item functioning if both groups have an equally valid chance of giving different responses to the same questions. Such bias can be a result of culture, educational level and other factors that are independent of group traits. DIF is only considered if test-takers from different groups with the same underlying latent ability level have a different chance of giving specific responses.[93] Such questions are usually removed in order to make the test equally fair for both groups. Common techniques for analyzing DIF are item response theory (IRT) based methods, Mantel-Haenszel, and logistic regression.[93]
Flynn effect
Since the early 20th century, raw scores on IQ tests have increased in most parts of the world.[94][95][96] When a new version of an IQ test is normed, the standard scoring is set so performance at the population median results in a score of IQ 100. The phenomenon of rising raw score performance means if test-takers are scored by a constant standard scoring rule, IQ test scores have been rising at an average rate of around three IQ points per decade. This phenomenon was named the Flynn effect in the book The Bell Curve after James R. Flynn, the author who did the most to bring this phenomenon to the attention of psychologists.[97][98]
Researchers have been exploring the issue of whether the Flynn effect is equally strong on performance of all kinds of IQ test items, whether the effect may have ended in some developed nations, whether there are social subgroup differences in the effect, and what possible causes of the effect might be.[99] A 2011 textbook, IQ and Human Intelligence, by N. J. Mackintosh, noted the Flynn effect demolishes the fears that IQ would be decreased. He also asks whether it represents a real increase in intelligence beyond IQ scores.[100] A 2011 psychology textbook, lead authored by Harvard Psychologist Professor Daniel Schacter, noted that humans' inherited intelligence could be going down while acquired intelligence goes up.[101]
Research has revealed that the Flynn effect has slowed or reversed course in several Western countries beginning in the late 20th century. The phenomenon has been termed the negative Flynn effect.[102][103] A study of Norwegian military conscripts' test records found that IQ scores have been falling for generations born after the year 1975, and that the underlying nature of both initial increasing and subsequent falling trends appears to be environmental rather than genetic.[103]
Age
IQ can change to some degree over the course of childhood.[104] However, in one longitudinal study, the mean IQ scores of tests at ages 17 and 18 were correlated at r=0.86 with the mean scores of tests at ages five, six, and seven and at r=0.96 with the mean scores of tests at ages 11, 12, and 13.[10]
For decades, practitioners' handbooks and textbooks on IQ testing have reported IQ declines with age after the beginning of adulthood. However, later researchers pointed out this phenomenon is related to the Flynn effect and is in part a cohort effect rather than a true aging effect. A variety of studies of IQ and aging have been conducted since the norming of the first Wechsler Intelligence Scale drew attention to IQ differences in different age groups of adults. Current consensus is that fluid intelligence generally declines with age after early adulthood, while crystallized intelligence remains intact. Both cohort effects (the birth year of the test-takers) and practice effects (test-takers taking the same form of IQ test more than once) must be controlled to gain accurate data. It is unclear whether any lifestyle intervention can preserve fluid intelligence into older ages.[105]
The exact peak age of fluid intelligence or crystallized intelligence remains elusive. Cross-sectional studies usually show that especially fluid intelligence peaks at a relatively young age (often in the early adulthood) while longitudinal data mostly show that intelligence is stable until mid-adulthood or later. Subsequently, intelligence seems to decline slowly.[106]
Genetics and environment
Environmental and genetic factors play a role in determining IQ. Their relative importance has been the subject of much research and debate.[107]
Heritability
The general figure for the heritability of IQ, according to an authoritative American Psychological Association report, is 0.45 for children, and rises to around 0.75 for late adolescents and adults.[108][109] Heritability measures in infancy are as low as 0.2, around 0.4 in middle childhood, and as high as 0.9 in adulthood.[110][111] One proposed explanation is that people with different genes tend to reinforce the effects of those genes, for example by seeking out different environments.[10][112]
Shared family environment
Family members have aspects of environments in common (for example, characteristics of the home). This shared family environment accounts for 0.25–0.35 of the variation in IQ in childhood. By late adolescence, it is quite low (zero in some studies). The effect for several other psychological traits is similar. These studies have not looked at the effects of extreme environments, such as in abusive families.[10][113][114][115]
Non-shared family environment and environment outside the family
Although parents treat their children differently, such differential treatment explains only a small amount of nonshared environmental influence. One suggestion is that children react differently to the same environment because of different genes. More likely influences may be the impact of peers and other experiences outside the family.[10][114]
Individual genes
A very large proportion of the over 17,000 human genes are thought to have an effect on the development and functionality of the brain.[116] While a number of individual genes have been reported to be associated with IQ, none have a strong effect. Deary and colleagues (2009) reported that no finding of a strong single gene effect on IQ has been replicated.[117] Recent findings of gene associations with normally varying intellectual differences in adults and children continue to show weak effects for any one gene.[118][119][120]
Gene-environment interaction
David Rowe reported an interaction of genetic effects with socioeconomic status, such that the heritability was high in high-SES families, but much lower in low-SES families.[121] In the US, this has been replicated in infants,[122] children,[123] adolescents,[124] and adults.[125] Outside the US, studies show no link between heritability and SES.[126] Some effects may even reverse sign outside the US.[126][127]
Dickens and Flynn (2001) have argued that genes for high IQ initiate an environment-shaping feedback cycle, with genetic effects causing bright children to seek out more stimulating environments that then further increase their IQ. In Dickens' model, environment effects are modeled as decaying over time. In this model, the Flynn effect can be explained by an increase in environmental stimulation independent of it being sought out by individuals. The authors suggest that programs aiming to increase IQ would be most likely to produce long-term IQ gains if they enduringly raised children's drive to seek out cognitively demanding experiences.[128][129]
Interventions
In general, educational interventions, as those described below, have shown short-term effects on IQ, but long-term follow-up is often missing. For example, in the US, very large intervention programs such as the Head Start Program have not produced lasting gains in IQ scores. Even when students improve their scores on standardized tests, they do not always improve their cognitive abilities, such as memory, attention and speed.[130] More intensive, but much smaller projects, such as the Abecedarian Project, have reported lasting effects, often on socioeconomic status variables, rather than IQ.[10]
Recent studies have shown that training in using one's working memory may increase IQ. A study on young adults published in April 2008 by a team from the Universities of Michigan and Bern supports the possibility of the transfer of fluid intelligence from specifically designed working memory training.[131] Further research will be needed to determine nature, extent and duration of the proposed transfer. Among other questions, it remains to be seen whether the results extend to other kinds of fluid intelligence tests than the matrix test used in the study, and if so, whether, after training, fluid intelligence measures retain their correlation with educational and occupational achievement or if the value of fluid intelligence for predicting performance on other tasks changes. It is also unclear whether the training is durable of extended periods of time.[132]
Music
Musical training in childhood correlates with higher than average IQ.[133][134] However, a study of 10,500 twins found no effects on IQ, suggesting that the correlation was caused by genetic confounders.[135] A meta-analysis concluded that "Music training does not reliably enhance children and young adolescents' cognitive or academic skills, and that previous positive findings were probably due to confounding variables."[136]
It is popularly thought that listening to classical music raises IQ. However, multiple attempted replications (e.g.[137]) have shown that this is at best a short-term effect (lasting no longer than 10 to 15 minutes), and is not related to IQ-increase.[138]
Brain anatomy
Several neurophysiological factors have been correlated with intelligence in humans, including the ratio of brain weight to body weight and the size, shape, and activity level of different parts of the brain. Specific features that may affect IQ include the size and shape of the frontal lobes, the amount of blood and chemical activity in the frontal lobes, the total amount of gray matter in the brain, the overall thickness of the cortex, and the glucose metabolic rate.[139]
Health
Health is important in understanding differences in IQ test scores and other measures of cognitive ability. Several factors can lead to significant cognitive impairment, particularly if they occur during pregnancy and childhood when the brain is growing and the blood–brain barrier is less effective. Such impairment may sometimes be permanent, sometimes be partially or wholly compensated for by later growth.
Since about 2010, researchers such as Eppig, Hassel, and MacKenzie have found a very close and consistent link between IQ scores and infectious diseases, especially in the infant and preschool populations and the mothers of these children.[140] They have postulated that fighting infectious diseases strains the child's metabolism and prevents full brain development. Hassel postulated that it is by far the most important factor in determining population IQ. However, they also found that subsequent factors such as good nutrition and regular quality schooling can offset early negative effects to some extent.
Developed nations have implemented several health policies regarding nutrients and toxins known to influence cognitive function. These include laws requiring fortification of certain food products and laws establishing safe levels of pollutants (e.g. lead, mercury, and organochlorides). Improvements in nutrition, and in public policy in general, have been implicated in worldwide IQ increases.
Cognitive epidemiology is a field of research that examines the associations between intelligence test scores and health. Researchers in the field argue that intelligence measured at an early age is an important predictor of later health and mortality differences.
Social correlations
School performance
The American Psychological Association's report Intelligence: Knowns and Unknowns states that wherever it has been studied, children with high scores on tests of intelligence tend to learn more of what is taught in school than their lower-scoring peers. The correlation between IQ scores and grades is about .50. This means that the explained variance is 25%. Achieving good grades depends on many factors other than IQ, such as "persistence, interest in school, and willingness to study" (p. 81).[10]
It has been found that the correlation of IQ scores with school performance depends on the IQ measurement used. For undergraduate students, the Verbal IQ as measured by WAIS-R has been found to correlate significantly (0.53) with the grade point average (GPA) of the last 60 hours (credits). In contrast, Performance IQ correlation with the same GPA was only 0.22 in the same study.[141]
Some measures of educational aptitude correlate highly with IQ tests – for instance, Frey and Detterman (2004) reported a correlation of 0.82 between g (general intelligence factor) and SAT scores;[142] another research found a correlation of 0.81 between g and GCSE scores, with the explained variance ranging "from 58.6% in Mathematics and 48% in English to 18.1% in Art and Design".[143]
Job performance
According to Schmidt and Hunter, "for hiring employees without previous experience in the job the most valid predictor of future performance is general mental ability."[14] The validity of IQ as a predictor of job performance is above zero for all work studied to date, but varies with the type of job and across different studies, ranging from 0.2 to 0.6.[144] The correlations were higher when the unreliability of measurement methods was controlled for.[10] While IQ is more strongly correlated with reasoning and less so with motor function,[145] IQ-test scores predict performance ratings in all occupations.[14] That said, for highly qualified activities (research, management) low IQ scores are more likely to be a barrier to adequate performance, whereas for minimally-skilled activities, athletic strength (manual strength, speed, stamina, and coordination) are more likely to influence performance.[14] The prevailing view among academics is that it is largely through the quicker acquisition of job-relevant knowledge that higher IQ mediates job performance. This view has been challenged by Byington & Felps (2010), who argued that "the current applications of IQ-reflective tests allow individuals with high IQ scores to receive greater access to developmental resources, enabling them to acquire additional capabilities over time, and ultimately perform their jobs better."[146]
In establishing a causal direction to the link between IQ and work performance, longitudinal studies by Watkins and others suggest that IQ exerts a causal influence on future academic achievement, whereas academic achievement does not substantially influence future IQ scores.[147] Treena Eileen Rohde and Lee Anne Thompson write that general cognitive ability, but not specific ability scores, predict academic achievement, with the exception that processing speed and spatial ability predict performance on the SAT math beyond the effect of general cognitive ability.[148]
The US military has minimum enlistment standards at about the IQ 85 level. There have been two experiments with lowering this to 80 but in both cases these men could not master soldiering well enough to justify their costs.[149]
Income
It has been suggested that "in economic terms it appears that the IQ score measures something with decreasing marginal value" and it "is important to have enough of it, but having lots and lots does not buy you that much".[150][151] However, large-scale longitudinal studies indicate an increase in IQ translates into an increase in performance at all levels of IQ: i.e. ability and job performance are monotonically linked at all IQ levels.[152][153]
The link from IQ to wealth is much less strong than that from IQ to job performance. Some studies indicate that IQ is unrelated to net worth.[154][155] The American Psychological Association's 1995 report Intelligence: Knowns and Unknowns stated that IQ scores accounted for about a quarter of the social status variance and one-sixth of the income variance. Statistical controls for parental SES eliminate about a quarter of this predictive power. Psychometric intelligence appears as only one of a great many factors that influence social outcomes.[10] Charles Murray (1998) showed a more substantial effect of IQ on income independent of family background.[156] In a meta-analysis, Strenze (2006) reviewed much of the literature and estimated the correlation between IQ and income to be about 0.23.[15]
Some studies claim that IQ only accounts for (explains) a sixth of the variation in income because many studies are based on young adults, many of whom have not yet reached their peak earning capacity, or even their education. On pg 568 of The g Factor, Arthur Jensen claims that although the correlation between IQ and income averages a moderate 0.4 (one sixth or 16% of the variance), the relationship increases with age, and peaks at middle age when people have reached their maximum career potential. In the book, A Question of Intelligence, Daniel Seligman cites an IQ income correlation of 0.5 (25% of the variance).
A 2002 study[157] further examined the impact of non-IQ factors on income and concluded that an individual's location, inherited wealth, race, and schooling are more important as factors in determining income than IQ.
Crime
The American Psychological Association's 1996 report Intelligence: Knowns and Unknowns stated that the correlation between IQ and crime was −0.2. It was −0.19 between IQ scores and number of juvenile offenses in a large Danish sample; with social class controlled, the correlation dropped to −0.17. A correlation of 0.20 means that the explained variance is 4%. The causal links between psychometric ability and social outcomes may be indirect. Children with poor scholastic performance may feel alienated. Consequently, they may be more likely to engage in delinquent behavior, compared to other children who do well.[10]
In his book The g Factor (1998), Arthur Jensen cited data which showed that, regardless of race, people with IQs between 70 and 90 have higher crime rates than people with IQs below or above this range, with the peak range being between 80 and 90.
The 2009 Handbook of Crime Correlates stated that reviews have found that around eight IQ points, or 0.5 SD, separate criminals from the general population, especially for persistent serious offenders. It has been suggested that this simply reflects that "only dumb ones get caught" but there is similarly a negative relation between IQ and self-reported offending. That children with conduct disorder have lower IQ than their peers "strongly argues" for the theory.[158]
A study of the relationship between US county-level IQ and US county-level crime rates found that higher average IQs were associated with lower levels of property crime, burglary, larceny rate, motor vehicle theft, violent crime, robbery, and aggravated assault. These results were "not confounded by a measure of concentrated disadvantage that captures the effects of race, poverty, and other social disadvantages of the county."[159][160]
Health and mortality
Multiple studies conducted in Scotland have found that higher IQs in early life are associated with lower mortality and morbidity rates later in life.[161][162]
Other accomplishments
| Accomplishment | IQ | Test/study | Year |
|---|---|---|---|
| MDs, JDs, and PhDs | 125 | WAIS-R | 1987 |
| College graduates | 112 | KAIT | 2000 |
| K-BIT | 1992 | ||
| 115 | WAIS-R | ||
| 1–3 years of college | 104 | KAIT | |
| K-BIT | |||
| 105–110 | WAIS-R | ||
| Clerical and sales workers | 100–105 | ||
| High school graduates, skilled workers (e.g., electricians, cabinetmakers) | 100 | KAIT | |
| WAIS-R | |||
| 97 | K-BIT | ||
| 1–3 years of high school (completed 9–11 years of school) | 94 | KAIT | |
| 90 | K-BIT | ||
| 95 | WAIS-R | ||
| Semi-skilled workers (e.g. truck drivers, factory workers) | 90–95 | ||
| Elementary school graduates (completed eighth grade) | 90 | ||
| Elementary school dropouts (completed 0–7 years of school) | 80–85 | ||
| Have 50/50 chance of reaching high school | 75 |
| Accomplishment | IQ | Test/study | Year |
|---|---|---|---|
| Professional and technical | 112 | ||
| Managers and administrators | 104 | ||
| Clerical workers, sales workers, skilled workers, craftsmen, and foremen | 101 | ||
| Semi-skilled workers (operatives, service workers, including private household) | 92 | ||
| Unskilled workers | 87 |
| Accomplishment | IQ | Test/study | Year |
|---|---|---|---|
| Adults can harvest vegetables, repair furniture | 60 | ||
| Adults can do domestic work | 50 |
There is considerable variation within and overlap among these categories. People with high IQs are found at all levels of education and occupational categories. The biggest difference occurs for low IQs with only an occasional college graduate or professional scoring below 90.[24]
Group-IQ or the collective intelligence factor c
With operationalization and methodology derived from the general intelligence factor g, a new scientific understanding of collective intelligence, defined as a group's general ability to perform a wide range of tasks,[166] aims to explain intelligent behavior of groups. Goal is to detect and explain a general intelligence factor c for groups, parallel to the g factor for individuals. As g is highly interrelated with the concept of IQ,[167][168] this measurement of collective intelligence can be interpreted as intelligence quotient for groups (Group-IQ) even though the score is not a quotient per se. Current evidence suggests that this Group-IQ is only moderately correlated with group members' IQs but with other correlates such as group members' Theory of Mind.[166]
Group differences
Among the most controversial issues related to the study of intelligence is the observation that intelligence measures such as IQ scores vary between ethnic and racial groups. While there is little scholarly debate about the existence of some of these differences, current scientific consensus tells us that there is no evidence for a genetic component behind them.[169][170][171][172] The existence of differences in IQ between the sexes remains controversial, and largely depends on which tests are performed.[173][174]
Sex
With the advent of the concept of g or general intelligence, many researchers have argued that there are no significant sex differences in general intelligence,[175][174][176] though ability in particular types of intelligence does appear to vary.[176][177] Thus, while some test batteries show slightly greater intelligence in males, others show greater intelligence in females.[176][177] In particular, studies have shown female subjects performing better on tasks related to verbal ability,[178] and males performing better on tasks related to rotation of objects in space, often categorized as spatial ability.[179] These differences obtain, as Hunt (2010) observes, "even though men and women are essentially equal in general intelligence".
Some research indicates that male advantages on some cognitive tests are minimized when controlling for socioeconomic factors.[180][181] Other research has concluded that there is slightly larger variability in male scores in certain ares compared to female scores, which results in slightly more males than females in the top and bottom of the IQ distribution.[182]
The existence of differences between male and female performance on math-related tests is contested,[183] and a meta-analysis focusing on gender differences in math performance found nearly identical performance for boys and girls.[184] Currently, most IQ tests, including popular batteries such as the WAIS and the WISC-R, are constructed so that there are no overall score differences between females and males.[10][185][186]
Race
While the concept of "race" is a social construct,[187] discussions of a purported relationship between race and intelligence, as well as claims of genetic differences in intelligence along racial lines, have appeared in both popular science and academic research since the inception of IQ testing in the early 20th century. Despite the tremendous amount of research done on the topic, no scientific evidence has emerged that the average IQ scores of different population groups can be attributed to genetic differences between those groups.[188]
A 1996 task force investigation on intelligence sponsored by the American Psychological Association concluded that there were significant variations in IQ across races.[10] However, a systematic analysis by William Dickens and James Flynn (2006) showed the gap between black and white Americans to have closed dramatically during the period between 1972 and 2002, suggesting that, in their words, the "constancy of the Black-White IQ gap is a myth."[189]
The problem of determining the causes underlying racial variation has been discussed at length as a classic question of "nature versus nurture", for instance by Alan S. Kaufman[190] and Nathan Brody.[191] Researchers such as statistician Bernie Devlin have argued that there are insufficient data to conclude that the black-white gap is due to genetic influences.[192] Dickens and Flynn argued more positively that their results refute the possibility of a genetic origin, concluding that "the environment has been responsible" for observed differences.[189] A review article published in 2012 by leading scholars on human intelligence reached a similar conclusion, after reviewing the prior research literature, that group differences in IQ are best understood as environmental in origin.[193] More recently, geneticist and neuroscientist Kevin Mitchell has argued, on the basis of basic principles of population genetics, that "systematic genetic differences in intelligence between large, ancient populations" are "inherently and deeply implausible".[194]
The effects of stereotype threat have been proposed as an explanation for differences in IQ test performance between racial groups,[195][196] as have issues related to cultural difference and access to education.[197][198]
Public policy
In the United States, certain public policies and laws regarding military service,[199][200] education, public benefits,[201] capital punishment,[202] and employment incorporate an individual's IQ into their decisions. However, in the case of Griggs v. Duke Power Co. in 1971, for the purpose of minimizing employment practices that disparately impacted racial minorities, the U.S. Supreme Court banned the use of IQ tests in employment, except when linked to job performance via a job analysis. Internationally, certain public policies, such as improving nutrition and prohibiting neurotoxins, have as one of their goals raising, or preventing a decline in, intelligence.
A diagnosis of intellectual disability is in part based on the results of IQ testing. Borderline intellectual functioning is a categorization where a person has below average cognitive ability (an IQ of 71–85), but the deficit is not as severe as intellectual disability (70 or below).
In the United Kingdom, the eleven plus exam which incorporated an intelligence test has been used from 1945 to decide, at eleven years of age, which type of school a child should go to. They have been much less used since the widespread introduction of comprehensive schools.

Classification
IQ classification is the practice used by IQ test publishers for designating IQ score ranges into various categories with labels such as "superior" or "average."[204] IQ classification was preceded historically by attempts to classify human beings by general ability based on other forms of behavioral observation. Those other forms of behavioral observation are still important for validating classifications based on IQ tests.
High IQ societies
There are social organizations, some international, which limit membership to people who have scores as high as or higher than the 98th percentile (2 standard deviations above the mean) on some IQ test or equivalent. Mensa International is perhaps the best known of these. The largest 99.9th percentile (3 standard deviations above the mean) society is the Triple Nine Society.
See also
- Raven's Progressive Matrices
- Wechsler Adult Intelligence Scale
- Woodcock–Johnson Tests of Cognitive Abilities
- Stanford–Binet Intelligence Scales
- Emotional intelligence (EI), also known as emotional quotient (EQ) and emotional intelligence quotient (EIQ)
References
- Braaten, Ellen B.; Norman, Dennis (1 November 2006). "Intelligence (IQ) Testing". Pediatrics in Review. 27 (11): 403–408. doi:10.1542/pir.27-11-403. ISSN 0191-9601. Retrieved 22 January 2020.
- Stern 1914, pp. 48–58 (1912 original German edition by Stern); 70–84 (1914 English translation by Whipple)
- Glossary of Important Assessment and Measurement Terms. Philadelphia, PA: National Council on Measurement in Education. 2016. intelligence quotient (IQ). Archived from the original on 2017-07-22. Retrieved 2017-07-01.
- Gottfredson 2009, pp. 31–32
- Neisser, Ulrich (1997). "Rising Scores on Intelligence Tests". American Scientist. 85 (5): 440–447. Bibcode:1997AmSci..85..440N. Archived from the original on 4 November 2016. Retrieved 1 December 2017.CS1 maint: ref=harv (link)
- Hunt 2011, p. 5 "As mental testing expanded to the evaluation of adolescents and adults, however, there was a need for a measure of intelligence that did not depend upon mental age. Accordingly the intelligence quotient (IQ) was developed. ... The narrow definition of IQ is a score on an intelligence test ... where 'average' intelligence, that is the median level of performance on an intelligence test, receives a score of 100, and other scores are assigned so that the scores are distributed normally about 100, with a standard deviation of 15. Some of the implications are that: 1. Approximately two-thirds of all scores lie between 85 and 115. 2. Five percent (1/20) of all scores are above 125, and one percent (1/100) are above 135. Similarly, five percent are below 75 and one percent below 65."
- Haier, Richard (2016-12-28). The Neuroscience of Intelligence. Cambridge University Press. pp. 18–19. ISBN 9781107461437.
- Markus Jokela; G. David Batty; Ian J. Deary; Catharine R. Gale; Mika Kivimäki (2009). "Low Childhood IQ and Early Adult Mortality: The Role of Explanatory Factors in the 1958 British Birth Cohort". Pediatrics. 124 (3): e380–e388. doi:10.1542/peds.2009-0334. PMID 19706576.
- Deary Ian J.; Batty G. David (2007). "Cognitive epidemiology". J Epidemiol Community Health. 61 (5): 378–384. doi:10.1136/jech.2005.039206. PMC 2465694. PMID 17435201.
- Neisser, Ulric; Boodoo, Gwyneth; Bouchard, Thomas J., Jr.; Boykin, A. Wade; Brody, Nathan; Ceci, Stephen J.; Halpern, Diane F.; Loehlin, John C.; Perloff, Robert; Sternberg, Robert J.; Urbina, Susana (1996). "Intelligence: Knowns and unknowns". American Psychologist. 51 (2): 77–101. doi:10.1037/0003-066x.51.2.77.
- Johnson, Wendy; Turkheimer, Eric; Gottesman, Irving I.; Bouchard, Thomas J. (August 2009). "Beyond Heritability". Current Directions in Psychological Science. 18 (4): 217–220. doi:10.1111/j.1467-8721.2009.01639.x. PMC 2899491. PMID 20625474.
- Turkheimer, Eric (Spring 2008). "A Better Way to Use Twins for Developmental Research" (PDF). LIFE Newsletter: 2–5. Retrieved 29 June 2010.
- Devlin, B.; Daniels, Michael; Roeder, Kathryn (1997). "The heritability of IQ". Nature. 388 (6641): 468–71. Bibcode:1997Natur.388..468D. doi:10.1038/41319. PMID 9242404.
- Schmidt, Frank L.; Hunter, John E. (1998). "The validity and utility of selection methods in personnel psychology: Practical and theoretical implications of 85 years of research findings" (PDF). Psychological Bulletin. 124 (2): 262–74. CiteSeerX 10.1.1.172.1733. doi:10.1037/0033-2909.124.2.262. Archived from the original (PDF) on 2014-06-02. Retrieved 2017-10-25.
- Strenze, Tarmo (September 2007). "Intelligence and socioeconomic success: A meta-analytic review of longitudinal research". Intelligence. 35 (5): 401–426. doi:10.1016/j.intell.2006.09.004.
The correlation with income is considerably lower, perhaps even disappointingly low, being about the average of the previous meta-analytic estimates (.15 by Bowles et al., 2001; and .27 by Ng et al., 2005). But...other predictors, studied in this paper, are not doing any better in predicting income, which demonstrates that financial success is difficult to predict by any variable. This claim is further corroborated by the meta-analysis of Ng et al. (2005) where the best predictor of salary was educational level with a correlation of only .29. It should also be noted that the correlation of .23 is about the size of the average meta-analytic result in psychology (Hemphill, 2003) and cannot, therefore, be treated as insignificant.
- Terman 1916, p. 79 "What do the above IQ's imply in such terms as feeble-mindedness, border-line intelligence, dullness, normality, superior intelligence, genius, etc.? When we use these terms two facts must be born in mind: (1) That the boundary lines between such groups are absolutely arbitrary, a matter of definition only; and (2) that the individuals comprising one of the groups do not make up a homogeneous type."
- Wechsler 1939, p. 37 "The earliest classifications of intelligence were very rough ones. To a large extent they were practical attempts to define various patterns of behavior in medical-legal terms."
- Bulmer, M (1999). "The development of Francis Galton's ideas on the mechanism of heredity". Journal of the History of Biology. 32 (3): 263–292. doi:10.1023/a:1004608217247. PMID 11624207.
- Cowan, R. S. (1972). "Francis Galton's contribution to genetics". Journal of the History of Biology. 5 (2): 389–412. doi:10.1007/bf00346665. PMID 11610126.
- Burbridge, D (2001). "Francis Galton on twins, heredity and social class". British Journal for the History of Science. 34 (3): 323–340. doi:10.1017/s0007087401004332. PMID 11700679.
- Fancher, R. E. (1983). "Biographical origins of Francis Galton's psychology". Isis. 74 (2): 227–233. doi:10.1086/353245. PMID 6347965.
- Kaufman 2009, p. 21 "Galton's so-called intelligence test was misnamed."
- Gillham, Nicholas W. (2001). "Sir Francis Galton and the birth of eugenics". Annual Review of Genetics. 35 (1): 83–101. doi:10.1146/annurev.genet.35.102401.090055. PMID 11700278.
- Kaufman 2009
- Nicolas, S.; Andrieu, B.; Croizet, J.-C.; Sanitioso, R. B.; Burman, J. T. (2013). "Sick? Or slow? On the origins of intelligence as a psychological object". Intelligence. 41 (5): 699–711. doi:10.1016/j.intell.2013.08.006. (This is an open access article, made freely available by Elsevier.)
- Terman, Lewis M.; Lyman, Grace; Ordahl, George; Ordahl, Louise; Galbreath, Neva; Talbert, Wilford (1915). "The Stanford revision of the Binet-Simon scale and some results from its application to 1000 non-selected children". Journal of Educational Psychology. 6 (9): 551–62. doi:10.1037/h0075455.
- Wallin, J. E. W. (1911). "The new clinical psychology and the psycho-clinicist". Journal of Educational Psychology. 2 (3): 121–32. doi:10.1037/h0075544.
- Richardson, John T. E. (2003). "Howard Andrew Knox and the origins of performance testing on Ellis Island, 1912-1916". History of Psychology. 6 (2): 143–70. doi:10.1037/1093-4510.6.2.143. PMID 12822554.
- Deary, I. J. (2001). Intelligence. A Very Short Introduction. Oxford University Press. pp. 6–12. ISBN 9780192893215.
- Gould, Stephen Jay (1996). The Mismeasure of Man (Revised and Expanded ed.). New York: W. W. Norton. ISBN 978-0-393-31425-0.
- Kennedy, Carrie H.; McNeil, Jeffrey A. (2006). "A history of military psychology". In Kennedy, Carrie H.; Zillmer, Eric (eds.). Military Psychology: Clinical and Operational Applications. New York: Guilford Press. pp. 1–17. ISBN 978-1-57230-724-7.
- Katzell, Raymond A.; Austin, James T. (1992). "From then to now: The development of industrial-organizational psychology in the United States". Journal of Applied Psychology. 77 (6): 803–35. doi:10.1037/0021-9010.77.6.803.
- Kevles, D. J. (1968). "Testing the Army's Intelligence: Psychologists and the Military in World War I". The Journal of American History. 55 (3): 565–81. doi:10.2307/1891014. JSTOR 1891014.
- "Eugenics". Unified Medical Language System (Psychological Index Terms). National Library of Medicine. 26 September 2010.
- Galton, Francis (July 1904). "Eugenics: Its Definition, Scope, and Aims". The American Journal of Sociology. X (1): 82, 1st paragraph. Bibcode:1904Natur..70...82.. doi:10.1038/070082a0. Archived from the original on 3 November 2007. Retrieved 27 December 2010.
Eugenics is the science which deals with all influences that improve the inborn qualities of a race; also with those that develop them to the utmost advantage.
- Susan Currell; Christina Cogdell (2006). Popular Eugenics: National Efficiency and American Mass Culture in the 1930s. Ohio University Press. pp. 2–3. ISBN 978-0-8214-1691-4.
- "Eugenics and Economics in the Progressive Era" (PDF).
- "Origins of Eugenics: From Sir Francis Galton to Virginia's Racial Integrity Act of 1924". University of Virginia: Historical Collections at the Claude Moore Health Sciences Library. Retrieved October 25, 2019.
- Norrgard, K. (2008). "Human testing, the eugenics movement, and IRBs". Nature Education. 1: 170.
- Galton, Francis (1869). "Hereditary Genius" (PDF). p. 64. Retrieved October 1, 2019.
- "The birth of American intelligence testing". Retrieved 2017-11-11.
- "America's Hidden History: The Eugenics Movement | Learn Science at Scitable". www.nature.com. Retrieved 2017-11-11.
- "Social Origins of Eugenics". www.eugenicsarchive.org. Retrieved 2017-11-11.
- "The Horrifying American Roots of Nazi Eugenics". hnn.us. Retrieved 2017-11-11.
- Vizcarrondo, Felipe E. (August 2014). "Human Enhancement: The New Eugenics". The Linacre Quarterly. 81 (3): 239–243. doi:10.1179/2050854914Y.0000000021. PMC 4135459. PMID 25249705.
- Regalado, Antonio. "Eugenics 2.0: We're at the Dawn of Choosing Embryos by Health, Height, and More". Technology Review. Retrieved 20 November 2019.
- LeMieux, Julianna (1 April 2019). "Polygenic Risk Scores and Genomic Prediction: Q&A with Stephen Hsu". Genetic Engineering and Biotechnology News. Retrieved 20 November 2019.
- Lubinski, David (2004). "Introduction to the Special Section on Cognitive Abilities: 100 Years After Spearman's (1904) "'General Intelligence,' Objectively Determined and Measured"". Journal of Personality and Social Psychology. 86 (1): 96–111. doi:10.1037/0022-3514.86.1.96. PMID 14717630.
- Carroll, J.B. (1993). Human cognitive abilities: A survey of factor-analytic studies. New York: Cambridge University Press. ISBN 978-0-521-38712-5.
- Mindes, Gayle (2003). Assessing Young Children. Merrill/Prentice Hall. p. 158. ISBN 9780130929082.
- Haywood, H. Carl; Lidz, Carol S. (2006). Dynamic Assessment in Practice: Clinical and Educational Applications. Cambridge University Press. p. 1. ISBN 9781139462075.
- Vygotsky, L.S. (19332-34/1997). The Problem of Age. in The Collected Works of L. S. Vygotsky, Volume 5, 1998, pp. 187–205
- Chaiklin, S. (2003). "The Zone of Proximal Development in Vygotsky's analysis of learning and instruction." In Kozulin, A., Gindis, B., Ageyev, V. & Miller, S. (Eds.) Vygotsky's educational theory and practice in cultural context. 39–64. Cambridge: Cambridge University
- Zaretskii, V.K. (2009). The Zone of Proximal Development What Vygotsky Did Not Have Time to Write. Journal of Russian and East European Psychology, vol. 47, no. 6, November–December 2009, pp. 70–93
- Sternberg, R.S.; Grigorenko, E.L. (2001). "All testing is dynamic testing". Issues in Education. 7 (2): 137–170.
- Sternberg, R.J. & Grigorenko, E.L. (2002). Dynamic testing: The nature and measurement of learning potential. Cambridge (UK): University of Cambridge
- Haywood, C.H. & Lidz, C.S. (2007). Dynamic assessment in practice: Clinical and educational applications. New York: Cambridge University Press
- Feuerstein, R., Feuerstein, S., Falik, L & Rand, Y. (1979; 2002). Dynamic assessments of cognitive modifiability. ICELP Press, Jerusalem: Israel
- Dodge, Kenneth A. Foreword, xiii–xv. In Haywood, H. Carl & Lidz, Carol Schneider. Dynamic Assessment in Practice: Clinical And Educational Applications. Cambridge University Press, 2006, p.xiii-xiv
- Kozulin, A. (2014). Dynamic assessment in search of its identity. In Yasnitsky, A., van der Veer, R., & Ferrari, M. (Eds.). (2014). The Cambridge Handbook of Cultural-Historical Psychology. Cambridge University Press (pp. 126–147)
- Das, J.P.; Kirby, J.; Jarman, R.F. (1975). "Simultaneous and successive synthesis: An alternative model for cognitive abilities". Psychological Bulletin. 82: 87–103. doi:10.1037/h0076163.
- Das, J.P. (2000). "A better look at intelligence". Current Directions in Psychological Science. 11: 28–33. doi:10.1111/1467-8721.00162.
- Naglieri, J.A.; Das, J.P. (2002). "Planning, attention, simultaneous, and successive cognitive processes as a model for assessment". School Psychology Review. 19: 423–442.
- Urbina 2011, Table 2.1 Major Examples of Current Intelligence Tests
- Flanagan & Harrison 2012, chapters 8–13, 15–16 (discussing Wechsler, Stanford-Binet, Kaufman, Woodcock-Johnson, DAS, CAS, and RIAS tests)
- "Primary Mental Abilities Test | psychological test". Encyclopædia Britannica. Retrieved 2015-11-26.
- "Defining and Measuring Psychological Attributes". homepages.rpi.edu. Retrieved 2015-11-26.
- Bain, Sherry K.; Jaspers, Kathryn E. (2010-04-01). "Test Review: Review of Kaufman Brief Intelligence Test, Second Edition Kaufman, A. S., & Kaufman, N. L. (2004). Kaufman Brief Intelligence Test, Second Edition. Bloomington, MN: Pearson, Inc". Journal of Psychoeducational Assessment. 28 (2): 167–174. doi:10.1177/0734282909348217. ISSN 0734-2829.
- Mussen, Paul Henry (1973). Psychology: An Introduction. Lexington (MA): Heath. p. 363. ISBN 978-0-669-61382-7.
The I.Q. is essentially a rank; there are no true "units" of intellectual ability.
- Truch, Steve (1993). The WISC-III Companion: A Guide to Interpretation and Educational Intervention. Austin (TX): Pro-Ed. p. 35. ISBN 978-0-89079-585-9.
An IQ score is not an equal-interval score, as is evident in Table A.4 in the WISC-III manual.
- Bartholomew, David J. (2004). Measuring Intelligence: Facts and Fallacies. Cambridge: Cambridge University Press. p. 50. ISBN 978-0-521-54478-8. Lay summary (27 July 2010).
When we come to quantities like IQ or g, as we are presently able to measure them, we shall see later that we have an even lower level of measurement—an ordinal level. This means that the numbers we assign to individuals can only be used to rank them—the number tells us where the individual comes in the rank order and nothing else.
- Mackintosh, N. J. (1998). IQ and Human Intelligence. Oxford: Oxford University Press. pp. 30–31. ISBN 978-0-19-852367-3.
In the jargon of psychological measurement theory, IQ is an ordinal scale, where we are simply rank-ordering people. ... It is not even appropriate to claim that the 10-point difference between IQ scores of 110 and 100 is the same as the 10-point difference between IQs of 160 and 150
- Stevens, S. S. (1946). "On the Theory of Scales of Measurement". Science. 103 (2684): 677–680. Bibcode:1946Sci...103..677S. doi:10.1126/science.103.2684.677. PMID 17750512.
- Kaufman 2009, Figure 5.1 IQs earned by preadolescents (ages 12–13) who were given three different IQ tests in the early 2000s
- Kaufman 2013, Figure 3.1 "Source: A. S. Kaufman. IQ Testing 101 (New York: Springer, 2009). Adapted with permission."
- Mackintosh 2011, p. 169 "after the age of 8–10, IQ scores remain relatively stable: the correlation between IQ scores from age 8 to 18 and IQ at age 40 is over 0.70."
- Weiten W (2016). Psychology: Themes and Variations. Cengage Learning. p. 281. ISBN 978-1305856127.
- Whitaker, Simon (1 April 2010). "Error in the estimation of intellectual ability in the low range using the WISC-IV and WAIS-III". Personality and Individual Differences. 48 (5): 517–521. doi:10.1016/j.paid.2009.11.017. Retrieved 22 January 2020.
- Lohman, David F.; Foley Nicpon, Megan (2012). "Chapter 12: Ability Testing & Talent Identification" (PDF). In Hunsaker, Scott (ed.). Identification: The Theory and Practice of Identifying Students for Gifted and Talented Education Services. Waco (TX): Prufrock. pp. 287–386. ISBN 978-1-931280-17-4. Lay summary (14 July 2013).
The concerns associated with SEMs [standard errors of measurement] are actually substantially worse for scores at the extremes of the distribution, especially when scores approach the maximum possible on a test ... when students answer most of the items correctly. In these cases, errors of measurement for scale scores will increase substantially at the extremes of the distribution. Commonly the SEM is from two to four times larger for very high scores than for scores near the mean (Lord, 1980).
- Urbina, Susana (2011). "Chapter 2: Tests of Intelligence". In Sternberg, Robert J.; Kaufman, Scott Barry (eds.). The Cambridge Handbook of Intelligence. Cambridge: Cambridge University Press. pp. 20–38. ISBN 9780521739115. Lay summary (9 February 2012).
[Curve-fitting] is just one of the reasons to be suspicious of reported IQ scores much higher than 160
- Brooks, David (September 14, 2007). "The Waning of I.Q.". The New York Times.
- Sternberg, Robert J., and Richard K. Wagner. "The g-ocentric view of intelligence and job performance is wrong." Current directions in psychological science (1993): 1–5.
- Verney, S. P.; Granholm, E; Marshall, SP; Malcarne, VL; Saccuzzo, DP (2005). "Culture-Fair Cognitive Ability Assessment: Information Processing and Psychophysiological Approaches". Assessment. 12 (3): 303–19. doi:10.1177/1073191105276674. PMID 16123251.
- Shuttleworth-Edwards, Ann; Kemp, Ryan; Rust, Annegret; Muirhead, Joanne; Hartman, Nigel; Radloff, Sarah (2004). "Cross-cultural Effects on IQ Test Performance: AReview and Preliminary Normative Indications on WAIS-III Test Performance". Journal of Clinical and Experimental Neuropsychology. 26 (7): 903–20. doi:10.1080/13803390490510824. PMID 15742541.
- Cronshaw, Steven F.; Hamilton, Leah K.; Onyura, Betty R.; Winston, Andrew S. (2006). "Case for Non-Biased Intelligence Testing Against Black Africans Has Not Been Made: A Comment on Rushton, Skuy, and Bons (2004)". International Journal of Selection and Assessment. 14 (3): 278–87. doi:10.1111/j.1468-2389.2006.00346.x.
- Goldberg Edelson, M. (2006). "Are the Majority of Children With Autism Mentally Retarded?: A Systematic Evaluation of the Data". Focus on Autism and Other Developmental Disabilities. 21 (2): 66–83. doi:10.1177/10883576060210020301.
- Gould, S. J. (1981). The Mismeasure of Man, p. 24. 1996, p. 56.
- Kaplan, Jonathan Michael; Pigliucci, Massimo; Banta, Joshua Alexander (2015). "Gould on Morton, Redux: What can the debate reveal about the limits of data?" (PDF). Studies in History and Philosophy of Biological and Biomedical Sciences. 30: 1–10.
- Weisberg, Michael; Paul, Diane B. (2016-04-19). "Morton, Gould, and Bias: A Comment on "The Mismeasure of Science"". PLoS Biology. 14 (4). doi:10.1371/journal.pbio.1002444. ISSN 1544-9173. PMC 4836680. PMID 27092558.
- Discover Editors (2006). "25 Greatest Science Books of All Time". Discover 27 (Dec. 8).
- Anastasi, Anne; Urbina, Susana (1997). Psychological Testing (Seventh ed.). Upper Saddle River (NJ): Prentice Hall. pp. 326–327. ISBN 978-0-02-303085-7. Lay summary (28 July 2010).CS1 maint: ref=harv (link)
- Embretson, S. E., Reise, S. P. (2000).Item Response Theory for Psychologists. New Jersey: Lawrence Erlbaum.
- Zumbo, B.D. (2007). "Three generations of differential item functioning (DIF) analyses: Considering where it has been, where it is now, and where it is going". Language Assessment Quarterly. 4 (2): 223–233. doi:10.1080/15434300701375832.
- Ulric Neisser; James R. Flynn; Carmi Schooler; Patricia M. Greenfield; Wendy M. Williams; Marian Sigman; Shannon E. Whaley; Reynaldo Martorell; Richard Lynn; Robert M. Hauser; David W. Grissmer; Stephanie Williamson; Sheila Nataraj Kirby; Mark Berends; Stephen J. Ceci; Tina B. Rosenblum; Matthew Kumpf; Min-Hsiung Huang; Irwin D. Waldman; Samuel H. Preston; John C. Loehlin (1998). Neisser, Ulric (ed.). The Rising Curve: Long-Term Gains in IQ and Related Measures. APA Science Volume Series. Washington (DC): American Psychological Association. ISBN 978-1-55798-503-3.CS1 maint: ref=harv (link)
- Mackintosh, N. J. (1998). IQ and Human Intelligence. Oxford: Oxford University Press. ISBN 978-0-19-852367-3. Lay summary (9 August 2010).
- Flynn, James R. (2009). What Is Intelligence: Beyond the Flynn Effect (expanded paperback ed.). Cambridge: Cambridge University Press. ISBN 978-0-521-74147-7. Lay summary (18 July 2010).CS1 maint: ref=harv (link)
- Flynn, James R. (1984). "The mean IQ of Americans: Massive gains 1932 to 1978". Psychological Bulletin. 95 (1): 29–51. doi:10.1037/0033-2909.95.1.29.
- Flynn, James R. (1987). "Massive IQ gains in 14 nations: What IQ tests really measure". Psychological Bulletin. 101 (2): 171–91. doi:10.1037/0033-2909.101.2.171.CS1 maint: ref=harv (link)
- Zhou, Xiaobin; Grégoire, Jacques; Zhu, Jianjin (2010). "The Flynn Effect and the Wechsler Scales". In Weiss, Lawrence G.; Saklofske, Donald H.; Coalson, Diane; Raiford, Susan (eds.). WAIS-IV Clinical Use and Interpretation: Scientist-Practitioner Perspectives. Practical Resources for the Mental Health Professional. Alan S. Kaufman (Foreword). Amsterdam: Academic Press. ISBN 978-0-12-375035-8. Lay summary (16 August 2010).CS1 maint: ref=harv (link)
- Mackintosh, N. (2011). IQ and human intelligence. Oxford University Press. p.25-27
- Wegner, Daniel L. Schacter, Daniel T. Gilbert, Daniel M. (2011). Psychology (European ed.). Basingstoke: Palgrave Macmillan. p. 384. ISBN 978-0230579835.
- Dutton, Edward; van der Linden, Dimitri; Lynn, Richard (November 2016). "The negative Flynn Effect: A systematic literature review". Intelligence. 59: 163–169. doi:10.1016/j.intell.2016.10.002. ISSN 0160-2896.
- Bratsberg, Bernt; Rogeberg, Ole (2018-06-26). "Flynn effect and its reversal are both environmentally caused". Proceedings of the National Academy of Sciences. 115 (26): 6674–6678. doi:10.1073/pnas.1718793115. PMC 6042097. PMID 29891660.
- Kaufman, Alan S. (2009). IQ Testing 101. New York: Springer Publishing. pp. 220–222. ISBN 978-0-8261-0629-2. Lay summary (10 August 2010).
- Kaufman, Alan S. (2009). IQ Testing 101. New York: Springer Publishing. Chapter 8. ISBN 978-0-8261-0629-2. Lay summary (10 August 2010).
- Desjardins, Richard; Warnke, Arne Jonas (2012). "Ageing and Skills". OECD Education Working Papers. doi:10.1787/5k9csvw87ckh-en. hdl:10419/57089.
- Tucker-Drob, Elliot M; Briley, Daniel A (2014), "Continuity of Genetic and Environmental Influences on Cognition across the Life Span: A Meta-Analysis of Longitudinal Twin and Adoption Studies", Psychological Bulletin, 140 (4): 949–979, doi:10.1037/a0035893, PMC 4069230, PMID 24611582
- Sebastian, A. B. (2014-10-13). "Intelligence: The History of Psychometrics". Institute for Ethics and Emerging Technologies. white paper.
- Neisser, Ulric; Boodoo, Gwyneth; Bouchard, Thomas J. Jr.; Boykin, A. Wade; Brody, Nathan; Ceci, Stephen J.; Halpern, Diane F.; Loehlin, John C.; et al. (1996). "Intelligence: Knowns and unknowns". American Psychologist. 51 (2): 77–101. doi:10.1037/0003-066X.51.2.77.
- Bouchard, Thomas J. (7 August 2013). "The Wilson Effect: The Increase in Heritability of IQ With Age". Twin Research and Human Genetics. 16 (5): 923–930. doi:10.1017/thg.2013.54. PMID 23919982.
- Panizzon, Matthew S.; Vuoksimaa, Eero; Spoon, Kelly M.; Jacobson, Kristen C.; Lyons, Michael J.; Franz, Carol E.; Xian, Hong; Vasilopoulos, Terrie; Kremen, William S. (March 2014). "Genetic and environmental influences on general cognitive ability: Is g a valid latent construct?". Intelligence. 43: 65–76. doi:10.1016/j.intell.2014.01.008. PMC 4002017. PMID 24791031.
- Huguet, Guillaume; Schramm, Catherine; Douard, Elise; Jiang, Lai; Labbe, Aurélie; Tihy, Frédérique; Mathonnet, Géraldine; Nizard, Sonia; Lemyre, Emmanuelle; Mathieu, Alexandre; Poline, Jean-Baptiste; Loth, Eva; Toro, Roberto; Schumann, Gunter; Conrod, Patricia; Pausova, Zdenka; Greenwood, Celia; Paus, Tomas; Bourgeron, Thomas; Jacquemont, Sébastien; IMAGEN, Consortium. (1 May 2018). "Measuring and Estimating the Effect Sizes of Copy Number Variants on General Intelligence in Community-Based Samples". JAMA Psychiatry. 75 (5): 447–457. doi:10.1001/jamapsychiatry.2018.0039. PMC 5875373. PMID 29562078.
- Bouchard Jr, TJ (1998). "Genetic and environmental influences on adult intelligence and special mental abilities". Human Biology; an International Record of Research. 70 (2): 257–79. PMID 9549239.
- Plomin, R; Asbury, K; Dunn, J (2001). "Why are children in the same family so different? Nonshared environment a decade later". Canadian Journal of Psychiatry. 46 (3): 225–33. doi:10.1177/070674370104600302. PMID 11320676.
- (Harris 2009)
- Pietropaolo, S.; Crusio, W. E. (2010). "Genes and cognition". Wiley Interdisciplinary Reviews: Cognitive Science. 2 (3): 345–352. doi:10.1002/wcs.135. PMID 26302082.
- Deary, I. J.; Johnson, W.; Houlihan, L. M. (2009). "Genetic foundations of human intelligence" (PDF). Human Genetics. 126 (1): 215–232. doi:10.1007/s00439-009-0655-4. hdl:20.500.11820/c3e0a75b-dad6-4860-91c6-b242221af681. PMID 19294424.
- Davies, G.; Tenesa, A.; Payton, A.; Yang, J.; Harris, S. E.; Liewald, D.; Ke, X.; Hellard, S. Le; Christoforou, A.; et al. (2011). "Genome-wide association studies establish that human intelligence is highly heritable and polygenic". Mol Psychiatry. 16 (10): 996–1005. doi:10.1038/mp.2011.85. PMC 3182557. PMID 21826061.
- Benyamin, B.; Pourcain, B.; Davis, O. S.; Davies, G.; Hansell, N. K.; Brion, M. J.; Kirkpatrick, R. M.; Cents, R. A.; Franic, S.; Miller, M. B.; Haworth, C. M.; Meaburn, E.; Price, T. S.; Evans, D. M.; Timpson, N.; Kemp, J.; Ring, S.; McArdle, W.; Medland, S. E.; Yang, J.; Harris, S. E.; Liewald, D. C.; Scheet, P.; Xiao, X.; Hudziak, J. J.; de Geus, C. Wellcome; Case Control, Trust; Jaddoe, V. W.; Starr, J. M.; Verhulst, F. C.; Pennell, C.; Tiemeier, H.; Iacono, W. G.; Palmer, L. J.; Montgomery, G. W.; Martin, N. G.; Boomsma, D. I.; Posthuma, D.; McGue, M.; Wright, M. J.; Smith, G. Davey; Deary, I. J.; Plomin, R.; Visscher, P. M. (2013). "Childhood intelligence is heritable, highly polygenic and associated with FNBP1L". Mol Psychiatry. 19 (2): 253–8. doi:10.1038/mp.2012.184. PMC 3935975. PMID 23358156.
- Weiss, Volkmar: Das IQ-Gen - verleugnet seit 2015: Eine bahnbrechende Entdeckung und ihre Feinde. Ares Verlag, Graz 2017, ISBN 978-3-902732-87-3
- Rowe, D. C.; Jacobson, K. C. (1999). "Genetic and environmental influences on vocabulary IQ: parental education level as moderator". Child Development. 70 (5): 1151–62. doi:10.1111/1467-8624.00084. PMID 10546338.
- Tucker-Drob, E. M.; Rhemtulla, M.; Harden, K. P.; Turkheimer, E.; Fask, D. (2011). "Emergence of a Gene x Socioeconomic Status Interaction on Infant Mental Ability Between 10 Months and 2 Years". Psychological Science. 22 (1): 125–33. doi:10.1177/0956797610392926. PMC 3532898. PMID 21169524.
- Turkheimer, E.; Haley, A.; Waldron, M.; D'Onofrio, B.; Gottesman, I. I. (2003). "Socioeconomic status modifies heritability of IQ in young children". Psychological Science. 14 (6): 623–628. doi:10.1046/j.0956-7976.2003.psci_1475.x. PMID 14629696.
- Harden, K. P.; Turkheimer, E.; Loehlin, J. C. (2005). "Genotype environment interaction in adolescents' cognitive ability". Behavior Genetics. 35 (6): 804. doi:10.1007/s10519-005-7287-9.
- Bates, Timothy C.; Lewis, Gary J.; Weiss, Alexander (3 September 2013). "Childhood Socioeconomic Status Amplifies Genetic Effects on Adult Intelligence" (PDF). Psychological Science. 24 (10): 2111–2116. doi:10.1177/0956797613488394. PMID 24002887.
- Tucker-Drob, Elliot M.; Bates, Timothy C. (15 December 2015). "Large Cross-National Differences in Gene × Socioeconomic Status Interaction on Intelligence". Psychological Science. 27 (2): 138–149. doi:10.1177/0956797615612727. PMC 4749462. PMID 26671911.
- Hanscombe, K. B.; Trzaskowski, M.; Haworth, C. M.; Davis, O. S.; Dale, P. S.; Plomin, R. (2012). "Socioeconomic Status (SES) and Children's Intelligence (IQ): In a UK-Representative Sample SES Moderates the Environmental, Not Genetic, Effect on IQ". PLOS ONE. 7 (2): e30320. Bibcode:2012PLoSO...730320H. doi:10.1371/journal.pone.0030320. PMC 3270016. PMID 22312423.
- Dickens, William T.; Flynn, James R. (2001). "Heritability estimates versus large environmental effects: The IQ paradox resolved" (PDF). Psychological Review. 108 (2): 346–69. CiteSeerX 10.1.1.139.2436. doi:10.1037/0033-295X.108.2.346. PMID 11381833.
- Dickens, William T.; Flynn, James R. (2002). "The IQ Paradox: Still Resolved" (PDF). Psychological Review. 109 (4): 764–771. doi:10.1037/0033-295x.109.4.764. Archived from the original (PDF) on 2007-03-19.
- Bidwell, Allie (2013-12-13). "Study: High Standardized Test Scores Don't Translate to Better Cognition". U.S. News & World Report. Archived from the original on 2013-12-14. Retrieved 2017-07-01.
- Jaeggi, S. M.; Buschkuehl, M.; Jonides, J.; Perrig, W. J. (2008). "From the Cover: Improving fluid intelligence with training on working memory". Proceedings of the National Academy of Sciences. 105 (19): 6829–33. Bibcode:2008PNAS..105.6829J. doi:10.1073/pnas.0801268105. PMC 2383929. PMID 18443283.
- Sternberg, R. J. (2008). "Increasing fluid intelligence is possible after all". Proceedings of the National Academy of Sciences. 105 (19): 6791–2. Bibcode:2008PNAS..105.6791S. doi:10.1073/pnas.0803396105. PMC 2383939. PMID 18474863.
- Glenn Schellenberg, E. (2004). "Music Lessons Enhance IQ". Psychological Science. 15 (8): 511–4. CiteSeerX 10.1.1.152.4349. doi:10.1111/j.0956-7976.2004.00711.x. PMID 15270994.
- Glenn Schellenberg, E. (2006). "Long-term positive associations between music lessons and IQ". Journal of Educational Psychology. 98 (2): 457–468. CiteSeerX 10.1.1.397.5160. doi:10.1037/0022-0663.98.2.457.
- Mosing; et al. (1 May 2015). "Investigating cognitive transfer within the framework of music practice: genetic pleiotropy rather than causality". Developmental Science. 19 (3): 504–512. doi:10.1111/desc.12306. PMID 25939545.
- Sala, Giovanni; Gobet, Fernand (2017-02-01). "When the music's over. Does music skill transfer to children's and young adolescents' cognitive and academic skills? A meta-analysis". Educational Research Review. 20: 55–67. doi:10.1016/j.edurev.2016.11.005. ISSN 1747-938X.
- Stough, C.; Kerkin, B.; Bates, T. C.; Mangan, G. (1994). "Music and spatial IQ". Personality and Individual Differences. 17 (5): 695. doi:10.1016/0191-8869(94)90145-7.
- Chabris, C. F. (1999). "Prelude or requiem for the 'Mozart effect'?". Nature. 400 (6747): 826–827. Bibcode:1999Natur.400..826C. doi:10.1038/23608. PMID 10476958.
- Deary, I.J.; Penke, L.; Johnson, W. (2010). "The neuroscience of human intelligence differences" (PDF). Nature Reviews Neuroscience. 11 (3): 201–211. doi:10.1038/nrn2793. PMID 20145623.
- Eppig. Christopher. Scientific American."Why is average IQ higher in some places?" 2011.
- Kamphaus, Randy W. (2005). Clinical assessment of child and adolescent intelligence. Springer. ISBN 978-0-387-26299-4.
- Frey, Meredith C.; Detterman, Douglas K. (2004). "Scholastic Assessment org?". Psychological Science. 15 (6): 373–8. doi:10.1111/j.0956-7976.2004.00687.x. PMID 15147489.
- Deary, I; Strand, S; Smith, P; Fernandes, C (2007). "Intelligence and educational achievement". Intelligence. 35 (1): 13–21. doi:10.1016/j.intell.2006.02.001.
- Hunter, John E.; Hunter, Ronda F. (1984). "Validity and utility of alternative predictors of job performance". Psychological Bulletin. 96 (1): 72–98. doi:10.1037/0033-2909.96.1.72.
- Warner, Molly; Ernst, John; Townes, Brenda; Peel, John; Preston, Michael (1987). "Relationships Between IQ and Neuropsychological Measures in Neuropsychiatric Populations: Within-Laboratory and Cross-Cultural Replications Using WAIS and WAIS-R". Journal of Clinical and Experimental Neuropsychology. 9 (5): 545–62. doi:10.1080/01688638708410768. PMID 3667899.
- Byington, Eliza; Felps, Will (2010). "Why do IQ scores predict job performance?". Research in Organizational Behavior. 30: 175–202. doi:10.1016/j.riob.2010.08.003.
- Watkins, M; Lei, P; Canivez, G (2007). "Psychometric intelligence and achievement: A cross-lagged panel analysis". Intelligence. 35 (1): 59–68. CiteSeerX 10.1.1.397.3155. doi:10.1016/j.intell.2006.04.005.
- Rohde, T; Thompson, L (2007). "Predicting academic achievement with cognitive ability". Intelligence. 35 (1): 83–92. doi:10.1016/j.intell.2006.05.004.
- Gottfredson, Linda S. (2006). Flores-Mendoza, C. E.; Colom, R. (eds.). "Social consequences of group differences in cognitive ability" [Consequencias sociais das diferencas de grupo em habilidade cognitiva] (PDF). Introducau a psicologia das diferencas individuais. Porto Allegre, Brazil: ArtMed Publishers: 433–456.
- Detterman and Daniel, 1989.
- Earl Hunt (July 1995). "The Role of Intelligence in Modern Society (July–Aug, 1995)". American Scientist. pp. 4 (Nonlinearities in Intelligence). Archived from the original on May 21, 2006.
- Coward, W. Mark; Sackett, Paul R. (1990). "Linearity of ability-performance relationships: A reconfirmation". Journal of Applied Psychology. 75 (3): 297–300. doi:10.1037/0021-9010.75.3.297.
- Robertson, Kimberley Ferriman; Smeets, Stijn; Lubinski, David; Benbow, Camilla P. (14 December 2010). "Beyond the Threshold Hypothesis" (PDF). Current Directions in Psychological Science. 19 (6): 346–351. doi:10.1177/0963721410391442.
- Henderson, Mark (April 25, 2007). "Brains don't make you rich IQ study finds". The Times. London. Retrieved May 5, 2010.
- "You Don't Have To Be Smart To Be Rich, Study Finds". ScienceDaily. Retrieved 2014-08-26.
- Murray, Charles (1998). Income Inequality and IQ (PDF). AEI Press. ISBN 978-0-8447-7094-9.
- Bowles, Samuel; Gintis, Herbert (2002). "The Inheritance of Inequality". Journal of Economic Perspectives. 16 (3): 3–30. doi:10.1257/089533002760278686.
- Handbook of Crime Correlates; Lee Ellis, Kevin M. Beaver, John Wright; 2009; Academic Press
- Beaver, K. M.; Wright, J. P. (2011). "The association between county-level IQ and county-level crime rates". Intelligence. 39: 22–26. doi:10.1016/j.intell.2010.12.002.
- Beaver, Kevin M. (2013-10-31). "Intelligence is associated with criminal justice processing: Arrest through incarceration". Intelligence. 41 (5): 277–288. doi:10.1016/j.intell.2013.05.001.
- Gottfredson, Linda S.; Deary, Ian J. (2016-06-22). "Intelligence Predicts Health and Longevity, but Why?". Current Directions in Psychological Science. 13 (1): 1–4. doi:10.1111/j.0963-7214.2004.01301001.x.
- Batty, G. David; Deary, Ian J.; Gottfredson, Linda S. (2007). "Premorbid (early life) IQ and Later Mortality Risk: Systematic Review". Annals of Epidemiology. 17 (4): 278–288. CiteSeerX 10.1.1.693.9671. doi:10.1016/j.annepidem.2006.07.010. PMID 17174570.
- Kaufman 2009, p. 126.
- Kaufman, Alan; Lichtenberger, Elizabeth (2002). Assessing adolescent and adult intelligence.
- Kaufman 2009, p. 132.
- Woolley, Anita Williams; Chabris, Christopher F.; Pentland, Alex; Hashmi, Nada; Malone, Thomas W. (29 October 2010). "Evidence for a Collective Intelligence Factor in the Performance of Human Groups". Science. 330 (6004): 686–688. Bibcode:2010Sci...330..686W. doi:10.1126/science.1193147. PMID 20929725.
- Jensen, A.R. (1998). The g factor: The science of mental ability. Westport, CT: Praeger.
- Jensen, Arthur R. (September 1992). "Understandingg in terms of information processing". Educational Psychology Review. 4 (3): 271–308. doi:10.1007/bf01417874.
- Hunt, Earl (2010). Human Intelligence. Cambridge University Press. p. 447. ISBN 978-0-521-70781-7.
- Mackintosh, N. J. (Nicholas John), 1935- (2011). IQ and human intelligence (2nd ed.). Oxford: Oxford University Press. ISBN 978-0-19-958559-5. OCLC 669754008.CS1 maint: multiple names: authors list (link)
- Nisbett, Richard E.; Aronson, Joshua; Blair, Clancy; Dickens, William; Flynn, James; Halpern, Diane F.; Turkheimer, Eric (2012). "Intelligence: New findings and theoretical developments". American Psychologist. 67 (2): 130–159. doi:10.1037/a0026699. ISSN 1935-990X. PMID 22233090.
- Kaplan, Jonathan Michael (January 2015). "Race, IQ, and the search for statistical signals associated with so-called "X"-factors: environments, racism, and the "hereditarian hypothesis"". Biology & Philosophy. 30 (1): 1–17. doi:10.1007/s10539-014-9428-0. ISSN 0169-3867.
- Mackintosh N (2011). IQ and Human Intelligence. OUP Oxford. pp. 362–363. ISBN 978-0199585595.
- Hunt, Earl B. (2010). Human Intelligence. Cambridge University Press. p. 389. ISBN 978-1139495110.
- Plotnik R, Kouyoumdjian H (2013). Introduction to Psychology. Cengage Learning. pp. 282–283. ISBN 978-1133939535.
- Hunt, Earl B. (2010). Human Intelligence. Cambridge University Press. pp. 378–379. ISBN 978-1139495110.
- Mackintosh N (2011). IQ and Human Intelligence. OUP Oxford. pp. 362–363. ISBN 978-0199585595.
- Hunt, Earl B. (2010). Human Intelligence. Cambridge University Press. p. 389. ISBN 978-1139495110.
- Terry WS (2015). Learning and Memory: Basic Principles, Processes, and Procedures, Fourth Edition. Psychology Press. p. 356. ISBN 978-1317350873.
- Plotnik R, Kouyoumdjian H (2013). Introduction to Psychology. Cengage Learning. pp. 282–283. ISBN 978-1133939535.
- Mackintosh N (2011). IQ and Human Intelligence. OUP Oxford. pp. 362–363. ISBN 978-0199585595.
- Chrisler JC, McCreary DR (2010). Handbook of Gender Research in Psychology: Volume 1: Gender Research in General and Experimental Psychology. Springer Science & Business Media. p. 302. ISBN 978-1441914651.
- Hyde, J. S.; Linn, M. C. (27 October 2006). "DIVERSITY: Enhanced: Gender Similarities in Mathematics and Science". Science. 314 (5799): 599–600. doi:10.1126/science.1132154. PMID 17068246.
- Hyde, Janet S.; Fennema, Elizabeth; Lamon, Susan J. (1990). "Gender differences in mathematics performance: A meta-analysis". Psychological Bulletin. 107 (2): 139–155. doi:10.1037/0033-2909.107.2.139. PMID 2138794.
- Nisbett, Richard E.; Aronson, Joshua; Blair, Clancy; Dickens, William; Flynn, James; Halpern, Diane F.; Turkheimer, Eric (2012). "Intelligence: New findings and theoretical developments". American Psychologist. 67 (2): 130–159. doi:10.1037/a0026699. PMID 22233090.
- Jensen, A. (1998) The g Factor: The Science of Mental Ability (p. 531)
- Templeton, A. (2016). EVOLUTION AND NOTIONS OF HUMAN RACE. In Losos J. & Lenski R. (Eds.), How Evolution Shapes Our Lives: Essays on Biology and Society (pp. 346-361). Princeton; Oxford: Princeton University Press. doi:10.2307/j.ctv7h0s6j.26. That this view reflects the consenus among American anthropologists is stated in: Wagner, Jennifer K.; Yu, Joon-Ho; Ifekwunigwe, Jayne O.; Harrell, Tanya M.; Bamshad, Michael J.; Royal, Charmaine D. (February 2017). "Anthropologists' views on race, ancestry, and genetics". American Journal of Physical Anthropology. 162 (2): 318–327. doi:10.1002/ajpa.23120. PMC 5299519. PMID 27874171. See also: American Association of Physical Anthropologists (27 March 2019). "AAPA Statement on Race and Racism". American Association of Physical Anthropologists. Retrieved 19 June 2020.
- Hunt, Earl (2010). Human Intelligence. Cambridge University Press. p. 447. ISBN 978-0-521-70781-7.
- Dickens, William T.; Flynn, James R. (2006). "Black Americans Reduce the Racial IQ Gap: Evidence from Standardization Samples" (PDF). Psychological Science. 17 (10): 913–920.
- Kaufman, Alan S. (2009). IQ Testing 101. New York: Springer Publishing. p. 173. ISBN 978-0-8261-0629-2. Lay summary (10 August 2010).
- Brody, Nathan (2005). "To g or Not to g—That Is the Question". In Wilhelm, Oliver; Engle, Randall W. (eds.). Handbook of Understanding and Measuring Intelligence. Thousand Oaks (CA): SAGE Publications.
- Bernie Devlin; Stephen E. Fienberg; Daniel P. Resnick; Kathryn Roeder, eds. (1997). Intelligence, Genes, and Success: Scientists Respond to the Bell Curve. New York (NY): Springer Verlag. ISBN 978-0-387-98234-2.
- Nisbett, Richard E.; Aronson, Joshua; Blair, Clancy; Dickens, William; Flynn, James; Halpern, Diane F.; Turkheimer, Eric (2012). "Group differences in IQ are best understood as environmental in origin" (PDF). American Psychologist. 67 (6): 503–504. doi:10.1037/a0029772. ISSN 0003-066X. PMID 22963427. Retrieved 22 July 2013. Lay summary (22 July 2013).CS1 maint: ref=harv (link)
- Mitchell, Kevin (2 May 2018). "Why genetic IQ differences between 'races' are unlikely: The idea that intelligence can differ between populations has made headlines again, but the rules of evolution make it implausible". The Guardian. Retrieved 13 June 2020.
- Mackintosh 2011, p. 348.
- Inzlicht, Michael (2011). Stereotype Threat: Theory, Process, and Application. Oxford University Press. pp. 5, 141–143. ISBN 978-0199732449.
- Shuttleworth-Edwards, Ann B.; Van der Merwe, Adele S. (2002). "WAIS-III and WISC-IV South African Cross-Cultural Normative Data Stratified for Quality of Education". In Ferraro, F. Richard (ed.). Minority and cross-cultural aspects of neuropsychological assessment. Exton, PA: Swets & Zeitlinger. pp. 72–75. ISBN 9026518307.
- Barbara P. Uzzell, Marcel Ponton, Alfredo Ardila International Handbook of Cross-Cultural Neuropsychology book ISBN 978-0805835854 (2013)
- Kavanagh, Jennifer (2005). Determinants of Productivity for Military Personnel (PDF) (Report). Santa Monica, CA: RAND Corporation. ISBN 0-8330-3754-4. Retrieved 2017-07-01.
- Kilburn, M. Rebecca; Hanser, Lawrence M.; Klerman, Jacob A. (2009). Estimating AFQT Scores for National Educational Longitudinal Study (NELS) Respondents (PDF) (Report). Santa Monica, CA: RAND Corporation. Retrieved 2017-07-01.
- "12.00-Mental Disorders-Adult". www.ssa.gov. U. S. Social Security Administration. Retrieved 2017-07-01.
- Flynn, James R. (2009). What Is Intelligence: Beyond the Flynn Effect (expanded paperback ed.). Cambridge: Cambridge University Press. ISBN 978-0-521-74147-7. Lay summary (18 July 2010).CS1 maint: ref=harv (link)
- Solomon, Deborah (12 December 2004). "The Science of Second-Guessing". The New York Times.
- Kaufman, Alan S.; Lichtenberger, Elizabeth (2006). Assessing Adolescent and Adult Intelligence (3rd ed.). Hoboken (NJ): John Wiley & Sons. ISBN 978-0-471-73553-3. Lay summary (22 August 2010).
Bibliography
- Aiken, Lewis (1979). Psychological Testing and Assessment (Third ed.). Boston: Allyn and Bacon. ISBN 978-0-205-06613-1.CS1 maint: ref=harv (link)
- Aiken, Lewis R. (31 May 2004) [Plenum Press 1996]. Assessment of Intellectual Functioning. Perspectives on Individual Differences (second (reprint) ed.). Springer. ISBN 978-0-306-48431-5. LCCN 95026038. OCLC 611331775.CS1 maint: ref=harv (link)
- American Psychiatric Association (2013). Diagnostic and Statistical Manual of Mental Disorders (Fifth ed.). Arlington, VA: American Psychiatric Publishing. ISBN 978-0-89042-555-8. Lay summary (15 July 2013).CS1 maint: ref=harv (link)
- Anastasi, Anne; Urbina, Susana (1997). Psychological Testing (Seventh ed.). Upper Saddle River (NJ): Prentice Hall. ISBN 978-0023030857. Lay summary (28 July 2010).CS1 maint: ref=harv (link)
- Binet, Alfred; Simon, Th. (1916). The development of intelligence in children: The Binet-Simon Scale. Publications of the Training School at Vineland New Jersey Department of Research No. 11. E. S. Kite (Trans.). Baltimore: Williams & Wilkins. Retrieved 18 July 2010.CS1 maint: ref=harv (link)
- Borsboom, Denny (September 2006). "The attack of the psychometricians". Psychometrika. 71 (3): 425–440. doi:10.1007/s11336-006-1447-6. PMC 2779444. PMID 19946599.CS1 maint: ref=harv (link)
- Brody, Nathan (2005). "Chapter 26: To g or Not to g—That Is the Question". In Wilhelm, Oliver; Engle, Randall W. (eds.). Handbook of Understanding and Measuring Intelligence. Thousand Oaks (CA): SAGE Publications. pp. 489–281. ISBN 978-0-7619-2887-4. Lay summary (10 July 2013).CS1 maint: ref=harv (link)
- Campbell, Jonathan M. (2006). "Chapter 3: Mental Retardation/Intellectual Disability". In Campbell, Jonathan M.; Kamphaus, Randy W. (eds.). Psychodiagnostic Assessment of Children: Dimensional and Categorical Approaches. Hoboken (NJ): Wiley. ISBN 978-0-471-21219-5. Lay summary (21 May 2013).CS1 maint: ref=harv (link)
- Carroll, John B. (1998). "Human Cognitive Abilities: A Critique". In McArdle, John J.; Woodcock, Richard W. (eds.). Human Cognitive Abilities in Theory and Practice. Mahwah (NJ): Lawrence Erlbaum Associates. pp. 5–23. ISBN 978-0-8058-2717-0.CS1 maint: ref=harv (link)
- Cox, Catherine M. (1926). The Early Mental Traits of 300 Geniuses. Genetic Studies of Genius Volume 2. Stanford (CA): Stanford University Press. Lay summary (2 June 2013).CS1 maint: ref=harv (link)
- Deary, Ian (2001). Intelligence: A Very Short Introduction. Oxford: Oxford University Press. ISBN 978-0-19-289321-5. Lay summary (22 August 2010).CS1 maint: ref=harv (link)
- Deary, Ian J.; Batty, G. David (2007). "Cognitive epidemiology". Journal of Epidemiology and Community Health. 61 (5): 378–384. doi:10.1136/jech.2005.039206. PMC 2465694. PMID 17435201.CS1 maint: ref=harv (link)
- Dumont, Ron; Willis, John O.; Elliot, Colin D. (2009). Essentials of DAS-II® Assessment. Hoboken, NJ: Wiley. p. 126. ISBN 978-0470-22520-2.CS1 maint: ref=harv (link)
- Dumont, Ron; Willis, John O. (2013). "Range of DAS Subtest Scaled Scores". Dumont Willis. Archived from the original on 7 April 2014.CS1 maint: ref=harv (link)
- Eysenck, Hans (1995). Genius: The Natural History of Creativity. Problems in the Behavioural Sciences No. 12. Cambridge: Cambridge University Press. ISBN 978-0-5-2148508-1. Lay summary (31 May 2013).CS1 maint: ref=harv (link)
- Eysenck, Hans (1998). Intelligence: A New Look. New Brunswick (NJ): Transaction Publishers. ISBN 978-0-7658-0707-6.CS1 maint: ref=harv (link)
- Carroll, John B. (1993). Human cognitive abilities: A survey of factor-analytic studies (PDF). New York: Cambridge University Press. ISBN 978-0-521-38275-5. Retrieved 15 May 2014.CS1 maint: ref=harv (link)
- Flanagan, Dawn P.; Harrison, Patti L., eds. (2012). Contemporary Intellectual Assessment: Theories, tests, and issues (Third ed.). New York (NY): Guilford Press. ISBN 978-1-60918-995-2. Lay summary (28 April 2013).CS1 maint: ref=harv (link)
- Flanagan, Dawn P.; Kaufman, Alan S. (2009). Essentials of WISC-IV Assessment. Essentials of Psychological Assessment (2nd ed.). Hoboken (NJ): Wiley. ISBN 978-0470189153. Lay summary (19 May 2013).CS1 maint: ref=harv (link)
- Fletcher, Richard B.; Hattie, John (11 March 2011). Intelligence and Intelligence Testing. Taylor & Francis. ISBN 978-1-136-82321-3. Retrieved 31 August 2013. Lay summary (15 September 2013).CS1 maint: ref=harv (link)
- Flint, Jonathan; Greenspan, Ralph J.; Kendler, Kenneth S. (28 January 2010). How Genes Influence Behavior. Oxford University Press. ISBN 978-0-19-955990-9. Lay summary (20 November 2013).CS1 maint: ref=harv (link)
- Flynn, James R. (2009). What Is Intelligence?: Beyond the Flynn Effect (expanded paperback ed.). Cambridge: Cambridge University Press. ISBN 978-0-521-74147-7. Lay summary (6 October 2014).CS1 maint: ref=harv (link)
- Flynn, James R. (2012). Are We Getting Smarter? Rising IQ in the Twenty-First Century. Cambridge: Cambridge University Press. ISBN 978-1-107-60917-4. Lay summary (16 May 2013).CS1 maint: ref=harv (link)
- Frey, Meredith C.; Detterman, Douglas K. (2004). "Scholastic Assessment org?". Psychological Science. 15 (6): 373–8. doi:10.1111/j.0956-7976.2004.00687.x. PMID 15147489.CS1 maint: ref=harv (link)
- Freides, David (1972). "Review of Stanford-Binet Intelligence Scale, Third Revision". In Oscar Buros (ed.). Seventh Mental Measurements Yearbook. Highland Park (NJ): Gryphon Press. pp. 772–773.CS1 maint: ref=harv (link)
- Georgas, James; Weiss, Lawrence; van de Vijver, Fons; Saklofske, Donald (2003). "Preface". In Georgas, James; Weiss, Lawrence; van de Vijver, Fons; Saklofske, Donald (eds.). Culture and Children's Intelligence: Cross-Cultural Analysis of the WISC-III. San Diego (CA): Academic Press. pp. xvx–xxxii. ISBN 978-0-12-280055-9. Lay summary (26 May 2013).CS1 maint: ref=harv (link)
- Gottfredson, Linda S. (1997). "Mainstream Science on Intelligence (editorial)" (PDF). Intelligence. 24: 13–23. doi:10.1016/s0160-2896(97)90011-8. ISSN 0160-2896.CS1 maint: ref=harv (link)
- Gottfredson, Linda S. (1997). "Why g matters: The complexity of everyday life" (PDF). Intelligence. 24 (1): 79–132. CiteSeerX 10.1.1.535.4596. doi:10.1016/S0160-2896(97)90014-3. ISSN 0160-2896. Retrieved 7 July 2014.CS1 maint: ref=harv (link)
- Gottfredson, Linda S. (1998). "The general intelligence factor" (PDF). Scientific American Presents. 9 (4): 24–29.
- Gottfredson, Linda S. (11 March 2005). "Chapter 9: Suppressing Intelligence Research: Hurting Those We Intend to Help" (PDF). In Wright, Rogers H.; Cummings, Nicholas A. (eds.). Destructive Trends In Mental Health: The Well-Intentioned Path to Harm. Taylor & Francis. pp. 155–186. ISBN 978-0-203-95622-9. Lay summary (7 July 2014).CS1 maint: ref=harv (link)
- Gottfredson, Linda S. (2006). "Chapter 20: Social consequences of group differences in cognitive ability (Conseqüências sociais das diferenças de grupo na capacidade cognitiva)" (PDF). In Flores-Mendoza, Carmen E.; Colom, Roberto (eds.). Introdução à Psicologia das Diferenças Individuais. Porto Alegre, Brazil: ArtMed Publishers. pp. 155–186. ISBN 978-85-363-1418-1.CS1 maint: ref=harv (link)
- Gottfredson, Linda S. (2009). "Chapter 1: Logical Fallacies Used to Dismiss the Evidence on Intelligence Testing". In Phelps, Richard F. (ed.). Correcting Fallacies about Educational and Psychological Testing. Washington (DC): American Psychological Association. ISBN 978-1-4338-0392-5. Lay summary (9 July 2013).CS1 maint: ref=harv (link)
- Gould, Stephen Jay (1996). The Mismeasure of Man (Revised and Expanded ed.). New York (NY): W. W. Norton. ISBN 978-0-393-31425-0. Lay summary (10 July 2010).CS1 maint: ref=harv (link)
- Gregory, Robert J. (1995). "Classification of Intelligence". In Sternberg, Robert J. (ed.). Encyclopedia of human intelligence. 1. Macmillan. pp. 260–266. ISBN 978-0-02-897407-1. OCLC 29594474.CS1 maint: ref=harv (link)
- Groth-Marnat, Gary (2009). Handbook of Psychological Assessment (Fifth ed.). Hoboken (NJ): Wiley. ISBN 978-0-470-08358-1. Lay summary (11 September 2010).CS1 maint: ref=harv (link)
- Harris, Judith Rich (2009). The Nurture Assumption: Why Children Turn Out the Way They Do (Second Edition, Revised and Updated ed.). Free Press. ISBN 978-1-4391-0165-0. Retrieved 7 July 2014. Lay summary – Scientific American (7 July 2014).CS1 maint: ref=harv (link)
- Hopkins, Kenneth D.; Stanley, Julian C. (1981). Educational and Psychological Measurement and Evaluation (sixth ed.). Engelwood Cliffs (NJ): Prentice Hall. ISBN 978-0-13-236273-3.CS1 maint: ref=harv (link)
- Hunt, Earl (2001). "Multiple Views of Multiple Intelligence". PsycCRITIQUES. 46 (1): 5–7. doi:10.1037/002513.CS1 maint: ref=harv (link)
- Hunt, Earl (2011). Human Intelligence. Cambridge: Cambridge University Press. ISBN 978-0-521-70781-7. Lay summary (28 April 2013).CS1 maint: ref=harv (link)
- Jensen, Arthur (1969). "How Much Can We Boost IQ and Scholastic Achievement?". Environment, Heredity, and Intelligence. Harvard Educational Review Reprint Series. 2. Cambridge (MA): Harvard Educational Review. pp. 1–123. ISBN 978-0916690021. LCCN 71087869. Lay summary (PDF) (27 June 2010).CS1 maint: ref=harv (link)
- Jensen, Arthur R. (1980). Bias in mental testing. New York (NY): Free Press. ISBN 978-0-02-916430-3. Lay summary (19 May 2013).CS1 maint: ref=harv (link)
- Jensen, Arthur R. (1998). The g Factor: The Science of Mental Ability. Human Evolution, Behavior, and Intelligence. Westport (CT): Praeger. ISBN 978-0-275-96103-9. ISSN 1063-2158. Lay summary (18 July 2010).CS1 maint: ref=harv (link)
- Jensen, Arthur R. (10 July 2006). Clocking the Mind: Mental Chronometry and Individual Differences. Elsevier. ISBN 978-0-08-044939-5. Retrieved 7 July 2014. Lay summary (PDF) – Psychology Today (7 July 2014).CS1 maint: ref=harv (link)
- Jensen, Arthur R. (2011). "The Theory of Intelligence and Its Measurement". Intelligence. 39 (4): 171–177. doi:10.1016/j.intell.2011.03.004. ISSN 0160-2896.CS1 maint: ref=harv (link)
- Johnson, Wendy (2012). "How Much Can We Boost IQ? An Updated Look at Jensen's (1969) Question and Answer". In Slater, Alan M.; Quinn, Paul C. (eds.). Developmental Psychology: Revisiting the Classic Studies. Psychology: Revisiting the Classic Studies. Thousand Oaks (CA): SAGE. ISBN 978-0-85702-757-3. Lay summary (19 May 2013).CS1 maint: ref=harv (link)
- Johnson, Wendy; Turkheimer, E.; Gottesman, Irving; Bouchard, Thomas (2009). "Beyond Heritability: Twin Studies in Behavioral Research" (PDF). Current Directions in Psychological Science. 18 (4): 217–220. doi:10.1111/j.1467-8721.2009.01639.x. PMC 2899491. PMID 20625474. Retrieved 29 June 2010.CS1 maint: ref=harv (link)
- Kaufman, Alan S. (2009). IQ Testing 101. New York: Springer Publishing. ISBN 978-0-8261-0629-2. Lay summary (10 August 2010).CS1 maint: ref=harv (link)
- Kaufman, Alan S.; Lichtenberger, Elizabeth O. (2006). Assessing Adolescent and Adult Intelligence (3rd ed.). Hoboken (NJ): Wiley. ISBN 978-0-471-73553-3. Lay summary (22 August 2010).CS1 maint: ref=harv (link)
- Kaufman, Scott Barry (1 June 2013). Ungifted: Intelligence Redefined. Basic Books. ISBN 978-0-465-02554-1. Retrieved 1 October 2013. Lay summary (1 October 2013).CS1 maint: ref=harv (link)
- Kranzler, John H.; Floyd, Randy G. (1 August 2013). Assessing Intelligence in Children and Adolescents: A Practical Guide. Guilford Press. ISBN 978-1-4625-1121-1. Archived from the original on 16 October 2014. Retrieved 9 June 2014.CS1 maint: ref=harv (link)
- Lahn, Bruce T.; Ebenstein, Lanny (2009). "Let's celebrate human genetic diversity". Nature. 461 (7265): 726–728. Bibcode:2009Natur.461..726L. doi:10.1038/461726a. ISSN 0028-0836. PMID 19812654.CS1 maint: ref=harv (link)
- Lohman, David F.; Foley Nicpon, Megan (2012). "Chapter 12: Ability Testing & Talent Identification" (PDF). In Hunsaker, Scott (ed.). Identification: The Theory and Practice of Identifying Students for Gifted and Talented Education Services. Waco (TX): Prufrock. pp. 287–386. ISBN 978-1-931280-17-4. Lay summary (14 July 2013).CS1 maint: ref=harv (link)
- Mackintosh, N. J. (2011). IQ and Human Intelligence (second ed.). Oxford: Oxford University Press. ISBN 978-0-19-958559-5.CS1 maint: ref=harv (link)
- Matarazzo, Joseph D. (1972). Wechsler's Measurement and Appraisal of Adult Intelligence (fifth and enlarged ed.). Baltimore (MD): Williams & Witkins. Lay summary (PDF) (4 June 2013).CS1 maint: ref=harv (link)
- McIntosh, David E.; Dixon, Felicia A.; Pierson, Eric E. (2012). "Chapter 25: Use of Intelligence Tests in the Identification of Giftedness". In Flanagan, Dawn P.; Harrison, Patti L. (eds.). Contemporary Intellectual Assessment: Theories, tests, and issues (Third ed.). New York (NY): Guilford Press. pp. 623–642. ISBN 978-1-60918-995-2. Lay summary (28 April 2013).CS1 maint: ref=harv (link)
- Murray, Charles (1998). Income Inequality and IQ. Washington (DC): AEI Press. ISBN 978-0844770949. Retrieved 7 July 2014. Lay summary – New Republic (book review) (7 July 2014).CS1 maint: ref=harv (link)
- Naglieri, Jack A. (1999). Essentials of CAS Assessment. Essentials of Psychological Assessment. Hoboken (NJ): Wiley. ISBN 978-0-471-29015-5. Lay summary (26 May 2013).CS1 maint: ref=harv (link)
- Neisser, Ulrich; Boodoo, Gwyneth; Bouchard, Thomas J.; Boykin, A. Wade; Brody, Nathan; Ceci, Stephen J.; Halpern, Diane F.; Loehlin, John C.; Perloff, Robert; Sternberg, Robert J.; Urbina, Susana (1996). "Intelligence: Knowns and unknowns" (PDF). American Psychologist. 51 (2): 77–101. doi:10.1037/0003-066x.51.2.77. ISSN 0003-066X. Retrieved 9 October 2014.CS1 maint: ref=harv (link)
- Noguera, Pedro A. (30 September 2001). "Racial politics and the elusive quest for excellence and equity in education". In Motion Magazine. Article # ER010930002. Retrieved 7 July 2014.CS1 maint: ref=harv (link)
- Perleth, Christoph; Schatz, Tanja; Mönks, Franz J. (2000). "Early Identification of High Ability". In Heller, Kurt A.; Mönks, Franz J.; Sternberg, Robert J.; et al. (eds.). International Handbook of Giftedness and Talent (2nd ed.). Amsterdam: Pergamon. pp. 297–316. ISBN 978-0-08-043796-5.
a gifted sample gathered using IQ > 132 using the old SB L-M in 1985 does not contain the top 2% of the population but the best10%.
CS1 maint: ref=harv (link) - Plomin, Robert; DeFries, John C.; Knopik, Valerie S.; Neiderhiser, Jenae M. (24 September 2012). Behavioral Genetics. Shaun Purcell (Appendix: Statistical Methods in Behaviorial Genetics). Worth Publishers. ISBN 978-1-4292-4215-8. Retrieved 4 September 2013. Lay summary (4 September 2013).CS1 maint: ref=harv (link)
- Shurkin, Joel (1992). Terman's Kids: The Groundbreaking Study of How the Gifted Grow Up. Boston (MA): Little, Brown. ISBN 978-0-316-78890-8. Lay summary (2 June 2013).CS1 maint: ref=harv (link)
- Stern, William (1914) [1912 (Leipzig: J. A. Barth, original German edition)]. Die psychologischen Methoden der Intelligenzprüfung: und deren Anwendung an Schulkindern [The Psychological Methods of Testing Intelligence]. Educational psychology monographs, no. 13. Guy Montrose Whipple (English translation). Baltimore: Warwick & York. LCCN 14010447. OCLC 4521857. Retrieved 15 June 2014.CS1 maint: ref=harv (link)
- Terman, Lewis M. (1916). The Measurement of Intelligence: An Explanation of and a Complete Guide to the Use of the Stanford Revision and Extension of the Binet-Simon Intelligence Scale. Riverside Textbooks in Education. Ellwood P. Cubberley (Editor's Introduction). Boston: Houghton Mifflin. Retrieved 26 June 2010.CS1 maint: ref=harv (link)
- Terman, Lewis M.; Merrill, Maude (1937). Measuring Intelligence: A Guide to the Administration of the New Revised Stanford-Binet Tests of Intelligence. Boston: Houghton Mifflin.CS1 maint: ref=harv (link)
- Terman, Lewis Madison; Merrill, Maude A. (1960). Stanford-Binet Intelligence Scale: Manual for the Third Revision Form L-M with Revised IQ Tables by Samuel R. Pinneau. Boston (MA): Houghton Mifflin.CS1 maint: ref=harv (link)
- Turkheimer, Eric (April 2008). "A Better Way to Use Twins for Developmental Research" (PDF). LIFE Newsletter. 2 (1): 2–5. Retrieved 29 October 2010.CS1 maint: ref=harv (link)
- Urbina, Susana (2011). "Chapter 2: Tests of Intelligence". In Sternberg, Robert J.; Kaufman, Scott Barry (eds.). The Cambridge Handbook of Intelligence. Cambridge: Cambridge University Press. pp. 20–38. ISBN 9780521739115. Lay summary (9 February 2012).CS1 maint: ref=harv (link)
- Wasserman, John D. (2012). "Chapter 1: A History of Intelligence Assessment: The Unfinished Tapestry". In Flanagan, Dawn P.; Harrison, Patti L. (eds.). Contemporary Intellectual Assessment: Theories, tests, and issues (Third ed.). New York (NY): Guilford Press. pp. 3–55. ISBN 978-1-60918-995-2. Lay summary (29 March 2014).CS1 maint: ref=harv (link)
- Wechsler, David (1939). The Measurement of Adult Intelligence (first ed.). Baltimore (MD): Williams & Witkins. LCCN 39014016. Lay summary – American Psychological Association (29 September 2014).CS1 maint: ref=harv (link)
- Wechsler, David (1997). Wechsler Adult Intelligence Scale (3rd ed.). San Antoni0 (TX): The Psychological Corporation.CS1 maint: location (link) CS1 maint: ref=harv (link)
- Wechsler, David (2003). Wechsler Intelligence Scale for Children (4th ed.). San Antonio (TX): The Psychological Corporation.CS1 maint: ref=harv (link)
- Weiner, Irving B.; Graham, John R.; Naglieri, Jack A., eds. (2 October 2012). Handbook of Psychology. Volume 10: Assessment Psychology. John Wiley & Sons. ISBN 978-0-470-89127-8. Retrieved 25 November 2013.CS1 maint: ref=harv (link)
- Weiss, Lawrence G.; Saklofske, Donald H.; Prifitera, Aurelio; Holdnack, James A., eds. (2006). WISC-IV Advanced Clinical Interpretation. Practical Resources for the Mental Health Professional. Burlington (MA): Academic Press. ISBN 978-0-12-088763-7. Lay summary (15 August 2010).CS1 maint: ref=harv (link) This practitioner's handbook includes chapters by L.G. Weiss, J.G. Harris, A. Prifitera, T. Courville, E. Rolfhus, D.H. Saklofske, J.A. Holdnack, D. Coalson, S.E. Raiford, D.M. Schwartz, P. Entwistle, V. L. Schwean, and T. Oakland.
External links
| Library resources about Intelligence quotient |
| Wikiquote has quotations related to: Intelligence quotient |
| Look up IQer or IQed in Wiktionary, the free dictionary. |
- Classics in the History of Psychology
- Human Intelligence: biographical profiles, current controversies, resources for teachers
| Types | |
|---|---|
| |
| Models and theories | |
| Areas of research | |