ICC ODI Championship
The ICC ODI Championship is an international One Day International (ODI) cricket competition run by the International Cricket Council (ICC). The competition is notional in that it is simply a ranking scheme overlaid on the regular ODI match schedule. After every ODI match, the two teams involved receive points based on a mathematical formula. Each team's points total is divided by their total number of matches played to give a rating, and all the teams are ranked in a table in order of rating.[1]
| Administrator | International Cricket Council |
|---|---|
| Format | One Day International |
| First edition | 2002 |
| Latest edition | Ongoing |
| Tournament format | Notional (ongoing points accumulation through all matches played) |
| Number of teams | 20 |
| Current champion | |
| Most successful | |
| Longest continuous champion | |
| Highest rating |
By analogy to cricket batting averages, the points for winning an ODI match are always greater than the team's rating, increasing the rating, and the points for losing an ODI match are always less than the rating, reducing the rating. A drawn match between higher and lower rated teams will benefit the lower-rated team at the expense of the higher-rated team. An "average" team that wins as often as it loses while playing a mix of stronger and weaker teams should have a rating of 100.[2]
As of 1 May 2020, England lead the ICC ODI Championship with a rating of 127 from 38 weighted matches, while the lowest rated team, Papua New Guinea, has a rating of 0 from 14 weighted matches.[3]
Current
| ICC ODI Rankings | ||||
|---|---|---|---|---|
| Rank | Team | Matches | Points | Rating |
| 1 | 38 | 4,820 | 127 | |
| 2 | 49 | 5,819 | 119 | |
| 3 | 32 | 3,716 | 116 | |
| 4 | 31 | 3,385 | 108 | |
| 5 | 33 | 3,518 | 107 | |
| 6 | 32 | 3,254 | 102 | |
| 7 | 34 | 2,989 | 88 | |
| 8 | 39 | 3,297 | 85 | |
| 9 | 43 | 3,285 | 76 | |
| 10 | 28 | 1,549 | 55 | |
| 11 | 21 | 1,039 | 49 | |
| 12 | 5 | 222 | 44 | |
| 13 | 12 | 479 | 40 | |
| 14 | 24 | 935 | 39 | |
| 15 | 16 | 419 | 26 | |
| 16 | 9 | 161 | 18 | |
| 17 | 15 | 259 | 17 | |
| 18 | 9 | 152 | 17 | |
| 19 | 14 | 185 | 13 | |
| 20 | 14 | 0 | 0 | |
| Reference: Cricinfo Rankings page,ICC ODI rankings 1 May 2020 | ||||
| Matches is the number of matches played in the 12-24 months since the May before last, plus half the number in the 24 months before that. See points calculations for more details. | ||||
Associate rankings
In late 2005, the International Cricket Council ranked the top non-Test nations from 11–30 to complement the Test nations' rankings in the ICC ODI Championship. The ICC used the results from the 2005 ICC Trophy and WCQS Division 2 competition (i.e. the primary qualification mechanisms for the 2007 Cricket World Cup) to rank the nations.
These rankings were used to seed the initial stage of the global World Cricket League. Teams ranked 11–16 were placed into Division 1; teams 17–20 were placed into Division 2; teams 21–24 were placed into Division 3; the remaining teams were placed into the upper divisions of their respective regional qualifiers.
As of 19 April 2009 the top six associates gained one day status. Kenya and Ireland have both qualified to appear on the main rating table, Kenya from its existing status and Ireland for its two victories in the 2007 World Cup. Following their victory over Bangladesh in July 2010, the Netherlands joined the main table. Afghanistan, Canada and Scotland remain on the secondary table. In May 2009, the ICC added a rankings table for all associate members. This contained both global and regional placings. In June 2018, the four associates with ODI status were moved to the main ranking list.[4]
Associate rankings according to ICC:
| Rank | Nation | Region | ||
|---|---|---|---|---|
| 21 | Americas | |||
| 22 | Asia | |||
| 23 | Asia | |||
| 24 | Africa | |||
| 25 | Europe | |||
| 26 | Africa | |||
| 27 | Asia | |||
| 28 | Europe | |||
| 29 | EAP | |||
| 30 | Americas | |||
| 31 | Asia | |||
| 32 | Europe | |||
| Reference: Associate Rankings updated to 9 March 2018 | ||||
Historical ICC ODI Champions
The ICC provides ratings for the end of each month back to October 2002. This table lists the teams that have successively held the highest rating since that date, by whole month periods.
| Team | Start | End | Total Months | Cumulative Months | Highest Rating |
|---|---|---|---|---|---|
| October 2002 | January 2007 | 52 | 52 | 140 | |
| February 2007 | February 2007 | 1 | 1 | 128 | |
| March 2007 | February 2008 | 12 | 64 | 130 | |
| March 2008 | May 2008 | 3 | 4 | 127 | |
| June 2008 | December 2008 | 7 | 71 | 131 | |
| January 2009 | August 2009 | 8 | 12 | 127 | |
| September 2009 | August 2012 | 35 | 106 | 134 | |
| August 2012 | December 2012 | 5 | 5 | 121 | |
| January 2013 | January 2014 | 12 | 12 | 124 | |
| January 2014 | August 2014 | 8 | 114 | 117 | |
| September 2014 | September 2014 | 1 | 13 | 113 | |
| October 2014 | October 2014 | 1 | 115 | 114 | |
| October 2014[5] | November 2014 | ½ | 13 | 115 | |
| November 2014 | November 2014 | ½ | 14 | 117 | |
| November 2014 | February 2017 | 26 | 141 | 129 | |
| February 2017 | February 2017 | 1 | 14 | 119 | |
| March 2017 | March 2017 | 4 days | 141 | 118 | |
| March 2017 | September 2017 | 6 | 20 | 123 | |
| 24 September 2017 | 27 September 2017 | 4 days | 14 | 120 | |
| 28 September 2017 | 31 September 2017 | 4 days | 20 | 119 | |
| 1 October 2017 | 17 October 2017 | 17 days | 15 | 120 | |
| 18 October 2017 | 1 February 2018 | 4 | 24 | 120 | |
| 2 February 2018 | 1 May 2018 | 3 | 18 | 123 | |
| 2 May 2018 | 24 June 2019 | 14 | 19 | 127 | |
| 25 June 2019 | 29 June 2019 | 5 days | 18 | 123 | |
| 30 June 2019 | present | 10 | 29 | 127 |
In 2011, the ICC applied its rating system to results since 1981, providing ratings for the end of each month back to 1981, further indicating Australia's historical dominance in ODI Cricket with the highest number of months ranked first (198 months). The table only begins from 1981 as, prior to this date, there is not enough data available due to the infrequency of matches and the small number of competing teams in the earlier periods.
The teams that have successively held the highest rating since January 1981 till September 2002, by whole month periods, are:
| Team | Start | End | Total Months | Cumulative Months |
|---|---|---|---|---|
| January 1981 | February 1981 | 2 | 2 | |
| June 1981 | November 1981 | 6 | 6 | |
| December 1981 | December 1981 | 1 | 3 | |
| January 1982 | May 1987 | 65 | 71 | |
| August 1987 | March 1988 | 8 | 11 | |
| April 1988 | May 1988 | 2 | 73 | |
| August 1988 | May 1989 | 10 | 21 | |
| August 1989 | December 1989 | 5 | 78 | |
| January 1990 | March 1990 | 3 | 3 | |
| April 1990 | April 1990 | 1 | 79 | |
| May 1990 | May 1990 | 1 | 4 | |
| July 1990 | July 1990 | 1 | 80 | |
| August 1990 | November 1990 | 4 | 8 | |
| December 1990 | January 1991 | 2 | 2 | |
| February 1991 | May 1991 | 4 | 12 | |
| August 1991 | August 1991 | 1 | 3 | |
| October 1991 | May 1992 | 8 | 20 | |
| August 1992 | March 1993 | 8 | 29 | |
| April 1993 | April 1993 | 1 | 81 | |
| May 1993 | July 1993 | 3 | 23 | |
| August 1993 | November 1994 | 16 | 97 | |
| December 1994 | March 1995 | 4 | 4 | |
| April 1995 | May 1995 | 2 | 99 | |
| August 1995 | October 1995 | 3 | 7 | |
| November 1995 | December 1995 | 2 | 31 | |
| January 1996 | April 1996 | 4 | 27 | |
| May 1996 | February 2000 | 46 | 46 | |
| March 2000 | January 2002 | 23 | 50 | |
| February 2002 | February 2002 | 1 | 47 | |
| March 2002 | September 2002 | 7 | 57 | |
| Reference: Historical Rankings | ||||
The summary of teams that have held the highest rating since 1981 till present by whole month periods, are:
| Team | Total Months | Highest Rating | ||
|---|---|---|---|---|
| 198 | 140 | |||
| 99 | 141 | |||
| 71 | 134 | |||
| 60 | 135 | |||
| 25 | 127 | |||
| 3 | 131 | |||
| Reference: Historical Rankings updated to 2/03/2019 | ||||
Trophy
The team at the top of the ICC ODI Championship has been awarded the ICC ODI Championship shield. Like a 2 euro coin, the shield features an inner circle of gold-coloured metal and is surrounded by a ring of silver-coloured metal. It was first presented in December 2002, when Australia's captain Ricky Ponting received the trophy.[6]
Points calculations
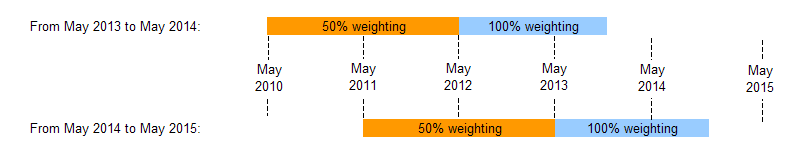
Each team scores points based on the results of their matches over the last 3–4 years − all matches played in the 12–24 months since the May before last, plus all the matches played in the 24 months before that, for which the matches played and points earned both count half.[7] Each May, the matches and points earned between 3 and 4 years ago are removed, and the matches and points earned between 1 and 2 years ago switch from 100% weighting to 50% weighting. For example, at May 2014, the matches played between May 2010 and May 2011 were removed, and the matches played between May 2012 and May 2013 switched to 50% weighting. This happens overnight, so can result in teams changing positions in the ranking table despite not playing.
Each time two teams play another match, the rankings table is updated as follows, based on the ratings of the teams immediately before they played. To determine the teams' new ratings after a particular match, first calculate the points earned from the match:
If the gap between the ratings of the two teams before the match was less than 40 points, then:
| Match result | Points earned |
|---|---|
| Win | Opponent's rating + 50 |
| Tie | Opponent's rating |
| Lose | Opponent's rating − 50 |
If the gap between the ratings of the two teams before the match was at least 40 points, then:
| Match result | Points earned |
|---|---|
| Stronger team wins | Own rating + 10 |
| Weaker team loses | Own rating − 10 |
| Stronger team ties | Own rating − 40 |
| Weaker team ties | Own rating + 40 |
| Stronger team loses | Own rating − 90 |
| Weaker team wins | Own rating + 90 |
- Each team's rating is equal to its total points scored divided by the total matches played. (Series are not significant in these calculations).
- Add the match points scored to the points already scored (in previous matches as reflected by the Table), add one to the number of matches played, and determine the new rating.[2]
- Points earned by teams depend on the opponent's ratings, therefore this system needed to assign base ratings to teams when it started.
See also: Detailed example
See also
References
- http://icc-live.s3.amazonaws.com/cms/media/about_docs/536b1a48c16e5-Reliance%20ICC%20ODI%20Team%20Rankings%20FAQs%202014.pdf
- "Reliance ICC One-Day International Team Rankings -frequently asked questions" (PDF). ESPNcricinfo. ICC. Retrieved 6 January 2015.
- "ICC ODI Rankings – Cricket ODI Ranking – ICC Cricket". icc-cricket.com.
- "Four new teams in the ICC's ODI rankings". ESPNcricinfo. Retrieved 2018-06-02.
- "South Africa reclaims number-one ODI ranking after five years". International Cricket Council. 28 October 2014. Archived from the original on 24 September 2015. Retrieved 30 August 2015.
- "Australia increases lead in ODI standings". Cricinfo.
- "FAQs on ICC ODI Team Rankings". Qn4,5, ICC. Retrieved 2016-02-17.
External links
| Forms | _2017.svg.png) | |
|---|---|---|
| Global events | ||
| Asia | ||
| Africa | ||
| Americas | ||
| East Asia and Pacific | ||
| Europe | ||