HITRAN
HITRAN (an acronym for High Resolution Transmission) molecular spectroscopic database is a compilation of spectroscopic parameters used to simulate and analyze the transmission and emission of light in gaseous media, with an emphasis on planetary atmospheres. The knowledge of spectroscopic parameters for transitions between energy levels in molecules (and atoms) is essential for interpreting and modeling the interaction of radiation (light) with different media.
For half a century, HITRAN has been considered to be an international standard which provides the user a recommended value of parameters for millions of transitions for different molecules. HITRAN includes both experimental and theoretical data which are gathered from articles, books, proceedings, databases, theses, reports, presentations, unpublished data, papers in-preparation and private communications. The original version of HITRAN was compiled by the Air Force Cambridge Research Laboratories (1960s), and then first made publicly available in 1973.[1] HITRAN is a free resource and is currently maintained and developed at the Harvard-Smithsonian Center for Astrophysics, Cambridge MA, USA.
HITRAN is the worldwide standard for calculating or simulating atmospheric molecular transmission and radiance from the microwave through ultraviolet region of the spectrum.[2] The current version, HITRAN2016,[3] contains 49 molecules in the line-by-line portion of HITRAN and, with their respective isotopologues, totals 126 isotopologues in this section of the database.[3] These data are archived as a multitude of high-resolution line transitions, each containing many spectral parameters required for high-resolution simulations.
In addition to the traditional the line-by-line spectroscopic absorption parameters, the HITRAN database contains information on absorption cross-sections where the line-by-line parameters are absent or incomplete. Typically HITRAN includes absorption cross-sections for heavy polyatomic molecules (with low-lying vibrational modes) which are difficult for detailed analysis due to the high density of the spectral bands/lines, broadening effects, isomerization, and overall modeling complexity.[3] There are 327 molecular species provided as cross-section files. The cross-section files are provided in the HITRAN format described on the official HITRAN website (http://hitran.org/docs/cross-sections-definitions/).
A Python library HAPI (HITRAN Application Programming Interface) has been developed which serves as a tool for absorption and transmission calculations as well as comparisons of spectroscopic data sets. HAPI extends the functionality of the main site, in particular, for the calculation of spectra using several types of line shape calculations, including the flexible HT (Hartmann-Tran) profile. This HT line shape can also be reduced to a number of conventional line profiles such as Gaussian (Doppler), Lorentzian, Voigt, Rautian, Speed-dependent Voigt and speed-dependent Rautian. In addition to accounting for pressure, temperature and optical path length, the user can include a number of instrumental functions to simulate experimental spectra. HAPI is able to account for broadening of lines due to mixtures of gases, making use of all broadening parameters supplied by HITRAN. This includes the traditional broadeners (air, self) as well as additional parameters for CO2, H2O, H2 and He broadening.[4] The following spectral functions can be calculated in the current version one of HAPI:[5]
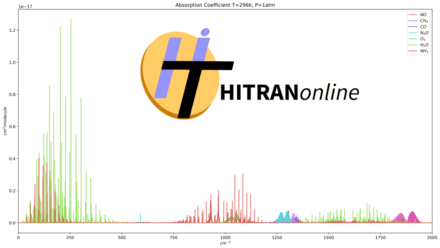
- absorption coefficient
- absorption spectrum
- transmittance spectrum
- radiance spectrum[5]
The HITRAN compilation also provides collision-induced absorption (CIA)[6] that was first introduced into HITRAN in the 2012 edition.[7] CIA refers to absorption by transient electric dipoles induced by the interaction between colliding molecules. Instructions for accessing the CIA data files can be found on [www.hitran.org/cia]. HITRAN2016 also has an aerosols refractive indices section, with data in the visible, infrared, and millimeter spectral ranges of many types of cloud and aerosol particles. This is necessary because knowledge of the refractive indices of the aerosols and cloud particles and their size distributions is necessary in order to specify their optical properties.[8]
HITEMP is the molecular spectroscopic database analogous to HITRAN for high-temperature modeling of the spectra of molecules in the gas phase.[9] HITEMP encompasses many more bands and transitions than HITRAN for the absorbers H2O, CO2, CO, NO, NO2, N2O, CH4 and OH.[10][11]
See also
- Atmospheric radiative--transfer codes
- Absorption spectrum
- MODTRAN
References
- R. A. McClatchey, W. S. Benedict, S. A. Clough, et al, "AFCRL Atmospheric Absorption Line Parameters Compilation", AFCRL-TR-73-0096, Environmental Research Papers, No. 434, Optical Physics Laboratory, Air Force Cambridge Research Laboratories (1973).
- https://hitran.org/
- Gordon, I.E.; Rothman, L.S.; Hill, C.; Kochanov, R.V.; Tan, Y.; Bernath, P.F.; Birk, M.; Boudon, V.; Campargue, A.; Chance, K.V.; Drouin, B.J.; Flaud, J.-M.; Gamache, R.R.; Hodges, J.T.; Jacquemart, D.; Perevalov, V.I.; Perrin, A.; Shine, K.P.; Smith, M.-A.H.; Tennyson, J.; Toon, G.C.; Tran, H.; Tyuterev, V.G.; Barbe, A.; Császár, A.G.; Devi, V.M.; Furtenbacher, T.; Harrison, J.J.; Hartmann, J.-M.; et al. (2017). "The HITRAN2016 molecular spectroscopic database". Journal of Quantitative Spectroscopy and Radiative Transfer. 203: 3–69. Bibcode:2017JQSRT.203....3G. doi:10.1016/j.jqsrt.2017.06.038.
- Wilzewski, Jonas S.; Gordon, Iouli E.; Kochanov, Roman V.; Hill, Christian; Rothman, Laurence S. (2016). "H2, He, and CO2 line-broadening coefficients, pressure shifts and temperature-dependence exponents for the HITRAN database. Part 1: SO2, NH3, HF, HCL, OCS and C2H2". Journal of Quantitative Spectroscopy and Radiative Transfer. 168: 193–206. Bibcode:2016JQSRT.168..193W. doi:10.1016/j.jqsrt.2015.09.003.
- Kochanov, R.V.; Gordon, I.E.; Rothman, L.S.; Wcisło, P.; Hill, C.; Wilzewski, J.S. (2016). "HITRAN Application Programming Interface (HAPI): A comprehensive approach to working with spectroscopic data". Journal of Quantitative Spectroscopy and Radiative Transfer. 177: 15–30. Bibcode:2016JQSRT.177...15K. doi:10.1016/j.jqsrt.2016.03.005.
- Karman, Tijs; Gordon, Iouli E.; Van Der Avoird, Ad; Baranov, Yury I.; Boulet, Christian; Drouin, Brian J.; Groenenboom, Gerrit C.; Gustafsson, Magnus; Hartmann, Jean-Michel; Kurucz, Robert L.; Rothman, Laurence S.; Sun, Kang; Sung, Keeyoon; Thalman, Ryan; Tran, Ha; Wishnow, Edward H.; Wordsworth, Robin; Vigasin, Andrey A.; Volkamer, Rainer; Van Der Zande, Wim J. (2019). "Update of the HITRAN collision-induced absorption section". Icarus. 328: 160–175. Bibcode:2019Icar..328..160K. doi:10.1016/J.ICARUS.2019.02.034.
- Richard, C.; Gordon, I.E.; Rothman, L.S.; Abel, M.; Frommhold, L.; Gustafsson, M.; Hartmann, J.-M.; Hermans, C.; Lafferty, W.J.; Orton, G.S.; Smith, K.M.; Tran, H. (2012). "New section of the HITRAN database: Collision-induced absorption (CIA)". Journal of Quantitative Spectroscopy and Radiative Transfer. 113 (11): 1276–1285. Bibcode:2012JQSRT.113.1276R. doi:10.1016/j.jqsrt.2011.11.004.
- Rothman, L.S.; Gordon, I.E.; Babikov, Y.; Barbe, A.; Chris Benner, D.; Bernath, P.F.; Birk, M.; Bizzocchi, L.; Boudon, V.; Brown, L.R.; Campargue, A.; Chance, K.; Cohen, E.A.; Coudert, L.H.; Devi, V.M.; Drouin, B.J.; Fayt, A.; Flaud, J.-M.; Gamache, R.R.; Harrison, J.J.; Hartmann, J.-M.; Hill, C.; Hodges, J.T.; Jacquemart, D.; Jolly, A.; Lamouroux, J.; Le Roy, R.J.; Li, G.; Long, D.A.; et al. (2013). "The HITRAN2012 molecular spectroscopic database". Journal of Quantitative Spectroscopy and Radiative Transfer. 130: 4–50. Bibcode:2013JQSRT.130....4R. doi:10.1016/j.jqsrt.2013.07.002.
- Rothman, L.S.; Gordon, I.E.; Barber, R.J.; Dothe, H.; Gamache, R.R.; Goldman, A.; Perevalov, V.I.; Tashkun, S.A.; Tennyson, J. (2010). "HITEMP, the high-temperature molecular spectroscopic database". Journal of Quantitative Spectroscopy and Radiative Transfer. 111 (15): 2139–2150. Bibcode:2010JQSRT.111.2139R. doi:10.1016/j.jqsrt.2010.05.001.
- Hargreaves, Robert J.; Gordon, Iouli E.; Rey, Michael; Nikitin, Andrei V.; Tyuterev, Vladimir G.; Kochanov, Roman V.; Rothman, Laurence S. (2020). "An Accurate, Extensive, and Practical Line List of Methane for the HITEMP Database". The Astrophysical Journal Supplement Series. 247 (2): 55. arXiv:2001.05037. Bibcode:2020ApJS..247...55H. doi:10.3847/1538-4365/ab7a1a.
- Hargreaves, Robert J.; Gordon, Iouli E.; Rothman, Laurence S.; Tashkun, Sergey A.; Perevalov, Valery I.; Lukashevskaya, Anastasiya A.; Yurchenko, Sergey N.; Tennyson, Jonathan; Müller, Holger S.P. (2019). "Spectroscopic line parameters of NO, NO2, and N2O for the HITEMP database". Journal of Quantitative Spectroscopy and Radiative Transfer. 232: 35–53. arXiv:1904.02636. Bibcode:2019JQSRT.232...35H. doi:10.1016/j.jqsrt.2019.04.040.
Further reading
- Gordon, I. E.; et al. (2017). "The HITRAN2016 molecular spectroscopic database". Journal of Quantitative Spectroscopy and Radiative Transfer. 203 (HITRAN-2016 Special Issue): 3–69. Bibcode:2017JQSRT.203....3G. doi:10.1016/j.jqsrt.2017.06.038.
- Kochanov, R. V.; et al. (2016). "HITRAN Application Programming Interface (HAPI): A comprehensive approach to working with spectroscopic data". Journal of Quantitative Spectroscopy and Radiative Transfer. 177: 15–30. Bibcode:2016JQSRT.177...15K. doi:10.1016/j.jqsrt.2016.03.005.
- Rothman, L. S.; et al. (2013). "The HITRAN 2012 Molecular Spectroscopic Database". Journal of Quantitative Spectroscopy and Radiative Transfer. 130: 4–50. Bibcode:2013JQSRT.130....4R. doi:10.1016/j.jqsrt.2013.07.002.
- Rothman, L. S.; et al. (2010). "HITEMP, the high-temperature molecular spectroscopic database". Journal of Quantitative Spectroscopy and Radiative Transfer. 111 (15): 2139–2150. Bibcode:2010JQSRT.111.2139R. doi:10.1016/j.jqsrt.2010.05.001.
- Hargreaves, R. J.; et al. (2020). "An accurate, extensive, and practical line list of methane for the HITEMP database". The Astrophysical Journal Supplement Series. 247 (2): 55. arXiv:2001.05037. Bibcode:2020ApJS..247...55H. doi:10.3847/1538-4365/ab7a1a.
- Hargreaves, R. J.; et al. (2019). "Spectroscopic line parameters of NO, NO2, and N2O for the HITEMP database". Journal of Quantitative Spectroscopy and Radiative Transfer. 232: 35–53. arXiv:1904.02636. Bibcode:2019JQSRT.232...35H. doi:10.1016/j.jqsrt.2019.04.040.
External links
- hitran.org Official HITRANonline website for accessing HITRAN data
- HITRAN on the Web