h-index
The h-index is an author-level metric that attempts to measure both the productivity and citation impact of the publications of a scientist or scholar. The h-index correlates with obvious success indicators such as winning the Nobel Prize, being accepted for research fellowships and holding positions at top universities.[1] The index is based on the set of the scientist's most cited papers and the number of citations that they have received in other publications. The index can also be applied to the productivity and impact of a scholarly journal[2] as well as a group of scientists, such as a department or university or country.[3] The index was suggested in 2005 by Jorge E. Hirsch, a physicist at UC San Diego, as a tool for determining theoretical physicists' relative quality[4] and is sometimes called the Hirsch index or Hirsch number.
Definition and purpose
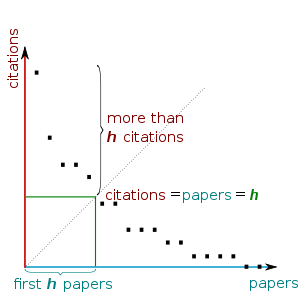
The h-index is defined as the maximum value of h such that the given author/journal has published h papers that have each been cited at least h times.[5] The index is designed to improve upon simpler measures such as the total number of citations or publications. The index works properly only for comparing scientists working in the same field; citation conventions differ widely among different fields.[6]
Calculation
Formally, if f is the function that corresponds to the number of citations for each publication, we compute the h-index as follows: First we order the values of f from the largest to the lowest value. Then, we look for the last position in which f is greater than or equal to the position (we call h this position). For example, if we have a researcher with 5 publications A, B, C, D, and E with 10, 8, 5, 4, and 3 citations, respectively, the h-index is equal to 4 because the 4th publication has 4 citations and the 5th has only 3. In contrast, if the same publications have 25, 8, 5, 3, and 3 citations, then the index is 3 because the fourth paper has only 3 citations.
- f(A)=10, f(B)=8, f(C)=5, f(D)=4, f(E)=3 → h-index=4
- f(A)=25, f(B)=8, f(C)=5, f(D)=3, f(E)=3 → h-index=3
If we have the function f ordered in decreasing order from the largest value to the lowest one, we can compute the h-index as follows:
- h-index (f) =

The Hirsch index is analogous to the Eddington number, an earlier metric used for evaluating cyclists. The h-index serves as an alternative to more traditional journal impact factor metrics in the evaluation of the impact of the work of a particular researcher. Because only the most highly cited articles contribute to the h-index, its determination is a simpler process. Hirsch has demonstrated that h has high predictive value for whether a scientist has won honors like National Academy membership or the Nobel Prize. The h-index grows as citations accumulate and thus it depends on the "academic age" of a researcher.
Input data
The h-index can be manually determined by using citation databases or using automatic tools. Subscription-based databases such as Scopus and the Web of Science provide automated calculators. From July 2011 Google have provided an automatically-calculated h-index and i10-index within their own Google Scholar profile.[7] In addition, specific databases, such as the INSPIRE-HEP database can automatically calculate the h-index for researchers working in high energy physics.
Each database is likely to produce a different h for the same scholar, because of different coverage.[8] A detailed study showed that the Web of Science has strong coverage of journal publications, but poor coverage of high impact conferences. Scopus has better coverage of conferences, but poor coverage of publications prior to 1996; Google Scholar has the best coverage of conferences and most journals (though not all), but like Scopus has limited coverage of pre-1990 publications.[9][10] The exclusion of conference proceedings papers is a particular problem for scholars in computer science, where conference proceedings are considered an important part of the literature.[11] Google Scholar has been criticized for producing "phantom citations," including gray literature in its citation counts, and failing to follow the rules of Boolean logic when combining search terms.[12] For example, the Meho and Yang study found that Google Scholar identified 53% more citations than Web of Science and Scopus combined, but noted that because most of the additional citations reported by Google Scholar were from low-impact journals or conference proceedings, they did not significantly alter the relative ranking of the individuals. It has been suggested that in order to deal with the sometimes wide variation in h for a single academic measured across the possible citation databases, one should assume false negatives in the databases are more problematic than false positives and take the maximum h measured for an academic.[13]
Comparing results across fields and career levels
Little systematic investigation has been done on how the h-index behaves over different institutions, nations, times and academic fields. Hirsch suggested that, for physicists, a value for h of about 12 might be typical for advancement to tenure (associate professor) at major [US] research universities. A value of about 18 could mean a full professorship, 15–20 could mean a fellowship in the American Physical Society, and 45 or higher could mean membership in the United States National Academy of Sciences.[14] Hirsch estimated that after 20 years a "successful scientist" would have an h-index of 20, an "outstanding scientist" would have an h-index of 40, and a "truly unique" individual would have an h-index of 60.[4]
For the most highly cited scientists in the period 1983–2002, Hirsch identified the top 10 in the life sciences (in order of decreasing h): Solomon H. Snyder, h = 191; David Baltimore, h = 160; Robert C. Gallo, h = 154; Pierre Chambon, h = 153; Bert Vogelstein, h = 151; Salvador Moncada, h = 143; Charles A. Dinarello, h = 138; Tadamitsu Kishimoto, h = 134; Ronald M. Evans, h = 127; Axel Ullrich, h = 120; and Ralph L. Brinster, h = 120. Among 36 new inductees in the National Academy of Sciences in biological and biomedical sciences in 2005, the median h-index was 57.[4] However, Hirsch noted that values of h will vary between different fields.[4]
Among the 22 scientific disciplines listed in the Thomson Reuters Essential Science Indicators Citation Thresholds [thus excluding non-science academics], physics has the second most citations after space science.[15] During the period January 1, 2000 – February 28, 2010, a physicist had to receive 2073 citations to be among the most cited 1% of physicists in the world.[15] The threshold for space science is the highest (2236 citations), and physics is followed by clinical medicine (1390) and molecular biology & genetics (1229). Most disciplines, such as environment/ecology (390), have fewer scientists, fewer papers, and fewer citations.[15] Therefore, these disciplines have lower citation thresholds in the Essential Science Indicators, with the lowest citation thresholds observed in social sciences (154), computer science (149), and multidisciplinary sciences (147).[15]
Numbers are very different in social science disciplines: The Impact of the Social Sciences team at London School of Economics found that social scientists in the United Kingdom had lower average h-indices. The h-indices for ("full") professors, based on Google Scholar data ranged from 2.8 (in law), through 3.4 (in political science), 3.7 (in sociology), 6.5 (in geography) and 7.6 (in economics). On average across the disciplines, a professor in the social sciences had an h-index about twice that of a lecturer or a senior lecturer, though the difference was the smallest in geography.[16]
Advantages
Hirsch intended the h-index to address the main disadvantages of other bibliometric indicators, such as total number of papers or total number of citations. Total number of papers does not account for the quality of scientific publications, while total number of citations can be disproportionately affected by participation in a single publication of major influence (for instance, methodological papers proposing successful new techniques, methods or approximations, which can generate a large number of citations), or having many publications with few citations each. The h-index is intended to measure simultaneously the quality and quantity of scientific output.
Criticism
There are a number of situations in which h may provide misleading information about a scientist's output:[17] Most of these however are not exclusive to the h-index.
- The h-index does not account for the typical number of citations in different fields. It has been stated that citation behavior in general is affected by field-dependent factors,[18] which may invalidate comparisons not only across disciplines but even within different fields of research of one discipline.[19]
- The h-index discards the information contained in author placement in the authors' list, which in some scientific fields is significant.[20][21]
- The h-index has been found in one study to have slightly less predictive accuracy and precision than the simpler measure of mean citations per paper.[22] However, this finding was contradicted by another study by Hirsch.[23]
- The h-index is a natural number that reduces its discriminatory power. Ruane and Tol therefore propose a rational h-index that interpolates between h and h + 1.[24]
- The h-index does not provide a significantly more accurate measure of impact than the total number of citations for a given scholar. In particular, by modeling the distribution of citations among papers as a random integer partition and the h-index as the Durfee square of the partition, Yong[25] arrived at the formula , where N is the total number of citations, which, for mathematics members of the National Academy of Sciences, turns out to provide an accurate (with errors typically within 10–20 percent) approximation of h-index in most cases.
- The h-index can be manipulated through self-citations,[26][27][28] and if based on Google Scholar output, then even computer-generated documents can be used for that purpose, e.g. using SCIgen.[29]
- The h-index can be manipulated by coercive citation, a practice in which an editor of a journal forces authors to add spurious citations to their own articles before the journal will agree to publish it.[30][31]

Alternatives and modifications
Various proposals to modify the h-index in order to emphasize different features have been made.[32][33][34][35][36][37] As the variants have proliferated, comparative studies have become possible showing that most proposals are highly correlated with the original h-index and therefore largely redundant,[38] although alternative indexes may be important to decide between comparable CVs, as often the case in evaluation processes.
- An individual h-index normalized by the number of authors has been proposed: , with being the number of authors considered in the papers.[32] It was found that the distribution of the h-index, although it depends on the field, can be normalized by a simple rescaling factor. For example, assuming as standard the hs for biology, the distribution of h for mathematics collapse with it if this h is multiplied by three, that is, a mathematician with h = 3 is equivalent to a biologist with h = 9. This method has not been readily adopted, perhaps because of its complexity. It might be simpler to divide citation counts by the number of authors before ordering the papers and obtaining the h-index, as originally suggested by Hirsch.
- The m-index is defined as h/n, where n is the number of years since the first published paper of the scientist;[4] also called m-quotient.[39][40]
- There are a number of models proposed to incorporate the relative contribution of each author to a paper, for instance by accounting for the rank in the sequence of authors.[41]
- A generalization of the h-index and some other indices that gives additional information about the shape of the author's citation function (heavy-tailed, flat/peaked, etc.) has been proposed.[42]
- Three additional metrics have been proposed: h2 lower, h2 center, and h2 upper, to give a more accurate representation of the distribution shape. The three h2 metrics measure the relative area within a scientist's citation distribution in the low impact area, h2 lower, the area captured by the h-index, h2 center, and the area from publications with the highest visibility, h2 upper. Scientists with high h2 upper percentages are perfectionists, whereas scientists with high h2 lower percentages are mass producers. As these metrics are percentages, they are intended to give a qualitative description to supplement the quantitative h-index.[43]
- The g-index can be seen as the h-index for an averaged citations count.[44]
- It has been argued that "For an individual researcher, a measure such as Erdős number captures the structural properties of network whereas the h-index captures the citation impact of the publications. One can be easily convinced that ranking in coauthorship networks should take into account both measures to generate a realistic and acceptable ranking." Several author ranking systems such as eigenfactor (based on eigenvector centrality) have been proposed already, for instance the Phys Author Rank Algorithm.[45]
- The c-index accounts not only for the citations but for the quality of the citations in terms of the collaboration distance between citing and cited authors. A scientist has c-index n if n of [his/her] N citations are from authors which are at collaboration distance at least n, and the other (N − n) citations are from authors which are at collaboration distance at most n.[46]
- An s-index, accounting for the non-entropic distribution of citations, has been proposed and it has been shown to be in a very good correlation with h.[47]
- The e-index, the square root of surplus citations for the h-set beyond h2, complements the h-index for ignored citations, and therefore is especially useful for highly cited scientists and for comparing those with the same h-index (iso-h-index group).[48][49]
- Because the h-index was never meant to measure future publication success, recently, a group of researchers has investigated the features that are most predictive of future h-index. It is possible to try the predictions using an online tool.[50] However, later work has shown that since h-index is a cumulative measure, it contains intrinsic auto-correlation that led to significant overestimation of its predictability. Thus, the true predictability of future h-index is much lower compared to what has been claimed before.[51]
- The i10-index indicates the number of academic publications an author has written that have been cited by at least ten sources. It was introduced in July 2011 by Google as part of their work on Google Scholar.[52]
- The h-index has been shown to have a strong discipline bias. However, a simple normalization by the average h of scholars in a discipline d is an effective way to mitigate this bias, obtaining a universal impact metric that allows comparison of scholars across different disciplines.[53] Of course this method does not deal with academic age bias.
- The h-index can be timed to analyze its evolution during one's career, employing different time windows.[54]
- The o-index corresponds to the geometric mean of the h-index and the most cited paper of a researcher.[55]
- The RA-index accommodates improving the sensitivity of the h-index on the number of highly cited papers and has many cited paper and uncited paper under the h-core. This improvement can enhance the measurement sensitivity of the h-index. [56]


Applications
Indices similar to the h-index have been applied outside of author level metrics.
The h-index has been applied to Internet Media, such as YouTube channels. It is defined as the number of videos with ≥ h × 105 views. When compared with a video creator's total view count, the h-index and g-index better capture both productivity and impact in a single metric.[57]
A successive Hirsch-type-index for institutions has also been devised.[58][59] A scientific institution has a successive Hirsch-type-index of i when at least i researchers from that institution have an h-index of at least i.
References
- Bornmann, Lutz; Daniel, Hans-Dieter (July 2007). "What do we know about the h-index?". Journal of the American Society for Information Science and Technology. 58 (9): 1381–1385. doi:10.1002/asi.20609.
- Suzuki, Helder (2012). "Google Scholar Metrics for Publications". googlescholar.blogspot.com.br.
- Jones, T.; Huggett, S.; Kamalski, J. (2011). "Finding a Way Through the Scientific Literature: Indexes and Measures". World Neurosurgery. 76 (1–2): 36–38. doi:10.1016/j.wneu.2011.01.015. PMID 21839937.
- Hirsch, J. E. (15 November 2005). "An index to quantify an individual's scientific research output". PNAS. 102 (46): 16569–72. arXiv:physics/0508025. Bibcode:2005PNAS..10216569H. doi:10.1073/pnas.0507655102. PMC 1283832. PMID 16275915.
- McDonald, Kim (8 November 2005). "Physicist Proposes New Way to Rank Scientific Output". PhysOrg. Retrieved 13 May 2010.
- "Key Measures of Academic Influence". LSE Impact Blog. London School of Economics. Retrieved 19 April 2020.
- Google Scholar Citations Help, retrieved 2012-09-18.
- Bar-Ilan, J. (2007). "Which h-index? – A comparison of WoS, Scopus and Google Scholar". Scientometrics. 74 (2): 257–71. doi:10.1007/s11192-008-0216-y.
- Meho, L. I.; Yang, K. (2007). "Impact of Data Sources on Citation Counts and Rankings of LIS Faculty: Web of Science vs. Scopus and Google Scholar". Journal of the American Society for Information Science and Technology. 58 (13): 2105–25. doi:10.1002/asi.20677.
- Meho, L. I.; Yang, K (23 December 2006). "A New Era in Citation and Bibliometric Analyses: Web of Science, Scopus, and Google Scholar". arXiv:cs/0612132. (preprint of paper published as 'Impact of data sources on citation counts and rankings of LIS faculty: Web of Science versus Scopus and Google Scholar', in Journal of the American Society for Information Science and Technology, Vol. 58, No. 13, 2007, 2105–25)
- Meyer, Bertrand; Choppy, Christine; Staunstrup, Jørgen; Van Leeuwen, Jan (2009). "Research Evaluation for Computer Science". Communications of the ACM. 52 (4): 31–34. doi:10.1145/1498765.1498780..
- Jacsó, Péter (2006). "Dubious hit counts and cuckoo's eggs". Online Information Review. 30 (2): 188–93. doi:10.1108/14684520610659201.
- Sanderson, Mark (2008). "Revisiting h measured on UK LIS and IR academics". Journal of the American Society for Information Science and Technology. 59 (7): 1184–90. CiteSeerX 10.1.1.474.1990. doi:10.1002/asi.20771.
- Peterson, Ivars (December 2, 2005). "Rating Researchers". Science News. Retrieved 13 May 2010.
- "Citation Thresholds (Essential Science Indicators)". Science Watch. Thomson Reuters. May 1, 2010. Archived from the original on 5 May 2010. Retrieved 13 May 2010.
- "Impact of Social Sciences – 3: Key Measures of Academic Influence". Impact of Social Sciences.
- Wendl, Michael (2007). "H-index: however ranked, citations need context". Nature. 449 (7161): 403. Bibcode:2007Natur.449..403W. doi:10.1038/449403b. PMID 17898746.
- Bornmann, L.; Daniel, H. D. (2008). "What do citation counts measure? A review of studies on citing behavior". Journal of Documentation. 64 (1): 45–80. doi:10.1108/00220410810844150.
- Anauati, Maria Victoria; Galiani, Sebastian; Gálvez, Ramiro H. (November 11, 2014). "Quantifying the Life Cycle of Scholarly Articles Across Fields of Economic Research". SSRN 2523078.
- Sekercioglu, Cagan H. (2008). "Quantifying coauthor contributions" (PDF). Science. 322 (5900): 371. doi:10.1126/science.322.5900.371a. PMID 18927373.
- Zhang, Chun-Ting (2009). "A proposal for calculating weighted citations based on author rank". EMBO Reports. 10 (5): 416–17. doi:10.1038/embor.2009.74. PMC 2680883. PMID 19415071.
- Sune Lehmann; Jackson, Andrew D.; Lautrup, Benny E. (2006). "Measures for measures". Nature. 444 (7122): 1003–04. Bibcode:2006Natur.444.1003L. doi:10.1038/4441003a. PMID 17183295.
- Hirsch J. E. (2007). "Does the h-index have predictive power?". PNAS. 104 (49): 19193–98. arXiv:0708.0646. Bibcode:2007PNAS..10419193H. doi:10.1073/pnas.0707962104. PMC 2148266. PMID 18040045.
- Ruane, F.P.; Tol, R.S.J. (2008). "Rational (successive) H-indices: An application to economics in the Republic of Ireland". Scientometrics. 75 (2): 395–405. doi:10.1007/s11192-007-1869-7. hdl:1871/31768.
- Yong, Alexander (2014). "Critique of Hirsch's Citation Index: A Combinatorial Fermi Problem" (PDF). Notices of the American Mathematical Society. 61 (11): 1040–1050. arXiv:1402.4357. doi:10.1090/noti1164.
- Gálvez, Ramiro H. (March 2017). "Assessing author self-citation as a mechanism of relevant knowledge diffusion". Scientometrics. 111 (3): 1801–1812. doi:10.1007/s11192-017-2330-1.
- Christoph Bartneck & Servaas Kokkelmans; Kokkelmans (2011). "Detecting h-index manipulation through self-citation analysis". Scientometrics. 87 (1): 85–98. doi:10.1007/s11192-010-0306-5. PMC 3043246. PMID 21472020.
- Emilio Ferrara & Alfonso Romero; Romero (2013). "Scientific impact evaluation and the effect of self-citations: Mitigating the bias by discounting the h-index". Journal of the American Society for Information Science and Technology. 64 (11): 2332–39. arXiv:1202.3119. doi:10.1002/asi.22976.
- Labbé, Cyril (2010). Ike Antkare one of the great stars in the scientific firmament (PDF). Laboratoire d'Informatique de Grenoble RR-LIG-2008 (technical report) (Report). Joseph Fourier University.
- Wilhite, A. W.; Fong, E. A. (2012). "Coercive Citation in Academic Publishing". Science. 335 (6068): 542–3. Bibcode:2012Sci...335..542W. doi:10.1126/science.1212540. PMID 22301307.
- Noorden, Richard Van (February 6, 2020). "Highly cited researcher banned from journal board for citation abuse". Nature. 578 (7794): 200–201. Bibcode:2020Natur.578..200V. doi:10.1038/d41586-020-00335-7. PMID 32047304.
- Batista P. D.; et al. (2006). "Is it possible to compare researchers with different scientific interests?". Scientometrics. 68 (1): 179–89. arXiv:physics/0509048. doi:10.1007/s11192-006-0090-4.
- Sidiropoulos, Antonis; Katsaros, Dimitrios; Manolopoulos, Yannis (2007). "Generalized Hirsch h-index for disclosing latent facts in citation networks". Scientometrics. 72 (2): 253–80. CiteSeerX 10.1.1.76.3617. doi:10.1007/s11192-007-1722-z.
- Jayant S Vaidya (December 2005). "V-index: A fairer index to quantify an individual's research output capacity". BMJ. 331 (7528): 1339–c–40–c. doi:10.1136/bmj.331.7528.1339-c. PMC 1298903. PMID 16322034.
- Katsaros D., Sidiropoulos A., Manolopous Y., (2007), Age Decaying H-Index for Social Network of Citations in Proceedings of Workshop on Social Aspects of the Web Poznan, Poland, April 27, 2007
- Anderson, T.R.; Hankin, R.K.S and Killworth, P.D. (2008). "Beyond the Durfee square: Enhancing the h-index to score total publication output". Scientometrics. 76 (3): 577–88. doi:10.1007/s11192-007-2071-2.CS1 maint: multiple names: authors list (link)
- Baldock, C.; Ma, R.M.S and Orton, C.G.; Orton, Colin G. (2009). "The h index is the best measure of a scientist's research productivity". Medical Physics. 36 (4): 1043–45. Bibcode:2009MedPh..36.1043B. doi:10.1118/1.3089421. PMID 19472608.CS1 maint: multiple names: authors list (link)
- Bornmann, L.; et al. (2011). "A multilevel meta-analysis of studies reporting correlations between the h-index and 37 different h-index variants". Journal of Informetrics. 5 (3): 346–59. doi:10.1016/j.joi.2011.01.006.
- Anne-Wil Harzing (2008-04-23). "Reflections on the h-index". Retrieved 2013-07-18.
- von Bohlen und Halbach O (2011). "How to judge a book by its cover? How useful are bibliometric indices for the evaluation of "scientific quality" or "scientific productivity"?". Annals of Anatomy. 193 (3): 191–96. doi:10.1016/j.aanat.2011.03.011. PMID 21507617.
- Tscharntke, T.; Hochberg, M. E.; Rand, T. A.; Resh, V. H.; Krauss, J. (2007). "Author Sequence and Credit for Contributions in Multiauthored Publications". PLOS Biology. 5 (1): e18. doi:10.1371/journal.pbio.0050018. PMC 1769438. PMID 17227141.
- Gągolewski, M.; Grzegorzewski, P. (2009). "A geometric approach to the construction of scientific impact indices". Scientometrics. 81 (3): 617–34. doi:10.1007/s11192-008-2253-y.
- Bornmann, Lutz; Mutz, Rüdiger; Daniel, Hans-Dieter (2010). "The h index research output measurement: Two approaches to enhance its accuracy". Journal of Informetrics. 4 (3): 407–14. doi:10.1016/j.joi.2010.03.005.
- Egghe, Leo (2013). "Theory and practise of the g-index" (PDF). Scientometrics. 69: 131–52. doi:10.1007/s11192-006-0144-7. hdl:1942/981.
- Kashyap Dixit; S Kameshwaran; Sameep Mehta; Vinayaka Pandit; N Viswanadham (February 2009). "Towards simultaneously exploiting structure and outcomes in interaction networks for node ranking" (PDF). IBM Research Report R109002.; see also Kameshwaran, Sampath; Pandit, Vinayaka; Mehta, Sameep; Viswanadham, Nukala; Dixit, Kashyap (2010). "Outcome aware ranking in interaction networks". Proceedings of the 19th ACM international conference on Information and knowledge management – CIKM '10. p. 229. doi:10.1145/1871437.1871470. ISBN 9781450300995.
- Bras-Amorós, M.; Domingo-Ferrer, J.; Torra, V (2011). "A bibliometric index based on the collaboration distance between cited and citing authors". Journal of Informetrics. 5 (2): 248–64. doi:10.1016/j.joi.2010.11.001. hdl:10261/138172.
- Silagadze, Z. K. (2010). "Citation entropy and research impact estimation". Acta Physica Polonica B. 41 (11): 2325–33. arXiv:0905.1039.
- Zhang, Chun-Ting (2009). Joly, Etienne (ed.). "The e-Index, Complementing the h-Index for Excess Citations". PLOS ONE. 4 (5): e5429. Bibcode:2009PLoSO...4.5429Z. doi:10.1371/journal.pone.0005429. PMC 2673580. PMID 19415119.
- Dodson, M.V. (2009). "Citation analysis: Maintenance of h-index and use of e-index". Biochemical and Biophysical Research Communications. 387 (4): 625–26. doi:10.1016/j.bbrc.2009.07.091. PMID 19632203.
- Acuna, Daniel E.; Allesina, Stefano; Kording, Konrad P. (2012). "Future impact: Predicting scientific success". Nature. 489 (7415): 201–02. Bibcode:2012Natur.489..201A. doi:10.1038/489201a. PMC 3770471. PMID 22972278.
- Penner, Orion; Pan, Raj K.; Petersen, Alexander M.; Kaski, Kimmo; Fortunato, Santo (2013). "On the Predictability of Future Impact in Science". Scientific Reports. 3 (3052): 3052. arXiv:1306.0114. Bibcode:2013NatSR...3E3052P. doi:10.1038/srep03052. PMC 3810665. PMID 24165898.
- Connor, James; Google Scholar Blog. "Google Scholar Citations Open To All", Google, 16 November 2011, retrieved 24 November 2011
- Kaur, Jasleen; Radicchi, Filippo; Menczer, Filippo (2013). "Universality of scholarly impact metrics". Journal of Informetrics. 7 (4): 924–32. arXiv:1305.6339. doi:10.1016/j.joi.2013.09.002.
- Schreiber, Michael (2015). "Restricting the h-index to a publication and citation time window: A case study of a timed Hirsch index". Journal of Informetrics. 9: 150–55. arXiv:1412.5050. doi:10.1016/j.joi.2014.12.005.
- Dorogovtsev, S.N.; Mendes, J.F.F. (2015). "Ranking Scientists". Nature Physics. 11 (11): 882–84. arXiv:1511.01545. Bibcode:2015NatPh..11..882D. doi:10.1038/nphys3533.
- Fatchur Rochim, Adian (November 2018). "Improving fairness of h-index: RA-index". DESIDOC Journal of Library and Information Technology. 38 (6): 378–386. doi:10.14429/djlit.38.6.12937.
- Hovden, R. (2013). "Bibliometrics for Internet media: Applying the h-index to YouTube". Journal of the American Society for Information Science and Technology. 64 (11): 2326–31. arXiv:1303.0766. doi:10.1002/asi.22936.
- Kosmulski, M. (2006). "I – a bibliometric index". Forum Akademickie. 11: 31.
- Prathap, G. (2006). "Hirsch-type indices for ranking institutions' scientific research output". Current Science. 91 (11): 1439.
Further reading
- Alonso, S.; Cabrerizo, F. J.; Herrera-Viedma, E.; Herrera, F. (2009). "h-index: A Review Focused in its Variants, Computation and Standardization for Different Scientific Fields" (PDF). Journal of Informetrics. 3 (4): 273–89. doi:10.1016/j.joi.2009.04.001.
- Ball, Philip (2005). "Index aims for fair ranking of scientists". Nature. 436 (7053): 900. Bibcode:2005Natur.436..900B. doi:10.1038/436900a. PMID 16107806.
- Iglesias, Juan E.; Pecharromán, Carlos (2007). "Scaling the h-index for different scientific ISI fields". Scientometrics. 73 (3): 303–320. arXiv:physics/0607224. doi:10.1007/s11192-007-1805-x.
- Kelly, C. D.; Jennions, M. D. (2006). "The h index and career assessment by numbers". Trends in Ecology & Evolution. 21 (4): 167–70. doi:10.1016/j.tree.2006.01.005. PMID 16701079.
- Lehmann, S.; Jackson, A. D.; Lautrup, B. E. (2006). "Measures for measures". Nature. 444 (7122): 1003–04. Bibcode:2006Natur.444.1003L. doi:10.1038/4441003a. PMID 17183295.
- Panaretos, J.; Malesios, C. (2009). "Assessing Scientific Research Performance and Impact with Single Indices". Scientometrics. 81 (3): 635–70. arXiv:0812.4542. doi:10.1007/s11192-008-2174-9.
- Petersen, A. M.; Stanley, H. Eugene; Succi, Sauro (2011). "Statistical Regularities in the Rank-Citation Profile of Scientists". Scientific Reports. 181 (181): 1–7. arXiv:1103.2719. Bibcode:2011NatSR...1E.181P. doi:10.1038/srep00181. PMC 3240955. PMID 22355696.
- Sidiropoulos, Antonis; Katsaros, Dimitrios; Manolopoulos, Yannis (2007). "Generalized Hirsch h-index for disclosing latent facts in citation networks". Scientometrics. 72 (2): 253–80. CiteSeerX 10.1.1.76.3617. doi:10.1007/s11192-007-1722-z.
- Soler, José M. (2007). "A rational indicator of scientific creativity". Journal of Informetrics. 1 (2): 123–30. arXiv:physics/0608006. doi:10.1016/j.joi.2006.10.004.
- Symonds, M. R.; et al. (2006). Tregenza, Tom (ed.). "Gender differences in publication output: towards an unbiased metric of research performance". PLOS ONE. 1 (1): e127. Bibcode:2006PLoSO...1..127S. doi:10.1371/journal.pone.0000127. PMC 1762413. PMID 17205131.
- Taber, Douglass F. (2005). "Quantifying Publication Impact". Science. 309 (5744): 2166a. doi:10.1126/science.309.5744.2166a. PMID 16195445.
- Woeginger, Gerhard J. (2008). "An axiomatic characterization of the Hirsch-index". Mathematical Social Sciences. 56 (2): 224–32. doi:10.1016/j.mathsocsci.2008.03.001.
External links
- Google Scholar Metrics
- H-index for computer science and electronics
- H-index for economists
- H-index for computer science researchers
- H-index for astronomers
| Journals | |
|---|---|
| Papers | |
| Other types of publication | |
| Impact and ranking | |
| Reform | |
| Indexes and search engines | |
| Related topics | |
| Lists |
|