Graphical abstract
A graphical abstract is a graphical or visual equivalent of a written abstract.[1][2] Graphical abstracts are a single image, designed to help the reader to quickly gain an overview on a scholarly paper, research article, thesis or review: and to quickly ascertain the purpose and results of a given research, as well as the salient details of authors and journal. Graphical abstracts are intended to help facilitate online browsing, as well as help readers quickly identify which papers are relevant to their research interests. Like a video abstract, they are not intended to replace the original research paper, rather to help draw attention to it, increasing its readership.
Types

To the broader scientific community, graphical abstracts are a relatively new concept: therefore, there is no ubiquitous standard or style of formatting. Nevertheless, several distinct styles have emerged, which are largely a reflection of the intended audience.
Diagram Style
Graphical abstracts, consisting mainly of diagrams, have been utilised since the mid to late 1970s,[3] primarily in the field of chemistry - due to the visual nature of the field.[4] This type of graphical abstract is usually produced by the researchers themselves with the intended audience being other researchers who are already very familiar with the topic, usually using highly technical language and abbreviations with no background context.
Visual Abstract Style
The visual abstract is a type of graphical abstract first introduced by Annals of Surgery’s Creative Editor Andrew Ibrahim, MD, from the Institute for Healthcare Policy & Innovation, Department of Surgery, University of Michigan.[5] Visual abstracts have been developed with a consistent formatting style in mind and are intended to be produced rapidly and easily by the researcher, using Microsoft PowerPoint. Although, professionally designed visual abstracts exist. The general format consists of a title, followed by one (or multiple) key findings, each with a text description and a visual icon, supported by data.[6] So far, visual abstracts appear to be used exclusively by medical journals.[7] The use of visual abstracts has been shown to increase overall engagement on social media, particularly among healthcare professionals.[8]
Infographic Style
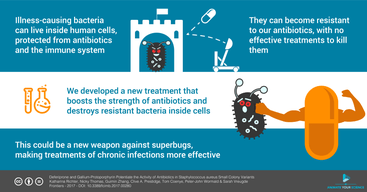
These graphical abstracts tend to feature text and graphics together in a more visually appealing way. Infographic style graphical abstracts are usually made with advanced illustrating software, and are therefore usually professionally produced. The intended audience is not limited to any particular level of research training, and can be aimed at expert researchers or the general public. Although, given their emphasis on well-presented graphics, this style is usually intended to engage a broader reader audience than expert researchers.
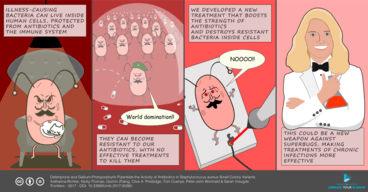
Comic Style
The comic style of graphical abstract is the most accessible form of graphical abstract. This style uses humour and illustrations to convey the research findings in a fun and more light-hearted way. It is therefore a popular style when aiming to engage the largest public audience.
Evidence of effectiveness
There are relatively few studies investigating the efficacy of graphical abstracts at increasing publication impact.
Some studies have focussed specifically on the impact of using Visual Abstracts. One study revealed that, relative to tweets without a visual abstract, tweets with a visual abstract produced a 7.7-fold increase in Twitter impressions, an 8.4-fold increase in retweets, and resulted in a 2.7-fold increase in article visits.[11]
However, a study in 2016 compared publications with or without graphical abstracts published in Molecules between March 2014 and March 2015, and found no apparent benefit of including graphical abstracts with the published manuscripts. Manuscripts published without a graphical abstract performed significantly better in terms of PDF downloads, abstract views, and total citations than manuscripts with a graphical abstract.[1] This appears to be the only empirical study of its kind, testing the effectiveness of graphical abstracts, and further studies that are not limited to one journal and one year of publications, would be useful in further establishing whether or not graphical abstracts are effective increasing publication impact.
Applications of a graphical abstract
- Conferences
- Blog [12]
- Grant application
- In the search results (e.g. ScienceDirect), together with the paper's title and list of authors.
- Job application
- Media release
- Online page of your journal article (for the journals that allow it)
- Online Table of Contents on the journal website (example)
- Personal/lab webpage
- Public lectures and community engagement events
- Social media (Twitter, Facebook, Instagram, LinkedIn, YouTube)
- Within a scientific manuscript (together with the title and abstract/summary)
Where to submit
References
- Pferschy-Wenzig, Eva-Maria; Pferschy, Ulrich; Wang, Dongdong; Mocan, Andrei; Atanasov, Atanas G. (2016-09-18). "Does a Graphical Abstract Bring More Visibility to Your Paper?". Molecules. 21 (9): 1247. doi:10.3390/molecules21091247. ISSN 1420-3049. PMC 5283664. PMID 27649137.
- "Graphical Abstract Description and Specifications, IEEE Electron Devices Society". eds.ieee.org. US: IEEE Electron Devices Society, Institute of Electrical and Electronics Engineers. Retrieved 2019-02-01.
- Ibrahim, Andrew M. (April 2018). "Seeing is Believing: Using Visual Abstracts to Disseminate Scientific Research". The American Journal of Gastroenterology. 113 (4): 459–461. doi:10.1038/ajg.2017.268. ISSN 1572-0241. PMID 28925990.
- "The art of abstracts". Nature Chemistry. 3 (8): 571. August 2011. doi:10.1038/nchem.1109. ISSN 1755-4349. PMID 21778967.
- Lawrence, Peter F.; Gloviczki, Peter (2018-05-01). "Visual abstracts bring key message of scientific research". Journal of Vascular Surgery. 67 (5): 1319–1320. doi:10.1016/j.jvs.2018.04.003. ISSN 0741-5214. PMID 29685244.
- Ibrahim, Andrew M. (April 2018). "Seeing is Believing: Using Visual Abstracts to Disseminate Scientific Research". The American Journal of Gastroenterology. 113 (4): 459–461. doi:10.1038/ajg.2017.268. ISSN 1572-0241. PMID 28925990.
- Ambrosino, Fabio (2018-02-27). "Visual abstracts to disseminate research on Twitter: a quantitative analysis". Cite journal requires
|journal=(help) - Chapman, S. J.; Grossman, R. C.; FitzPatrick, M. E. B.; Brady, R. R. W. (2019). "Randomized controlled trial of plain English and visual abstracts for disseminating surgical research via social media". BJS. 106 (12): 1611–1616. doi:10.1002/bjs.11307. ISSN 0007-1323. PMID 31577372.
- "Graphical and video abstracts | Animate Your Science". Graphical and video abstracts | Animate Your Science. Retrieved 2019-01-29.
- "The art of abstracts". Nature Chemistry. 3 (8): 571. August 2011. doi:10.1038/nchem.1109. ISSN 1755-4349. PMID 21778967.
- Ibrahim, Andrew M.; Lillemoe, Keith D.; Klingensmith, Mary E.; Dimick, Justin B. (December 2017). "Visual Abstracts to Disseminate Research on Social Media: A Prospective, Case-control Crossover Study". Annals of Surgery. 266 (6): e46–e48. doi:10.1097/SLA.0000000000002277. ISSN 0003-4932. PMID 28448382.
- "Graphical Abstracts: Master the Latest Trend". Graphical and video abstracts | Animate Your Science. Retrieved 2019-02-11.
- "Graphical and video abstracts | Animate Your Science". Graphical and video abstracts | Animate Your Science. Retrieved 2019-01-29.
- "Graphical Abstract, Graphical Abstract Design, Abstract Graphic Example, Journal Graphical Abstracts". www.letpub.com. Retrieved 2019-01-29.