Global warming in Antarctica
The effects of global warming in Antarctica may include rising temperatures and increasing snowmelt and ice loss.[1] A summary study in 2018 incorporating calculations and data from many other studies estimated that total ice loss was 43 gigatons per year on average during the period from 1992 to 2002 but has accelerated to an average of 220 gigatons per year during the five years from 2012 to 2017.[2]
Effects
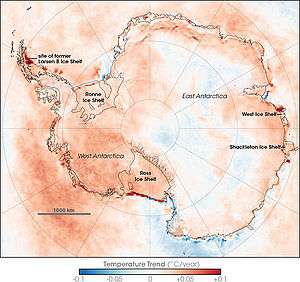
The continent-wide average surface temperature trend of Antarctica is positive and significant at >0.05 °C/decade since 1957.[3][4][5][6] The West Antarctic ice sheet has warmed by more than 0.1 °C/decade in the last 50 years, with most of the warming occurring in winter and spring. This is somewhat offset by cooling in East Antarctica during the fall. This effect is restricted to the 1980s and 1990s.[3][4][5]
Research published in 2009 found that overall the continent had become warmer since the 1950s, a finding consistent with the influence of man-made climate change:
- "We can't pin it down, but it certainly is consistent with the influence of greenhouse gases from fossil fuels"',said NASA scientist Drew Shindell, another study co-author. Some of the effects also could be natural variability, he said.[7]
2000s
The British Antarctic Survey, which has undertaken the majority of Britain's scientific research in the area, had the following positions in 2006:[8]
- Ice makes cold climate-sensitive by introducing a strong positive feedback loop.
- Melting of continental Antarctic ice could contribute to global sea-level rise.
- Climate models predict more snowfall than ice melting during the next 50 years, but the models are not good enough for them to be confident about the prediction.
- Antarctica seems to be both warming around the edges and cooling at the center at the same time. Thus it is not possible to say whether it is warming or cooling overall.
- There is no evidence for a decline in the overall Antarctic sea ice extent.[9]
- The central and southern parts of the west coast of the Antarctic Peninsula have warmed by about 2.4 °C. The cause is not known.
- Changes have occurred in the upper atmosphere over Antarctica.

The area of strongest cooling appears at the South Pole, and the region of strongest warming lies along the Antarctic Peninsula. A possible explanation is that loss of UV-absorbing ozone may have cooled the stratosphere and strengthened the polar vortex, a pattern of spinning winds around the South Pole. The vortex acts like an atmospheric barrier, preventing warmer, coastal air from moving into the continent's interior. A stronger polar vortex might explain the cooling trend in the interior of Antarctica.
In their latest study (September 20, 2007) NASA researchers have confirmed that Antarctic snow is melting farther inland from the coast over time, melting at higher altitudes than ever and increasingly melting on Antarctica's largest ice shelf.[10]
There is also evidence for widespread glacier retreat around the Antarctic Peninsula.[11]
2010s
Researchers reported on December 21, 2012 in Nature Geoscience that from 1958 to 2010, the average temperature at the mile-high Byrd Station rose by 2.4 degrees Celsius, with warming fastest in its winter and spring. The spot which is in the heart of the West Antarctic Ice Sheet is one of the fastest-warming places on Earth.[12][13][14]
A study of the Antarctic Peninsula, a small subregion of Lesser Antarctica, published in 2017 found that the temperature trends at the northern tip of the Peninsula, the north-east region of the Peninsula, and the South Shetland Islands "shifted from a warming trend of 0.32 °C/decade during 1979–1997 to a cooling trend of -0.47 °C/decade during 1999–2014" but that this variation was absent from the south-west region of the Peninsula.[15]
A 2018 systematic review of all previous studies and data by the Ice Sheet Mass Balance Inter-comparison Exercise (IMBIE) found that Antarctica lost 2720 ± 1390 gigatons of ice during the period from 1992 to 2017, enough to contribute 7.6 millimeters to sea level rise once all detached icebergs melt. Most ice losses occurred in West Antarctica and the Antarctic Peninsula. The overall loss has substantially accelerated since the 2012 IMBIE assessment: an average loss of 43 gigatons per year during the first ten years, 1992 to 2002, rose to an average of 220 gigatons per year in the last 5 years. East Antarctica appears to have experienced a net gain of a relatively small amount of ice during the 25-years although uncertainty is greater due to subsidence of the underlying bedrock.[2]
Through his ongoing study, climate scientist, Nick Golledge, has estimated that Antarctic ice sheets will continue to melt and will have a profound effect on global climate.[16]According to Golledge's analysis, by the year 2100, 25 centimeters of water will have been added to the world's ocean, as water temperature continues to rise.[17]
References
- The Danger of a Runaway Antarctica March 31, 2016,
- Shepherd, Andrew; Ivins, Erik; et al. (IMBIE team) (2018-06-13). "Mass balance of the Antarctic Ice Sheet from 1992 to 2017" (PDF). Nature. 558 (7709): 219–222. Bibcode:2018Natur.558..219I. doi:10.1038/s41586-018-0179-y. PMID 29899482. Lay summary – Ars Technica (2018-06-13).
- Naumer, Tenney (21 January 2009). "Climate Change: The Next Generation: Eric J. Steig: Temperature in West Antarctica over the last 50 and 200 years".
- Retrieved=2009-01-22 Archived December 29, 2008, at the Wayback Machine
- Steig, Eric J.; Schneider, David P.; Rutherford, Scott D.; Mann, Michael E.; Comiso, Josefino C.; Shindell, Drew T. (22 January 2009). "Warming of the Antarctic ice-sheet surface since the 1957 International Geophysical Year". Nature. 457 (7228): 459–462. Bibcode:2009Natur.457..459S. doi:10.1038/nature07669. PMID 19158794.
- Ingham, Richard (21 January 2009). "Global warming hitting all of Antarctica: scientists". The Sydney Morning Herald.
- Antarctica study challenges warming skeptics, Jan 21, 2009,
- "Climate Change Positions". British Antarctic Survey. Archived from the original on February 7, 2006. Retrieved May 30, 2016.
- Wayman, Erin (24 April 2014). "In Antarctica, melting may beget ice".
- "NASA - NASA Researchers Find Snowmelt in Antarctica Creeping Inland". www.nasa.gov.
- IPCC 2007, Intergovernmental Panel on Climate Change, Climate Change 2007: The Physical Science Basis. Contribution of Working Group I to the Fourth Assessment Report of the Intergovernmental Panel on Climate Change, Cambridge University Press, 2007, page 376.
- West Antarctica warming fast; Temperature record from high-altitude station shows unexpectedly rapid rise December 21, 2012 Science News
- Bromwich, David H.; Nicolas, Julien P.; Monaghan, Andrew J.; Lazzara, Matthew A.; Keller, Linda M.; Weidner, George A.; Wilson, Aaron B. (23 December 2012). "Central West Antarctica among the most rapidly warming regions on Earth". Nature Geoscience. 6 (2): 139–145. Bibcode:2013NatGe...6..139B. CiteSeerX 10.1.1.394.1974. doi:10.1038/ngeo1671.
- Bromwich, D. H.; Nicolas, J. P.; Monaghan, A. J.; Lazzara, M. A.; Keller, L. M.; Weidner, G. A.; Wilson, A. B. (2012). "Central West Antarctica among the most rapidly warming regions on Earth". Nature Geoscience. 6 (2): 139. Bibcode:2013NatGe...6..139B. CiteSeerX 10.1.1.394.1974. doi:10.1038/ngeo1671.
- Oliva, M; Navarro, F; Hrbáček, F; Hernández, A; Nývltc, D (February 2017). P. Pereira, J. Ruiz-Fernández, R. Trigo. "Recent regional climate cooling on the Antarctic Peninsula and associated impacts on the cryosphere". Science of the Total Environment. 580: 210–223. doi:10.1016/j.scitotenv.2016.12.030. hdl:10451/36205. Retrieved May 1, 2017.
The Antarctic Peninsula (AP) is often described as a region with one of the largest warming trends on Earth since the 1950s, based on the temperature trend of 0.54 °C/decade during 1951–2011 recorded at Faraday/Vernadsky station. Accordingly, most works describing the evolution of the natural systems in the AP region cite this extreme trend as the underlying cause of their observed changes. However, a recent analysis (Turner et al., 2016) has shown that the regionally stacked temperature record for the last three decades has shifted from a warming trend of 0.32 °C/decade during 1979–1997 to a cooling trend of − 0.47 °C/decade during 1999–2014. While that study focuses on the period 1979–2014, averaging the data over the entire AP region, we here update and re-assess the spatially-distributed temperature trends and inter-decadal variability from 1950 to 2015, using data from ten stations distributed across the AP region. We show that Faraday/Vernadsky warming trend is an extreme case, circa twice those of the long-term records from other parts of the northern AP. Our results also indicate that the cooling initiated in 1998/1999 has been most significant in the N and NE of the AP and the South Shetland Islands (> 0.5 °C between the two last decades), modest in the Orkney Islands, and absent in the SW of the AP. This recent cooling has already impacted the cryosphere in the northern AP, including slow-down of glacier recession, a shift to surface mass gains of the peripheral glacier and a thinning of the active layer of permafrost in northern AP islands.
- "Most dire projection of sea-level rise is a little less likely, reports say". Environment. 2019-02-06. Retrieved 2020-04-01.
- Golledge, Nicholas R.; Keller, Elizabeth D.; Gomez, Natalya; Naughten, Kaitlin A.; Bernales, Jorge; Trusel, Luke D.; Edwards, Tamsin L. (2019-02-06). "Global environmental consequences of twenty-first-century ice-sheet melt". Nature. 566 (7742): 65–72. doi:10.1038/s41586-019-0889-9. ISSN 1476-4687. Retrieved 2020-04-02.
External links
- White Ocean of Ice Antartica and climate change blog
- Antarctica is losing ice at an accelerating rate. How much will sea levels rise? on YouTube published on April 10, 2019 PBS NewsHour
| General |
| .svg.png) |
|---|---|---|
| Geographic regions | ||
| Waterways | ||
| Famous explorers | ||