Firearm death rates in the United States by state
This article is a list of U.S. states with firearm death rates per 100,000 population.
In 2016, the overall rate of death by firearms in the United States was 11.8[1] per 100,000 people — the same as for death by motor vehicles — with suicides accounting for roughly two out of every three gun deaths.
Overall firearm death rates
State firearm death rates, 2016. Rate per 100,000 population. National firearm death rate is 11.8.[2] These numbers include (among others) death as a result of suicide, self-defense and accidents. A list regarding only murders is provided below.
| State | Rate | Deaths |
|---|---|---|
| Alabama (AL) | 21.5 | 1,046 |
| Alaska (AK) | 23.3 | 177 |
| Arizona (AZ) | 5 | 1,094 |
| Arkansas (AR) | 17.8 | 541 |
| California (CA) | 7.9 | 3,184 |
| Colorado (CO) | 14.3 | 812 |
| Connecticut (CT) | 4.6 | 172 |
| Delaware (DE) | 11 | 111 |
| Florida (FL) | 12.6 | 2,704 |
| Georgia (GA) | 15 | 1,571 |
| Hawaii (HI) | 4.5 | 66 |
| Idaho (ID) | 14.6 | 242 |
| Illinois (IL) | 11.7 | 1,490 |
| Indiana (IN) | 15 | 997 |
| Iowa (IA) | 9.2 | 288 |
| Kansas (KS) | 13.4 | 383 |
| Kentucky (KY) | 17.5 | 772 |
| Louisiana (LA) | 21.3 | 987 |
| Maine (ME) | 8.3 | 123 |
| Maryland (MD) | 47.92 | 1,581 |
| Massachusetts (MA) | 3.4 | 242 |
| Michigan (MI) | 12.3 | 1,230 |
| Minnesota (MN) | 7.6 | 432 |
| Mississippi (MS) | 19.9 | 587 |
| Missouri (MO) | 19 | 1,144 |
| Montana (MT) | 18.9 | 194 |
| Nebraska (NE) | 9.1 | 171 |
| Nevada (NV) | 16.8 | 498 |
| New Hampshire (NH) | 9.3 | 132 |
| New Jersey (NJ) | 5.5 | 485 |
| New Mexico (NM) | 18.1 | 383 |
| New York (NY) | 4.4 | 900 |
| North Carolina (NC) | 13.7 | 1,409 |
| North Dakota (ND) | 11.9 | 90 |
| Ohio (OH) | 12.9 | 1,524 |
| Oklahoma (OK) | 19.6 | 766 |
| Oregon (OR) | 11.9 | 513 |
| Pennsylvania (PA) | 12 | 1,555 |
| Rhode Island (RI) | 4.1 | 49 |
| South Carolina (SC) | 17.7 | 891 |
| South Dakota (SD) | 13.4 | 108 |
| Tennessee (TN) | 17.1 | 1,148 |
| Texas (TX) | 12.1 | 3,353 |
| Utah (UT) | 12.9 | 370 |
| Vermont (VT) | 11.1 | 78 |
| Virginia (VA) | 12.1 | 1,049 |
| Washington (WA) | 9 | 686 |
| West Virginia (WV) | 17.5 | 332 |
| Wisconsin (WI) | 11.4 | 664 |
| Wyoming (WY) | 17.4 | 101 |
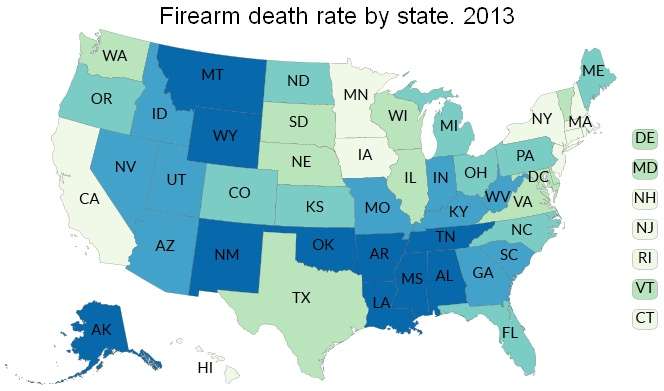
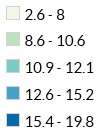
Age-adjusted table and map
 |
 |
These rates have been age-adjusted. The age-adjusted rates are rates that would exist if the population of each state had the same age distribution as the "standard" US population. See the references for more info:[3][4]
State firearm death rates, 2013. Rate per 100,000 population. Age-adjusted death rates. United States: 10.4
|
|
Murders
This is a list of the U.S. states and the District of Columbia. The population data is the official data from the U.S. Census Bureau.[5] The murder rates and gun murder rates were calculated based on the FBI reports.[6] The official population of each state for 2010 and gun ownership rates were added for context.[7]
The gun murders in 2010 from FBI Uniform Crime Reporting (UCR) program was 8,775.[8] The total number of murders from all weapons was 12,996.[8] These figures includes murders and willful manslaughters, but excludes "deaths caused by negligence, suicide, or accident" and justifiable homicides.[9] The U.S. reports a 70% conviction rate for murder prosecutions.[10]
| State | Population (total inhabitants) (2010) | Population density (inhabitants per square mile) (2010) | Murders
(total deaths) (2010) |
Gun
murders (total deaths)(2010) |
Gun
ownership (%)(2013) |
Murders
(rate per 100,000 inhabitants)(2010) |
Gun
murders (rate per 100,000 inhabitants) (2010) |
|---|---|---|---|---|---|---|---|
| Alabama | 4,779,736 | 94.65 | 199 | 135 | 48.9% | 4.2 | 2.8 |
| Alaska | 710,231 | 1.264 | 31 | 19 | 61.7% | 4.4 | 2.7 |
| Arizona | 6,392,017 | 57.05 | 326 | 232 | 32.3% | 4.5 | 3.6 |
| Arkansas | 2,915,918 | 56.43 | 130 | 93 | 57.9% | 4.5 | 3.2 |
| California | 37,253,956 | 244.2 | 1,811 | 1,257 | 20.1% | 4.9 | 3.4 |
| Colorado | 5,029,196 | 49.33 | 117 | 65 | 34.3% | 2.3 | 1.3 |
| Connecticut | 3,574,097 | 741.4 | 131 | 97 | 16.6% | 3.7 | 2.7 |
| Delaware | 897,934 | 470.7 | 48 | 38 | 5.2% | 5.3 | 4.2 |
| District of Columbia | 601,723 | 10298 | 131 | 99 | 25.9% | 21.8 | 16.5 |
| Florida | 19,687,653 | 360.2 | 987 | 669 | 32.5% | 5.0 | 3.4 |
| Georgia | 9,920,000 | 165 | 527 | 376 | 31.6% | 5.3 | 3.8 |
| Hawaii | 1,360,301 | 216.8 | 24 | 7 | 45.1% | 1.8 | 0.5 |
| Idaho | 1,567,582 | 19.5 | 21 | 12 | 56.9% | 1.3 | 0.8 |
| Illinois | 12,830,632 | 231.9 | 706 | 364 | 26.2% | 5.5 | 2.8 |
| Indiana | 6,483,802 | 182.5 | 198 | 142 | 33.8% | 3.1 | 2.2 |
| Iowa | 3,046,355 | 54.81 | 38 | 21 | 33.8% | 1.2 | 0.7 |
| Kansas | 2,853,118 | 35.09 | 100 | 63 | 32.2% | 3.5 | 2.2 |
| Kentucky | 4,339,367 | 110.0 | 180 | 116 | 42.4% | 4.5 | 2.7 |
| Louisiana | 4,533,372 | 105.0 | 437 | 351 | 44.5% | 9.6 | 7.7 |
| Maine | 1,328,361 | 43.04 | 24 | 11 | 22.6% | 1.8 | 0.8 |
| Maryland | 5,773,552 | 606.2 | 424 | 293 | 20.7% | 7.3 | 5.1 |
| Massachusetts | 6,547,629 | 852.1 | 209 | 118 | 22.6% | 3.2 | 1.8 |
| Michigan | 9,883,640 | 174.8 | 558 | 413 | 28.8% | 5.6 | 4.2 |
| Minnesota | 5,303,925 | 67.14 | 91 | 53 | 36.7% | 1.7 | 1.0 |
| Mississippi | 2,967,297 | 63.50 | 165 | 120 | 42.8% | 5.6 | 4.0 |
| Missouri | 5,988,927 | 87.26 | 419 | 321 | 27.1% | 7.0 | 5.4 |
| Montana | 989,415 | 6.858 | 21 | 12 | 52.3% | 2.1 | 1.2 |
| Nebraska | 1,826,341 | 23.97 | 51 | 32 | 19.8% | 2.8 | 1.8 |
| Nevada | 2,700,551 | 24.80 | 158 | 84 | 37.5% | 5.9 | 3.1 |
| New Hampshire | 1,316,470 | 147.0 | 13 | 5 | 14.4% | 1.0 | 0.4 |
| New Jersey | 8,791,894 | 1189 | 363 | 246 | 11.3% | 4.1 | 2.8 |
| New Mexico | 2,059,179 | 17.16 | 118 | 67 | 49.9% | 5.7 | 3.3 |
| New York | 19,378,102 | 415.3 | 860 | 517 | 10.3% | 4.4 | 2.7 |
| North Carolina | 9,535,483 | 200.6 | 445 | 286 | 28.7% | 4.7 | 3.0 |
| North Dakota | 672,591 | 9.916 | 9 | 4 | 47.9% | 1.3 | 0.6 |
| Ohio | 11,536,504 | 282.5 | 460 | 310 | 19.6% | 4.0 | 2.7 |
| Oklahoma | 3,751,351 | 55.22 | 188 | 111 | 31.2% | 5.0 | 3.0 |
| Oregon | 3,831,074 | 40.33 | 78 | 36 | 26.6% | 2.0 | 0.9 |
| Pennsylvania | 12,702,379 | 285.3 | 646 | 457 | 27.1% | 5.1 | 3.6 |
| Rhode Island | 1,052,567 | 1006 | 29 | 16 | 5.8% | 2.8 | 1.5 |
| South Carolina | 4,625,364 | 157.1 | 280 | 207 | 44.4% | 6.1 | 4.5 |
| South Dakota | 814,180 | 10.86 | 14 | 8 | 35.0% | 1.7 | 1.0 |
| Tennessee | 6,346,105 | 156.6 | 356 | 219 | 39.4% | 5.6 | 3.5 |
| Texas | 25,145,561 | 98.07 | 1,246 | 805 | 35.7% | 5.0 | 3.2 |
| Utah | 2,763,885 | 34.30 | 52 | 22 | 31.9% | 1.9 | 0.8 |
| Vermont | 625,741 | 67.73 | 7 | 2 | 28.8% | 1.1 | 0.3 |
| Virginia | 8,001,024 | 207.3 | 369 | 250 | 29.3% | 4.6 | 3.1 |
| Washington | 6,724,540 | 102.6 | 151 | 93 | 27.7% | 2.2 | 1.4 |
| West Virginia | 1,852,994 | 77.06 | 55 | 27 | 54.2% | 3.0 | 1.5 |
| Wisconsin | 5,686,986 | 105.2 | 151 | 97 | 34.7% | 2.7 | 1.7 |
| Wyoming | 563,626 | 5.851 | 8 | 5 | 53.8% | 1.4 | 0.9 |
See also
- Crime and violence in Latin America
- Gun laws in the United States by state
- Gun politics in the United States
- Gun violence in the United States by state
- Suicide in the United States
- Homicide in world cities
- Index of gun politics articles
- List of Brazilian states by murder rate
- List of cities by murder rate
- List of countries by firearm-related death rate
- List of countries by intentional death rate - homicide plus suicide.
- List of countries by intentional homicide rate by decade
- List of countries by intentional homicide rate
- List of countries by life expectancy
- List of countries by suicide rate
- List of federal subjects of Russia by murder rate
- List of Mexican states by homicides
- List of U.S. states by homicide rate
- List of U.S. states by incarceration rate
- List of United States cities by crime rate (2012). 250,001+
- Number of guns per capita by country
- Right to keep and bear arms in the United States
- United States cities by crime rate (100,000–250,000)
- United States cities by crime rate (60,000-100,000)
References
- "Stats of the States - Firearm Mortality". www.cdc.gov. 2018-05-01. Retrieved 2018-05-08.
- State Firearm Death Rates, Ranked by Rate, 2013. By Violence Policy Center. It sources the National Center for Injury Prevention and Control of the Centers for Disease Control and Prevention.
- Firearm Mortality by State: 2013. By National Center for Health Statistics of the Centers for Disease Control and Prevention. Map legend can be clicked to highlight different rate ranges on the map. Any state can be clicked for more detailed demographic statistics for that state.
- Detailed Tables for the National Vital Statistics Report (NVSR) "Deaths: Final Data for 2013." See: National Vital Statistics System.
- "U.S. Census 2010 Interactive Map".
- "Murder by State, Types of Weapons, 2010".
- Kalesan, Bindu; Villarreal, Marcos D.; Keyes, Katherine M.; Galea, Sandro (2015-06-09). "Gun ownership and social gun culture". Injury Prevention. 22: injuryprev–2015–041586. doi:10.1136/injuryprev-2015-041586. ISSN 1353-8047. PMC 4809774. PMID 26124073.
- "Table 20". FBI.
- "Murder". FBI.
- "Bureau of Justice Statistics (BJS) - FAQ Detail". www.bjs.gov.