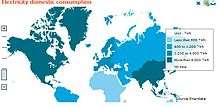
Electric energy consumption
Electric energy consumption is the form of energy consumption that uses electric energy. Electric energy consumption is the actual energy demand made on existing electricity supply.
The total electricity consumption in 2012 was 20,900 TWh, and in 2017 it was 21,372 TWh.
Overview
Electric energy is most often measured either in joules (J), or in watt hours (W·h) representing a constant power over a period of time.
- 1 W·s = 1 J
- 1 W·h = 3600 W·s = 3600 J
Electric and electronic devices consume electric energy to generate desired output (i.e., light, heat, motion, etc.). During operation, some part of the energy—depending on the electrical efficiency—is consumed in unintended output, such as waste heat.
Electricity has been generated in power stations since 1882.[2] The invention of the steam turbine in 1883 to drive the electric generator started a strong increase of world electricity consumption.
In 2008, the world total of electricity production was 20.279 petawatt-hours (PWh). This number corresponds to an average power of 2.31 TW continuously during the year. The total primary energy used in a thermal power station to produce this power is roughly a factor 2 to 3 higher because the efficiency of electricity generation is roughly 30–50% (see also energy conversion efficiency). The primary energy consumption to generate electric power is thus in the order of 5 TW. This is approximately a third of the total energy consumption of 15 TW (see world energy consumption).
In 2005, the primary energy used to generate electricity was 12,190 terawatt-hours (41.60 quad). This was compounded of Coal 6,160 TWh (21.01 quad), Natural (fossil) gas 1,960 TWh (6.69 quad), Petroleum 390 TWh (1.32 quad), Nuclear electric power 2,380 TWh (8.13 quad), Renewable energy 1,240 TWh (4.23 quad) respectively. The gross generation of electricity in that year was 4,250 TWh (14.50 quad); the difference of 7,940 TWh (27.10 quad) was conversion losses. Among all electricity, 1,420 TWh (4.84 quad) was used in residential area, 1,270 TWh (4.32 quad) used in commercial, 1,020 TWh (3.47 quad) used in industrial and 8.8 TWh (0.03 quad) used in transportation.
1 Quad = 1 Quadrillion BTU = 1 x 10¹⁵ BTU = 293 TWh
During the year 16,816 TWh (83%) of electric energy was consumed by final users. The difference of 3,464 TWh (17%) was consumed in the process of generating power and lost in transmission to end users.
A sensitivity analysis on an adaptive neuro-fuzzy network model for electric demand estimation shows that employment is the most critical factor influencing electrical consumption.[3] The study used six parameters as input data, employment, GDP, dwelling, population, heating degree day and cooling degree day, with electricity demand as output variable.
World electricity consumption down in 2009
At the world level, energy consumption was cut down by 1.5% during 2009, for the first time since World War II.[4] Except in Asia and Middle East, consumptions were reduced in all the world regions. In OECD countries, accounting for 53% of the total, electricity demand scaled down by more than 4.5% in both Europe and North America while it shrank by above 7% in Japan. Electricity demand also dropped by more than 4.5% in CIS countries, driven by a large cut in Russian consumption. Conversely, in China and India (22% of the world's consumption), electricity consumption continued to rise at a strong pace (+6-7%) to meet energy demand related to high economic growth. In Middle East, growth rate was softened but remained high, just below 4%.
World electricity consumption (2011)
The table lists the top 37 electricity consuming countries, which use 19,000 TWh/a. i.e. 90% of the consumption of all more than 190 countries. The total consumption (including the amount consumed by the power plants) and the energy sources to generate this electricity is given per country. The data is from 2012.[5][6]
| Rank | Country | Total (TWh) | Fossil | Nuclear | Renewable | Population (millions) | per capita (MWh) |
|---|---|---|---|---|---|---|---|
| — | WORLD | 20,900 (20.9 PWh) | 68% | 11% | 21% | 7,040 | 2.97 |
| 1 | 4,830 (4.83 PWh) | 78% | 2% | 20% | 1,356 | 3.56 | |
| 2 | 4,070 (4 PWh) | 66% | 19% | 13% | 314 | 12.96 | |
| 3 | 989 | 85% | 1% [7] | 12% | 128 | 7.73 | |
| 4 | 948 | 63% | 16% | 21% | 144 | 6.58 | |
| 5 | 940 | 81% | 3% | 16% | 1,237 | 0.760 | |
| 6 | 543 | 24% | 15% | 59% | 34.9 | 15.56 | |
| 7 | 246 | 75% | 2% | 23% | 117 | 2.10 | |
| 8 | 498 | 17% | 1% | 82% | 199 | 2.50 | |
| 9 | 124 | 54% | 4% | 41% | 41.1 | 3.02 | |
| 10 | 102 | 35% | 0 | 65% | 30.0 | 3.40 | |
| 11 | 585 | 57% | 15% | 25% | 81.9 | 7.14 | |
| 12 | 482 | 9% | 75% | 16% | 65.4 | 7.37 | |
| 13 | 347 | 67% | 19% | 12% | 63.7 | 5.45 | |
| 14 | 321 | 68% | 0 | 32% | 60.9 | 5.27 | |
| 15 | 261 | 48% | 21% | 31% | 46.2 | 5.65 | |
| 16 | 166 | 45% | 47% | 8% | 45.6 | 3.64 | |
| 17 | 148 | 89% | 0 | 10% | 38.5 | 3.84 | |
| 18 | 136 | 2% | 38% | 60% | 9.5 | 14.3 | |
| 19 | 119 | 2% | 0 | 98% | 5.0 | 23.8 | |
| 20 | 115 | 81% | 4% | 14% | 16.8 | 6.85 | |
| 21 | 88.9 | 35% | 48% | 14% | 11.1 | 8.01 | |
| 22 | 84.9 | 26% | 33% | 41% | 5.4 | 15.7 | |
| 23 | 207 | 73% | 0 | 27% | 74.9 | 2.76 | |
| 24 | 93.7 | 100% | 0 | 0 | 9.2 | 10.18 | |
| 25 | 517 | 70% | 28% | 2% | 50 | 10.3 | |
| 26 | 241 | 79% | 16% | 5% | 23.4 | 10.3 | |
| 27 | 186 | 94% | 1% | 5% | 80.8 | 2.30 | |
| 28 | 181 | 89% | 0 | 11% | 247 | 0.733 | |
| 29 | 169 | 95% | 0 | 5% | 67.7 | 2.50 | |
| 30 | 126 | 84% | 0 | 16% | 29.2 | 4.32 | |
| 31 | 104 | 60% | 0 | 40% | 93.4 | 1.11 | |
| 32 | 85.4 | 88% | 0 | 12% | 16.8 | 5.08 | |
| 33 | 80.1 | 64% | 6% | 29% | 179 | 0.447 | |
| 34 | 236 | 89% | 0 | 9% | 23.1 | 10.2 | |
| 35 | 240 | 83% | 5% | 12% | 52.3 | 4.59 | |
| 36 | 146 | 88% | 0 | 12% | 80.7 | 1.81 | |
| - | 0.018 | 0 | 0 | 100% | 0.35 | 55 |
Consumption per head
Total consumption (2nd column) divided by number of inhabitants (last column) gives a country's consumption per head. In W-Europe this is between 5 and 8 MWh/a. (1 MWh equals 1000 kWh.) In Scandinavia, USA, Canada, Taiwan and South Korea it is much more, in developing countries much less. The worlds average is 3 MWh/a. A very low consumption per head, as in Indonesia, means that many inhabitants are not connected to the electricity grid, and this is the reason that the world's 7th and 8th most populous countries—Nigeria (177M) and Bangladesh (156M)—do not appear in the table.
2012–2014
From 2012 to 2014 worldwide electricity consumption increased 5%. Nuclear and fossil generated electricity rose 3%, renewable electricity 12%.
A small part of the renewables, solar and wind electricity, increased much more, 46%[8] in line with the strong growth since 1990.[9]
In Brazil, wind power increased 140%, in China not only solar and wind increased fast, 81%, but also nuclear, 36%.
Electricity generation and GDP (2009)
Listed countries are top 20 populous countries and/or top 20 GDP (PPP) countries and Saudi Arabia as of CIA World Factbook 2009.
30 countries (exclude EU/IEA) in this table represent 77% of world population, 84% of world GDP, 83% of world electricity generation.
Productivity per Electricity generation (concept similar to Energy intensity) can be measured by dividing GDP amount by the electricity generated. World average was $3.5 production/kWh.
Electricity generation include Final consumption, in process consumption, and losses.
| Country | Population million |
rank* | GDP (PPP) billion USD |
rank* | GDP (PPP) per capita |
rank* | Electricity generation (GWh/yr) |
rank** | daily kWh per capita |
rank** | GDP (PPP) /kWh* |
|---|---|---|---|---|---|---|---|---|---|---|---|
| 1,339 | 1 | $7,992 | 2 | $5,969 | 133 | 3,444,108 | 2 | 7.04 | 17 | $2.3 | |
| 1,166 | 2 | $3,304 | 4 | $2,834 | 166 | 860,723 | 5 | 2.02 | 23 | $3.8 | |
| 307 | 3 | $14,440 | 1 | $47,036 | 11 | 4,401,698 | 1 | 39.25 | 2 | $3.3 | |
| 541 | — | $16,221 | — | $29,983 | — | 3,635,604 | — | 18.40 | — | $4.5 | |
| 240 | 4 | $917 | 15 | $3,821 | 158 | 149,437 | 20 | 1.70 | 24 | $6.1 | |
| 199 | 5 | $1,998 | 9 | $10,040 | 102 | 505,083 | 9 | 6.95 | 18 | $4.0 | |
| 176 | 6 | $431 | 27 | $2,449 | 172 | 91,626 | 24 | 1.43 | 26 | $4.7 | |
| 156 | 7 | $226 | 49 | $1,449 | 196 | 35,893 | 27 | 0.63 | 27 | $6.3 | |
| 149 | 8 | $336 | 35 | $2,255 | 176 | 21,110 | 28 | 0.39 | 28 | $15.9 | |
| 140 | 9 | $2,271 | 6 | $16,221 | 72 | 1,022,726 | 4 | 20.00 | 10 | $2.2 | |
| 127 | 10 | $4,340 | 3 | $34,173 | 36 | 1,083,142 | 3 | 23.35 | 6 | $4.0 | |
| 111 | 11 | $1,567 | 11 | $14,117 | 77 | 257,812 | 14 | 6.36 | 19 | $6.1 | |
| 98 | 12 | $318 | 37 | $3,425 | 162 | 60,819 | 26 | 1.70 | 25 | $5.2 | |
| 87 | 13 | $242 | 45 | $2,782 | 167 | 76,269 | 25 | 2.40 | 22 | $3.2 | |
| 85 | 14 | $70 | 78 | $824 | 216 | 3,777 | 30 | 0.12 | 30 | $18.5 | |
| 83 | 15 | $445 | 26 | $5,361 | 135 | 130,144 | 22 | 4.29 | 21 | $3.4 | |
| 82 | 16 | $2,925 | 5 | $35,671 | 33 | 617,132 | 7 | 20.61 | 8 | $4.7 | |
| 77 | 17 | $904 | 16 | $11,740 | 92 | 198,085 | 19 | 7.04 | 16 | $4.6 | |
| 69 | 18 | $21 | 120 | $304 | 226 | 6,939 | 29 | 0.28 | 29 | $3.0 | |
| 75 | 19 | $844 | 17 | $12,788 | 86 | 211,972 | 17 | 8.79 | 15 | $4.0 | |
| 66 | 20 | $549 | 24 | $8,318 | 115 | 149,034 | 21 | 6.18 | 20 | $3.7 | |
| 64 | 21 | $2,133 | 8 | $33,328 | 38 | 526,862 | 8 | 22.54 | 7 | $4.0 | |
| 61 | 22 | $2,236 | 7 | $36,656 | 30 | 400,390 | 11 | 17.97 | 13 | $5.6 | |
| 58 | 23 | $1,827 | 10 | $31,500 | 41 | 359,161 | 12 | 16.95 | 14 | $5.1 | |
| 49 | 25 | $1,338 | 13 | $27,306 | 49 | 443,888 | 10 | 24.80 | 5 | $3.0 | |
| 41 | 32 | $1,402 | 12 | $34,195 | 35 | 303,179 | 13 | 20.25 | 9 | $4.6 | |
| 33 | 37 | $1,303 | 14 | $39,485 | 22 | 620,684 | 6 | 51.50 | 1 | $2.1 | |
| 29 | 41 | $578 | 22 | $19,931 | 59 | 204,200 | 18 | 19.28 | 12 | $2.8 | |
| 23 | 49 | $714 | 19 | $31,043 | 42 | 238,458 | 16 | 28.39 | 4 | $3.0 | |
| 21 | 54 | $803 | 18 | $38,238 | 25 | 257,247 | 15 | 33.54 | 3 | $3.1 | |
| 17 | 59 | $674 | 20 | $39,647 | 20 | 123,496 | 23 | 19.89 | 11 | $5.66 | |
| World | 6,784 | — | $70,048 | — | $10,325 | — | 20,279,640 | — | 8.18 | — | $3.5 |
| |||||||||||
Electricity final consumption by categories (2008)
About 17% of total electricity production is consumed by in-processes, such as self-consumption of power plants, grid losses and storage losses. In 2008, total electricity generation accounted for 20,261 TWh (20.26 PWh), while 3,464 TWh (3.46 PWh) were self-consumption and losses and 16,816 TWh (16.82 PWh) went to final consumption.[10]
In the consumption rate in Industry, China is highest with 67.8%, South Korea is 51.0% (7th), Germany 46.1% (11th), Japan 31.5% (26th), USA 24.0% (28th) In the Commercial and Public Service, Japan is highest with 36.4%, USA 35.6% (3rd), China 5.4% (29th). For Domestic usage, Saudi Arabia is highest with 56.9%, USA 36.2% (8th), Japan 29.8% (16th), China 15.5% (29th), Korea 13.8% (30th).
Definition
- Industry: iron and steel, chemical and petrochemical, non-ferrous metals, non-metallic minerals, transport equipment, machinery, mining, Food and tobacco, Paper, pulp and print, wood and wood product, construction, textile and leather, non-specified.
- Transport: domestic aviation, Land transportation, Rail, Pipeline transport, domestic navigation, non-specified. note international marine and aviation bunkers are not included.
- Fishery: some country include fishing with agriculture or forestry.
| Country/ Geographical Region | Total (TWh) |
Industry | Transport | Commercial /Public Services |
Agriculture /Forestry |
Fishery | Residential | other |
|---|---|---|---|---|---|---|---|---|
| 2,842 | 67.8% | 1.05% | 5.4% | 3.12% | 0.000% | 15.5% | 7.19% | |
| 602 | 46.4% | 1.93% | 8.0% | 17.92% | 0.000% | 20.7% | 5.05% | |
| 3,814 | 24.0% | 0.20% | 35.0% | 0.00% | 0.000% | 36.2% | 4.59% | |
| 129 | 37.2% | 0.00% | 23.9% | 0.00% | 0.000% | 38.9% | 0.00% | |
| 410 | 48.1% | 0.39% | 23.7% | 4.49% | 0.000% | 23.3% | 0.00% | |
| 70 | 27.5% | 0.01% | 14.2% | 12.50% | 0.000% | 45.9% | 0.00% | |
| 32 | 56.3% | 0.00% | 6.0% | 3.37% | 0.000% | 32.9% | 0.00% | |
| 19 | 20.0% | 0.00% | 24.7% | 0.00% | 0.000% | 55.3% | 0.00% | |
| 725 | 49.6% | 11.45% | 20.6% | 2.14% | 0.037% | 16.1% | 0.00% | |
| 964 | 31.5% | 1.95% | 36.4% | 0.09% | 0.000% | 29.8% | 0.23% | |
| 200 | 61.3% | 0.55% | 10.3% | 4.05% | 0.000% | 23.7% | 0.00% | |
| 49 | 34.6% | 0.23% | 28.7% | 2.30% | 0.311% | 33.8% | 0.00% | |
| 68 | 51.8% | 0.75% | 8.1% | 0.97% | 0.000% | 38.4% | 0.00% | |
| 3.1 | 38.0% | 0.00% | 23.6% | 0.00% | 0.000% | 37.7% | 0.74% | |
| 112 | 33.4% | 0.00% | 15.4% | 4.13% | 0.000% | 39.2% | 7.84% | |
| 526 | 46.1% | 3.14% | 22.6% | 1.66% | 0.000% | 26.5% | 0.00% | |
| 159 | 45.4% | 0.60% | 25.6% | 3.54% | 0.102% | 24.8% | 0.00% | |
| 6.1 | 63.4% | 0.00% | 3.1% | 0.00% | 0.000% | 33.5% | 0.00% | |
| 164 | 33.2% | 0.15% | 19.0% | 12.92% | 0.001% | 32.3% | 2.50% | |
| 135 | 42.4% | 0.04% | 35.6% | 0.21% | 0.000% | 21.3% | 0.54% | |
| 433 | 32.6% | 3.06% | 25.0% | 0.88% | 0.028% | 35.9% | 2.57% | |
| 342 | 33.2% | 2.47% | 28.6% | 1.19% | 0.000% | 34.5% | 0.00% | |
| 309 | 45.8% | 3.50% | 26.8% | 1.81% | 0.022% | 22.1% | 0.00% | |
| 407 | 51.0% | 0.55% | 32.5% | 1.61% | 0.449% | 13.8% | 0.00% | |
| 265 | 38.9% | 1.10% | 29.5% | 2.29% | 0.000% | 27.1% | 1.08% | |
| 519 | 36.3% | 0.81% | 30.0% | 1.86% | 0.000% | 31.0% | 0.00% | |
| 170 | 12.4% | 0.00% | 28.5% | 2.04% | 0.000% | 56.9% | 0.14% | |
| 210 | 55.7% | 0.52% | 13.7% | 0.78% | 0.459% | 20.3% | 8.48% | |
| 212 | 44.7% | 1.33% | 25.6% | 0.88% | 0.000% | 27.4% | 0.00% | |
| 109 | 38.6% | 1.48% | 30.0% | 7.15% | 0.000% | 22.7% | 0.00% | |
| World | 16,816 | 41.7% | 1.60% | 23.4% | 2.50% | 0.025% | 27.4% | 3.43% |
Notes:
| ||||||||
Electricity consumption of OECD member countries (2008)
Electric energy consumption per inhabitant by primary energy source in some countries and areas in 2008 is in the table.
For the OECD with 8 991 kWh/yr/person: 1.026 watt/person.
| Electric energy per capita for 2008, in kilowatt-hour per person[12] | ||||||||||
|---|---|---|---|---|---|---|---|---|---|---|
| # | Territory | Use | Production | Import/ Export |
Non-RE* | RE % * | ||||
| Total | Fossil | Nuclear | RE-Bio | Bio+waste | ||||||
| 1 | Iceland | 53,129 | 53,129 | 0 | 0 | 53,129 | 0 | 0 | 0 | 100% |
| 2 | Norway | 27,398 | 30,355 | 151 | 0 | 30,130 | 74 | -2,957 | -2,806 | 110.2% |
| 3 | Canada | 18,111 | 19,092 | 4,653 | 2,834 | 11,333 | 272 | -981 | 6,507 | 64.1% |
| 4 | Finland* | 17,036 | 14,612 | 5,182 | 4,345x | 3,356 | 1,727 | 2,424 | 11,953 | 29.8% |
| 5 | Sweden | 16,018 | 16,225 | 527 | 6,922 | 7,687 | 1,088 | -206 | 7,244 | 54.8% |
| 6 | USA | 14,378 | 14,270 | 10,162 | 2,746 | 1,139 | 224 | 108 | 13,015 | 9.5% |
| 7 | Switzerland | 9,052 | 9,198 | 130 | 3,688 | 5,057 | 322 | -146 | 3,672 | 59.4% |
| 8 | OECD | 8,991 | 8,982 | 5,554 | 1,905 | 1,340 | 182 | 9 | 7,468 | 16.9% |
| 9 | Belgium | 8,961 | 7,962 | 2,997 | 4,295 | 252 | 418 | 999 | 8,291 | 7.5% |
| 10 | Japan | 8,507 | 8,507 | 5,669 | 2,010 | 682 | 147 | 0 | 7,679 | 9.7% |
| 11 | France | 8,233 | 8,984 | 853 | 6,872 | 1,168 | 91 | -751 | 6,974 | 15.3% |
| 12 | Netherlands | 7,463 | 6,513 | 5,590 | 252 | 275 | 396 | 950 | 6,792 | 9.0% |
| 13 | Germany | 7,450 | 7,693 | 4,635 | 1,804 | 873 | 381 | -243 | 6,196 | 6.8% |
| 14 | EU-15 | 7,409 | 7,321 | 3,798 | 2,121 | 1,141 | 261 | 89 | 6,007 | 18.9% |
| 15 | Denmark | 6,912 | 6,656 | 4,680 | 0 | 1,272 | 706 | 256 | 4,934 | 28.6% |
| 16 | United Kingdom | 6,573 | 6,392 | 5,069 | 860 | 266 | 198 | 180 | 6,108 | 7.1% |
| 17 | Spain | 6,523 | 6,764 | 4,066 | 1,286 | 1,318 | 94 | -241 | 5,111 | 21.6% |
| 18 | Italy | 6,054 | 5,384 | 4,271 | 0 | 992 | 120 | 671 | 4,942 | 18.4% |
| 19 | Poland | 4,033 | 4,064 | 3,865 | 0 | 96 | 103 | -32 | 3,833 | 5.0% |
| ||||||||||
World electricity consumption and production (2017 and 2018)
In a recent report[13], the IEA reported a total worlds electric energy consumption in 2017 of 21,372 TWh, which is an increase of 2.6% in comparison to 2016. The electric energy consumption of the OECD countries in 2017 was 9,518 TWh and thus about 0.2% higher than in 2016. This compares to a power production in the OECD countries of 11,051 TWh in 2017, and to 11,173 TWh in 2018. The electric power consumption of the non-OECD countries in 2017 amounts to 11,854 TWh. An increase of 4.6% over the year 2016. The share of the gross electric production by source is summarized in the following table for the available assessment in the years 2017 or 2018.
| Rank | Region | Year | Total (TWh) | Fossil | Nuclear | Renewable |
|---|---|---|---|---|---|---|
| — | WORLD | 2017 | 21,372 | 64.5% | 10.2% | 25.3% |
| 1 | non-OECD | 2017 | 11,854 | 70.8% | 4.6% | 24.6% |
| 2 | OECD | 2018 | 9,518 | 55.3% | 17.7% | 27.0% |
Electricity scenarios until 2040
In all scenarios, increasing efficiency will result in less electricity needed for a given demand of power and light. But demand will increase strongly on account of
- growing economy in developing countries and
- electrification of transport and heating. Combustion engines are replaced by electric drive and for heating less gas and oil, but more electricity is used, if possible with heat pumps.
As transport and heating become more climate-friendly, the environmental effect of energy consumption will be more determined by electricity. This is mainly supplied by burning fossil fuel which disturbs the natural carbon cycle. The scenarios arrive at very different results for the environment.
The International Energy Agency expects revision of subsidy for fossil fuel which amounted to 550 billion dollar in 2013, more than four times renewable energy subsidy. In this scenario[14] almost half of the increase in 2040 of electricity consumption is covered by more than 80% growth of renewable energy. Many new nuclear plants will be constructed, mainly to replace old ones. The nuclear part of electricity generation will increase from 11 to 12%. The renewable part goes up much, from 21 to 33%. The IEA warns that in order to restrict global warming to 2 °C, the carbon dioxide emission[15] must not exceed 1000 gigaton (Gt) from 2014. This limit is reached in 2040 and emissions will not drop to zero ever.
The World Energy Council[16] sees world electricity consumption increasing to more than 40,000 TWh/a in 2040. The fossil part of generation depends on energy policy. It can stay around 70% in the so-called Jazz scenario where countries rather independently "improvise" but it can also decrease to around 40% in the Symphony scenario if countries work "orchestrated" for more climate friendly policy. Carbon dioxide emission, 32 Gt/a in 2012, will increase to 46 Gt/a in Jazz but decrease to 26 Gt/a in Symphony. Accordingly, until 2040 the renewable part of generation will stay at about 20% in Jazz but increase to about 45% in Symphony.
See also
- Electricity generation
- Electricity retailing
- List of countries by electric energy consumption
- List of countries by electricity production
- List of countries by energy consumption and production
- List of countries by energy consumption per capita
- List of countries by total primary energy consumption and production
- List of countries by energy intensity
- List of countries by carbon dioxide emissions
- List of countries by greenhouse gas emissions
- List of countries by renewable electricity production
- World energy consumption
- Worldwide energy supply
References
- "Electricity generation by source". International Energy Agency.
- "Electricity Generation". Institute for Energy Research. Institute for Energy Research. 2 September 2014. Retrieved 27 October 2015.
- Zahedi, Gholamreza; Azizi, Saeed; Bahadori, Alireza; Elkamel, Ali; R. Wan Alwi, Sharifah (2013). "Electricity demand estimation using an adaptive neuro-fuzzy network: A case study from the Ontario province – Canada". Energy. 49: 323–328. doi:10.1016/j.energy.2012.10.019.
- Enerdata Statistical Review 2012
- IEA World energy statistics
- IEA Statistics search
- 25% before the Fukushima Daiichi nuclear disaster
- Compare World: IEA Statistics search, World, Electricity and Heat, 2012 and 2014.
- IEA Key Renewables Trends
- IEA/OECD IEA Statistics/Electricity and Heat by country
- World Electricity production 2012
- Energiläget i siffror 2009 Archived January 20, 2011, at the Wayback Machine Energimyndigheten Sweden, Table 25: Specific electricity production per inhabitant with breakdown by power source, 2008, kWh/person, Source: Electricity information 2009 IEA/OECD
- "Electricity Information 2019" (PDF). IEA.org. Retrieved 1 June 2020. External link in
|publisher=(help) - IEA World energy outlook
- by fossil fuel
- World energy scenarios
External links
- World Electricity production 2012
- World Map and Chart of Energy Consumption by country by Lebanese-economy-forum, World Bank data
- Electricity Information 2019 - IEA