Detrended correspondence analysis
Detrended correspondence analysis (DCA) is a multivariate statistical technique widely used by ecologists to find the main factors or gradients in large, species-rich but usually sparse data matrices that typify ecological community data. DCA is frequently used to suppress artifacts inherent in most other multivariate analyses when applied to gradient data.[1]
History
DCA was created in 1979 by Mark Hill of the United Kingdom's Institute for Terrestrial Ecology (now merged into Centre for Ecology and Hydrology) and implemented in FORTRAN code package called DECORANA (Detrended Correspondence Analysis), a correspondence analysis method. DCA is sometimes erroneously referred to as DECORANA; however, DCA is the underlying algorithm, while DECORANA is a tool implementing it.
Issues addressed
According to Hill and Gauch,[2] DCA suppresses two artifacts inherent in most other multivariate analyses when applied to gradient data. An example is a time-series of plant species colonising a new habitat; early successional species are replaced by mid-successional species, then by late successional ones (see example below). When such data are analysed by a standard ordination such as a correspondence analysis:
- the ordination scores of the samples will exhibit the 'edge effect', i.e. the variance of the scores at the beginning and the end of a regular succession of species will be considerably smaller than that in the middle,
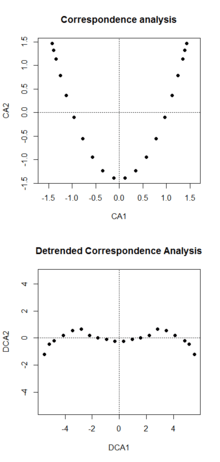
- when presented as a graph the points will be seen to follow a horseshoe shaped curve rather than a straight line ('arch effect'), even though the process under analysis is a steady and continuous change that human intuition would prefer to see as a linear trend.
Outside ecology, the same artifacts occur when gradient data are analysed (e.g. soil properties along a transect running between 2 different geologies, or behavioural data over the lifespan of an individual) because the curved projection is an accurate representation of the shape of the data in multivariate space.
Ter Braak and Prentice (1987, p. 121) cite a simulation study analysing two-dimensional species packing models resulting in a better performance of DCA compared to CA.
Method
DCA is an iterative algorithm that has shown itself to be a highly reliable and useful tool for data exploration and summary in community ecology (Shaw 2003). It starts by running a standard ordination (CA or reciprocal averaging) on the data, to produce the initial horse-shoe curve in which the 1st ordination axis distorts into the 2nd axis. It then divides the first axis into segments (default = 26), and rescales each segment to have mean value of zero on the 2nd axis - this effectively squashes the curve flat. It also rescales the axis so that the ends are no longer compressed relative to the middle, so that 1 DCA unit approximates to the same rate of turnover all the way through the data: the rule of thumb is that 4 DCA units mean that there has been a total turnover in the community. Ter Braak and Prentice (1987, p. 122) warn against the non-linear rescaling of the axes due to robustness issues and recommend using detrending-by-polynomials only.
Drawbacks
No significance tests are available with DCA, although there is a constrained (canonical) version called DCCA in which the axes are forced by Multiple linear regression to correlate optimally with a linear combination of other (usually environmental) variables; this allows testing of a null model by Monte-Carlo permutation analysis.
Example
The example shows an ideal data set: The species data is in rows, samples in columns. For each sample along the gradient, a new species is introduced but another species is no longer present. The result is a sparse matrix. Ones indicate the presence of a species in a sample. Except at the edges each sample contains five species.
| 1 | 2 | 3 | 4 | 5 | 6 | 7 | 8 | 9 | 10 | 11 | 12 | 13 | 14 | 15 | 16 | 17 | 18 | 19 | 20 | |
|---|---|---|---|---|---|---|---|---|---|---|---|---|---|---|---|---|---|---|---|---|
| SP1 | 1 | 1 | 1 | 0 | 0 | 0 | 0 | 0 | 0 | 0 | 0 | 0 | 0 | 0 | 0 | 0 | 0 | 0 | 0 | 0 |
| SP2 | 1 | 1 | 1 | 1 | 0 | 0 | 0 | 0 | 0 | 0 | 0 | 0 | 0 | 0 | 0 | 0 | 0 | 0 | 0 | 0 |
| SP3 | 1 | 1 | 1 | 1 | 1 | 0 | 0 | 0 | 0 | 0 | 0 | 0 | 0 | 0 | 0 | 0 | 0 | 0 | 0 | 0 |
| SP4 | 0 | 1 | 1 | 1 | 1 | 1 | 0 | 0 | 0 | 0 | 0 | 0 | 0 | 0 | 0 | 0 | 0 | 0 | 0 | 0 |
| SP5 | 0 | 0 | 1 | 1 | 1 | 1 | 1 | 0 | 0 | 0 | 0 | 0 | 0 | 0 | 0 | 0 | 0 | 0 | 0 | 0 |
| SP6 | 0 | 0 | 0 | 1 | 1 | 1 | 1 | 1 | 0 | 0 | 0 | 0 | 0 | 0 | 0 | 0 | 0 | 0 | 0 | 0 |
| SP7 | 0 | 0 | 0 | 0 | 1 | 1 | 1 | 1 | 1 | 0 | 0 | 0 | 0 | 0 | 0 | 0 | 0 | 0 | 0 | 0 |
| SP8 | 0 | 0 | 0 | 0 | 0 | 1 | 1 | 1 | 1 | 1 | 0 | 0 | 0 | 0 | 0 | 0 | 0 | 0 | 0 | 0 |
| SP9 | 0 | 0 | 0 | 0 | 0 | 0 | 1 | 1 | 1 | 1 | 1 | 0 | 0 | 0 | 0 | 0 | 0 | 0 | 0 | 0 |
| SP10 | 0 | 0 | 0 | 0 | 0 | 0 | 0 | 1 | 1 | 1 | 1 | 1 | 0 | 0 | 0 | 0 | 0 | 0 | 0 | 0 |
| SP11 | 0 | 0 | 0 | 0 | 0 | 0 | 0 | 0 | 1 | 1 | 1 | 1 | 1 | 0 | 0 | 0 | 0 | 0 | 0 | 0 |
| SP12 | 0 | 0 | 0 | 0 | 0 | 0 | 0 | 0 | 0 | 1 | 1 | 1 | 1 | 1 | 0 | 0 | 0 | 0 | 0 | 0 |
| SP13 | 0 | 0 | 0 | 0 | 0 | 0 | 0 | 0 | 0 | 0 | 1 | 1 | 1 | 1 | 1 | 0 | 0 | 0 | 0 | 0 |
| SP14 | 0 | 0 | 0 | 0 | 0 | 0 | 0 | 0 | 0 | 0 | 0 | 1 | 1 | 1 | 1 | 1 | 0 | 0 | 0 | 0 |
| SP15 | 0 | 0 | 0 | 0 | 0 | 0 | 0 | 0 | 0 | 0 | 0 | 0 | 1 | 1 | 1 | 1 | 1 | 0 | 0 | 0 |
| SP16 | 0 | 0 | 0 | 0 | 0 | 0 | 0 | 0 | 0 | 0 | 0 | 0 | 0 | 1 | 1 | 1 | 1 | 1 | 0 | 0 |
| SP17 | 0 | 0 | 0 | 0 | 0 | 0 | 0 | 0 | 0 | 0 | 0 | 0 | 0 | 0 | 1 | 1 | 1 | 1 | 1 | 0 |
| SP18 | 0 | 0 | 0 | 0 | 0 | 0 | 0 | 0 | 0 | 0 | 0 | 0 | 0 | 0 | 0 | 1 | 1 | 1 | 1 | 1 |
| SP19 | 0 | 0 | 0 | 0 | 0 | 0 | 0 | 0 | 0 | 0 | 0 | 0 | 0 | 0 | 0 | 0 | 1 | 1 | 1 | 1 |
| SP20 | 0 | 0 | 0 | 0 | 0 | 0 | 0 | 0 | 0 | 0 | 0 | 0 | 0 | 0 | 0 | 0 | 0 | 1 | 1 | 1 |
The plot of the first two axes of the correspondence analysis result on the right hand side clearly shows the disadvantages of this procedure: the edge effect, i.e. the points are clustered at the edges of the first axis, and the arch effect.
See also
- Eigenanalysis
- Ordination (statistics)
- Seriation (archaeology) – including additional examples for the arch effect
- Principal Component Analysis
References
- Hill and Gauch (1980)
- Hill and Gauch (1980)
- Hill, M.O. (1979). DECORANA — A FORTRAN program for Detrended Correspondence Analysis and Reciprocal Averaging. Section of Ecology and Systematics, Cornell University, Ithaca, New York, 52pp.
- Hill, M.O. and Gauch, H.G. (1980). Detrended Correspondence Analysis: An Improved Ordination Technique. Vegetatio 42, 47–58.
- Oksanen J and Minchin PR (1997). Instability of ordination results under changes in input data order: explanation and remedies. Journal of vegetation science 8, 447–454
- Shaw PJA (2003). Multivariate Statistics for the Environmental Sciences. London: Hodder Arnold
- Ter Braak, C.J.F. and Prentice, I.C. (1988). A Theory of Gradient Analysis. Advances in Ecological Research 18, 271–371. ISBN 0-12-013918-9. Reprinted in: Ter Braak, C.J.F. (1987). Unimodal models to relate species to environment. Wageningen: PhD thesis Agricultural Mathematics Group, 101–146.
External links
- PAST (PAlaeontological STatistics) — free software including DCA with modifications according to Oksanen and Minchin (1997)
- WINBASP — free software including DCA with detrending-by-polynomials according to Ter Braak and Prentice (1988)
- vegan: Community Ecology Package for R — free software including the function decorana: Detrended Correspondence Analysis and Basic Reciprocal Averaging from Hill and Gauch (1980)