Climate of Europe
Most of Western Europe has an Oceanic climate, in the Köppen climate classification. Oceanic climates normally feature cool summers, cool winters, and frequent overcast skies in fall, winter, and early spring. Far southern Europe has a Mediterranean climate, which features warmer to hot summers, less annual rainfall, and frequent sunny skies. Central-eastern Europe is classified as having a Continental climate, which features hot summers, cold winters, and large annual ranges of temperatures. The climate of western Europe is strongly conditioned by the Gulf Stream, which keeps mild air (for the latitude) over Northwestern Europe in the winter months, especially in Ireland, the UK and coastal Norway.
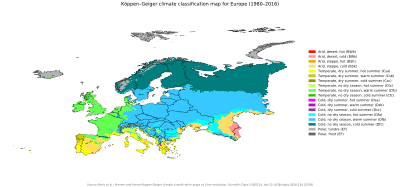
Parts of the central European plains have a hybrid oceanic/continental climate. Four seasons occur in most of Europe away from the Mediterranean. The coastal lowlands near and on the Mediterranean Sea, have more of a wet and dry season pattern, with winter the season of most rainfall, and summers a time of few rainy days.
Gulf Stream
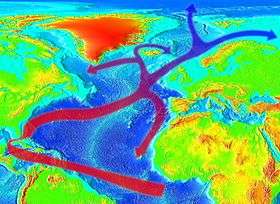

The climate of Western Europe is milder in comparison to other areas of the same latitude around the globe due to the influence of the Gulf Stream. The Mediterranean's waters are not as deep as the large oceans, allowing it to become a heat store tempering winters along its coastlines.[2] The Gulf Stream is nicknamed "Europe's central heating", because it makes Europe's climate warmer and wetter than it would otherwise be.
Compared to areas located in the higher middle latitudes, parts of western Europe have mild winters and higher annual temperatures (though summers are cooler than locations at the same latitude). Berlin, Germany; Calgary, Canada; and Irkutsk, in the Asian part of Russia, lie on around the same latitude; January temperatures in Berlin average around 8 °C (15 °F) higher than those in Calgary (although Calgary sits 1200m higher in altitude), and they are almost 22 °C (40 °F) higher than average temperatures in Irkutsk.[2]
This difference is even larger on the northern part of the continent. The January average in Brønnøysund, Norway,[3] is almost 15 °C warmer than the January average in Nome, Alaska,[4] both towns are situated upwind on the west coast of the continents at 65°N, and as much as 42 °C warmer than the January average in Yakutsk which is actually slightly further south. Further south the oceanic climate of Europe compares thermally to North America, at around 48°N Rennes, France has about an equal average temperature throughout the year to Seattle, Washington, although the latter has drier summers with much wetter winters.[5]
Temperature
Most of Europe sees seasonal temperatures consistent with temperate climates in other parts of the world, though summers north of the Mediterranean Sea are cooler than most temperate climates experience in summer. Among the cities with a population over 100,000 people in Europe, the coldest winters are mostly found in Russia, with daily highs in winter averaging 0 C (32 F), while the mildest winters in the continent are in coastal southern Spain and the southernmost coast of Crete.
Almería, Málaga, Cádiz, Algeciras and Ierapetra average over 12 °C (54 °F) in January with 16–20 °C (61–68 °F) during the day. The hottest summers of the continent occur in cities and towns of the hinterland of southern Spain: July average highs in this region are 36.2 °C (97.2 °F) in Seville and 36.9 °C (98.4 °F) in Cordoba.
| Jan | Feb | Mar | Apr | May | Jun | Jul | Aug | Sep | Oct | Nov | Dec | Year | |
|---|---|---|---|---|---|---|---|---|---|---|---|---|---|
| Helsinki[6] | −1.3 | −1.9 | 1.6 | 7.6 | 14.4 | 18.5 | 21.5 | 19.8 | 14.6 | 9.0 | 3.7 | 0.5 | 9.0 |
| Minsk[7] | −2.1 | −1.4 | 3.8 | 12.2 | 18.7 | 21.5 | 23.6 | 22.8 | 16.7 | 10.2 | 2.9 | −1.2 | 10.8 |
| Budapest[8] | 1.2 | 4.5 | 10.2 | 16.3 | 21.4 | 24.4 | 26.5 | 26.0 | 22.1 | 16.1 | 8.1 | 3.1 | 15.0 |
| London[9] | 8.1 | 8.6 | 11.6 | 14.6 | 18.1 | 21.0 | 23.4 | 23.1 | 20.0 | 15.5 | 11.3 | 8.4 | 15.3 |
| Paris[10] | 6.9 | 8.2 | 11.8 | 14.7 | 19.0 | 21.8 | 24.4 | 24.6 | 20.8 | 15.8 | 10.4 | 7.8 | 15.5 |
| Bucharest[11] | 1.5 | 4.1 | 10.2 | 18.0 | 23.3 | 26.8 | 28.8 | 28.5 | 24.6 | 18.0 | 10.0 | 3.8 | 16.5 |
| Rome[12] | 14.0 | 15.1 | 18.3 | 21.1 | 25.9 | 29.6 | 32.3 | 32.5 | 27.2 | 23.0 | 18.1 | 15.3 | 22.4 |
| Barcelona[13][14] | 13.9 | 14.3 | 16.4 | 18.9 | 22.5 | 26.1 | 28.6 | 29.0 | 26.0 | 22.5 | 17.1 | 14.5 | 20.6 |
| Lisbon[15] | 14.8 | 16.2 | 18.8 | 19.8 | 22.1 | 25.7 | 27.9 | 28.3 | 26.5 | 22.5 | 18.2 | 15.3 | 21.5 |
| Malta[16] | 15.6 | 15.6 | 17.3 | 19.8 | 24.1 | 28.6 | 31.5 | 31.8 | 28.5 | 25.0 | 20.7 | 17.1 | 23.0 |
| Málaga[17] | 16.8 | 17.7 | 19.6 | 21.4 | 24.3 | 28.1 | 30.5 | 30.8 | 28.2 | 24.1 | 20.1 | 17.5 | 23.3 |
| Athens[18] | 13.4 | 14.3 | 17.1 | 21.2 | 26.6 | 31.7 | 34.4 | 34.3 | 29.7 | 24.1 | 18.7 | 14.4 | 23.3 |
| Jan | Feb | Mar | Apr | May | Jun | Jul | Aug | Sep | Oct | Nov | Dec | |
|---|---|---|---|---|---|---|---|---|---|---|---|---|
| Gdańsk | 4 | 3 | 3 | 4 | 8 | 13 | 16 | 18 | 15 | 12 | 9 | 6 |
| Brighton | 9 | 8 | 8 | 9 | 11 | 13 | 15 | 17 | 17 | 16 | 13 | 11 |
| Marseille | 13 | 13 | 13 | 14 | 16 | 18 | 21 | 22 | 21 | 18 | 16 | 14 |
| Lisbon | 15 | 15 | 15 | 16 | 17 | 18 | 19 | 20 | 20 | 19 | 18 | 17 |
| Barcelona | 13 | 13 | 13 | 14 | 17 | 20 | 23 | 25 | 23 | 20 | 17 | 15 |
| Rome | 16 | 15 | 16 | 17 | 20 | 22 | 26 | 27 | 25 | 21 | 19 | 16 |
| Athens | 16 | 15 | 15 | 16 | 18 | 21 | 24 | 24 | 24 | 21 | 19 | 17 |
| Naples | 16 | 15 | 16 | 18 | 20 | 23 | 27 | 28 | 26 | 23 | 20 | 17 |
| Valencia | 14 | 14 | 14 | 16 | 19 | 23 | 25 | 26 | 25 | 22 | 19 | 16 |
| Málaga | 16 | 16 | 16 | 17 | 18 | 21 | 23 | 24 | 22 | 20 | 18 | 17 |
| Malta | 16 | 16 | 15 | 16 | 18 | 21 | 24 | 26 | 25 | 23 | 21 | 18 |
Tornadoes
The Netherlands has the highest average number of recorded tornadoes per area of any country in the world (more than 20, or 0.0005 per km2), annually), followed by the UK (around 33, or 0.0001 per km2), per year),[19][20] but most are small and cause minor damage. In absolute number of events, ignoring area, the UK experiences more tornadoes than any other European country, excluding waterspouts.[21] Europe uses its own tornado scale, known as the TORRO scale, which ranges from a T0 for extremely weak tornadoes to T11 for the most powerful known tornadoes.[22]
Climate change
.png)
Climate change in Europe describes the climate change related issues in Europe. This includes the climate politics, contribution in the global warming and the influence of the global warming in Europe. According to international climate experts global temperature rise should not exceed 2 °C to prevent the most dangerous consequences of the climate change.[24] It was also made essential to halve greenhouse gases such as carbon dioxide by 2050 compared to the 1990 levels. Other countries such as Brazil and China will also reduce emissions by between 80% and 95% by 2050. It is estimated that from the now living persons alive are 70% in the year 2050. Emission reduction means development and implementation of new energy technology solutions. Some people consider that the technology revolution has already started in Europe since the markets for renewable technology have annually grown.[25]
In the last hundred years, there has been a recorded increase in temperature of 1 °C in Europe. Although this might seem trivial, it has had huge repercussions on the global economy and in agriculture. Furthermore, "the IPCC report expects an increase of the mean global temperature by 1.8°C to 4.0°C".[26]
European Union climate chief is Connie Hedegaard since 10 February 2010.See also
References
- Beck, Hylke E.; Zimmermann, Niklaus E.; McVicar, Tim R.; Vergopolan, Noemi; Berg, Alexis; Wood, Eric F. (30 October 2018). "Present and future Köppen-Geiger climate classification maps at 1-km resolution". Scientific Data. 5: 180214. Bibcode:2018NatSD...580214B. doi:10.1038/sdata.2018.214. ISSN 2052-4463. PMC 6207062. PMID 30375988.
- "European Climate". World Book. World Book, Inc. Archived from the original on 2011-07-23. Retrieved 2011-02-15.
- Brønnøysund
- Nome
- Yakutsk
- Helsinki
- "Pogoda.ru.net" (in Russian). Retrieved 8 September 2007.
- "Met.hu". 2020-01-10.
- "Greenwich climate".
- "PREVISIONS METEO FRANCE - Site Officiel de Météo-France - Prévisions gratuites à 15 jours sur la France et à 10 jours sur le monde".
- "Bucuresti Baneasa Climate Normals 1961–1990". www.NOAA.gov. Retrieved 31 October 2012.
- http://clima.meteoam.it/AtlanteClimatico/pdf/%28239%29Roma%20Ciampino.pdf
- "Weather Information for Barcelona - World Meteorological Organization (United Nations)".
- "Valores Climatológicos Normales. Barcelona / Aeropuerto - Agencia Estatal de Meteorología". Archived from the original on 2011-02-16.
- "Monthly Averages for Lisbon, Portugal". Instituto de Meteorologia. Retrieved 2012-06-16.
- "Average temperatures in Malta 1981–2010". Retrieved 2017-01-24.
- "Valores climatológicos normales. Málaga - Agencia Estatal de Meteorología". Retrieved 2018-01-24.
- Το αρχείο του Θησείου (in Greek). Meteoclub. Retrieved 6 February 2018.
- J Holden, A Wright (2003-03-13). "UK tornado climatology and the development of simple prediction tools" (PDF). Quarterly Journal of the Royal Meteorological Society. 130 (598): 1009–1021. Bibcode:2004QJRMS.130.1009H. CiteSeerX 10.1.1.147.4293. doi:10.1256/qj.03.45. Archived from the original (PDF) on 2007-08-24. Retrieved 2009-12-13.
- Staff (2002-03-28). "Natural Disasters: Tornadoes". BBC Science and Nature. BBC. Archived from the original on 2002-10-14. Retrieved 2009-12-13.
- Nikolai Dotzek (2003-03-20). "An updated estimate of tornado occurrence in Europe" (PDF). Atmospheric Research. 67: 153–161. Bibcode:2003AtmRe..67..153D. doi:10.1016/S0169-8095(03)00049-8. Archived from the original (PDF) on 2007-06-14. Retrieved 2009-12-13.
- Meaden, Terrance (2004). "Wind Scales: Beaufort, T — Scale, and Fujita's Scale". Tornado and Storm Research Organisation. Archived from the original on 2010-04-30. Retrieved 2009-09-11.
- Kayser-Bril, Nicolas (24 September 2018). "Europe is getting warmer, and it's not looking like it's going to cool down anytime soon". EDJNet. Retrieved 25 September 2018.
- Carter, J.G. 2011, "Climate change adaptation in European cities", Current Opinion in Environmental Sustainability, vol. 3, no. 3, pp. 193-198
- Ilmastonmuutos otettiin yhä vakavammin; Yle 30.12.2008 (in Finnish)
- C. Lippert, T. Krimly, J. Aurbacher, 2009, A Ricardian analysis of the impact of climate change on agriculture in Germany, pg1