California's 52nd congressional district
California's 52nd congressional district is a congressional district in the U.S. state of California. The district is currently represented by Democrat Scott Peters.
| California's 52nd congressional district | |||
|---|---|---|---|
.tif.png) California's 52nd congressional district since January 3, 2013. | |||
| Representative |
| ||
| Population (2013) | 713,904[1] | ||
| Median income | $95,770[2] | ||
| Ethnicity | |||
| Cook PVI | D+6[4] | ||
The district is currently in San Diego County. It includes coastal and central portions of the city of San Diego, including neighborhoods such as Carmel Valley, La Jolla, Point Loma and Downtown San Diego; the San Diego suburbs of Poway and Coronado; and colleges such as University of California, San Diego (partial), Point Loma Nazarene, University of San Diego, and colleges of the San Diego Community College District.[5] Much of this territory was in the 50th District from 2003 to 2013.
Competitiveness
In statewide races
| Election results from statewide races | ||
|---|---|---|
| Year | Office | Results |
| 1992 | President[6] | Bush 36.6% – 33.8% |
| Senator[7] | Herschensohn 49.2% – 38.8% | |
| Senator (Special)[8] | Seymour 46.0% – 43.0% | |
| 1994 | Governor[9] | Wilson 65.3% – 29.0% |
| Senator[10] | Huffington 58.1% – 31.7% | |
| 1996 | President[11] | Dole 47.6% - 41.2% |
| 1998 | Governor[12] | Lungren 48.3% – 47.1% |
| Senator[13] | Fong 51.8% – 42.8% | |
| 2000 | President[14] | Bush 54.4% – 41.2% |
| Senator[15] | Feinstein 46.6% – 44.4% | |
| 2002 | Governor[16] | Simon 58.0% – 34.8% |
| 2003 | Recall[17][18] | |
| Schwarzenegger 65.5% – 17.3% | ||
| 2004 | President[19] | Bush 61.4% – 37.7% |
| Senator[20] | Jones 51.5% – 44.4% | |
| 2006 | Governor[21] | Schwarzenegger 72.4% – 24.3% |
| Senator[22] | Mountjoy 49.6% – 46.0% | |
| 2008 | President[23] | McCain 53.4% – 45.0% |
| 2010 | Governor[24] | Whitman 57.4% – 36.5% |
| Senator[25] | Fiorina 59.4% – 34.9% | |
| 2012 | President[26] | Obama 52.1% – 45.7% |
| Senator[27] | Feinstein 54.5% – 44.5%% | |
| 2014 | Governor[28] | Brown 52.3% – 47.7% |
| 2016 | President[29] | Clinton 58.1% – 35.6% |
| Senator[30] | Harris 63.5% – 36.5% | |
| 2018 | Governor[31] | Newsom 58.3% – 41.7% |
| Senator[32] | Feinstein 56.3% – 43.7% | |
List of members representing the district
District created January 3, 1993.
| Member | Party | Dates | Cong ress(es) |
Electoral history | Counties |
|---|---|---|---|---|---|
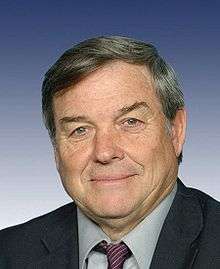 Duncan L. Hunter |
Republican | January 3, 1993 – January 3, 2009 |
103rd 104th 105th 106th 107th 108th 109th 110th |
Redistricted from the 45th district and re-elected in 1992. Re-elected in 1994. Re-elected in 1996. Re-elected in 1998. Re-elected in 2000. Re-elected in 2002. Re-elected in 2004. Re-elected in 2006. Retired. |
1993–2003 Imperial Eastern San Diego |
| 2003–2013 Imperial Eastern San Diego  | |||||
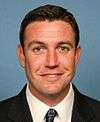 Duncan D. Hunter |
Republican | January 3, 2009 – January 3, 2013 |
111th 112th |
Elected in 2008. Re-elected in 2010. Redistricted to the 50th district. | |
.jpg) Scott Peters |
Democratic | January 3, 2013 – Present |
113th 114th 115th 116th |
Elected in 2012. Re-elected in 2014. Re-elected in 2016. Re-elected in 2018. |
2013–Present Coastal San Diego (La Jolla and Poway) .tif.png) |
Election results
1992
| Party | Candidate | Votes | % | |
|---|---|---|---|---|
| Republican | Duncan Hunter (Incumbent) | 112,995 | 52.9 | |
| Democratic | Janet M. Gastil | 88,076 | 41.2 | |
| Libertarian | Joe Shea | 6,977 | 3.3 | |
| Peace and Freedom | Dennis P. Gretsinger | 5,734 | 2.7 | |
| Total votes | 213,784 | 100.0 | ||
| Republican hold | ||||
1994
| Party | Candidate | Votes | % | |
|---|---|---|---|---|
| Republican | Duncan Hunter (Incumbent) | 109,201 | 64.0 | |
| Democratic | Janet M. Gastil | 53,024 | 31.1 | |
| Libertarian | Joe Shea | 5,240 | 3.0 | |
| Peace and Freedom | Art Edelman | 3,221 | 1.9 | |
| Total votes | 170,686 | 100.0 | ||
| Republican hold | ||||
1996
| Party | Candidate | Votes | % | |
|---|---|---|---|---|
| Republican | Duncan Hunter (Incumbent) | 116,746 | 65.5 | |
| Democratic | Darity Wesley | 53,104 | 29.8 | |
| Peace and Freedom | Janice Jordan | 3,649 | 2.1 | |
| Libertarian | Dante Ridley | 3,329 | 1.8 | |
| Natural Law | Peter Ballantyne | 1,493 | 0.8 | |
| Total votes | 178,321 | 100.0 | ||
| Republican hold | ||||
1998
| Party | Candidate | Votes | % | |
|---|---|---|---|---|
| Republican | Duncan Hunter (Incumbent) | 116,251 | 75.7 | |
| Libertarian | Lynn Badler | 21,933 | 14.3 | |
| Natural Law | Adrienne Pelton | 15,380 | 10.0 | |
| Republican | Bill Warren (write-in) | 4 | 0.00 | |
| Total votes | 153,568 | 100.0 | ||
| Republican hold | ||||
2000
| Party | Candidate | Votes | % | |
|---|---|---|---|---|
| Republican | Duncan Hunter (Incumbent) | 131,345 | 64.8 | |
| Democratic | Craig Barkacs | 63,537 | 31.3 | |
| Libertarian | Michael Benoit | 5,995 | 2.9 | |
| Natural Law | Robert A. Sherman | 2,117 | 1.0 | |
| Total votes | 202,994 | 100.0 | ||
| Republican hold | ||||
2002
| Party | Candidate | Votes | % | |
|---|---|---|---|---|
| Republican | Duncan Hunter (Incumbent) | 118,561 | 70.2 | |
| Democratic | Peter Moore-Kochlacs | 43,526 | 25.8 | |
| Libertarian | Michael Benoit | 6,923 | 4.0 | |
| Total votes | 169,010 | 100.0 | ||
| Republican hold | ||||
2004
| Party | Candidate | Votes | % | |
|---|---|---|---|---|
| Republican | Duncan Hunter (Incumbent) | 187,799 | 67.0 | |
| Democratic | Brian S. Keliher | 74,857 | 27.7 | |
| Libertarian | Michael Benoit | 8,782 | 3.3 | |
| Total votes | 271,438 | 100.0 | ||
| Republican hold | ||||
2006
| Party | Candidate | Votes | % | |
|---|---|---|---|---|
| Republican | Duncan Hunter (Incumbent) | 123,696 | 64.7 | |
| Democratic | John Rinaldi | 61,208 | 32.0 | |
| Libertarian | Michael Benoit | 6,465 | 3.3 | |
| Total votes | 191,369 | 100.0 | ||
| Republican hold | ||||
2008
| Party | Candidate | Votes | % | |
|---|---|---|---|---|
| Republican | Duncan D. Hunter | 160,724 | 56.4 | |
| Democratic | Mike Lumpkin | 111,051 | 39.0 | |
| Libertarian | Michael Benoit | 13,316 | 4.6 | |
| Total votes | 285,091 | 100.0 | ||
| Republican hold | ||||
2010
| Party | Candidate | Votes | % | |
|---|---|---|---|---|
| Republican | Duncan D. Hunter (Incumbent) | 139,437 | 63.1 | |
| Democratic | Ray Lutz | 70,860 | 32.1 | |
| Libertarian | Michael Benoit | 10,731 | 4.8 | |
| Total votes | 221,028 | 100.0 | ||
| Republican hold | ||||
2012
| Party | Candidate | Votes | % | |
|---|---|---|---|---|
| Democratic | Scott Peters | 151,451 | 51.2 | |
| Republican | Brian Bilbray (Incumbent) | 144,459 | 48.8 | |
| Total votes | 295,910 | 100.0 | ||
| Democratic gain from Republican | ||||
2014
| Party | Candidate | Votes | % | |
|---|---|---|---|---|
| Democratic | Scott Peters (Incumbent) | 98,826 | 51.6 | |
| Republican | Carl DeMaio | 92,746 | 48.4 | |
| Total votes | 191,572 | 100.0 | ||
| Democratic hold | ||||
2016
| Party | Candidate | Votes | % | |
|---|---|---|---|---|
| Democratic | Scott Peters (Incumbent) | 181,253 | 56.5 | |
| Republican | Denise Gitsham | 139,403 | 43.5 | |
| Total votes | 320,656 | 100.0 | ||
| Democratic hold | ||||
2018
| Party | Candidate | Votes | % | |
|---|---|---|---|---|
| Democratic | Scott Peters (Incumbent) | 188,992 | 63.8 | |
| Republican | Omar Qudrat | 107,015 | 36.2 | |
| Total votes | 296,007 | 100.0 | ||
| Democratic hold | ||||
Historical district boundaries
From 2003 through 2013, the district consisted of many of San Diego's northern and eastern suburbs, including Lakeside, Poway, Ramona, La Mesa, and Spring Valley. Due to redistricting after the 2010 United States Census, much of this area is now in the 50th District.
See also
References
- "American Fact Finder - Results". United States Census Bureau. Archived from the original on February 13, 2020. Retrieved May 18, 2015.
- US Census
- LA Times
- "Partisan Voting Index – Districts of the 115th Congress" (PDF). The Cook Political Report. April 7, 2017. Retrieved April 7, 2017.
- "California State Congressional District 52". Retrieved September 15, 2019.
- Statement of Vote (1992 President)
- Statement of Vote (1992 Senate)
- Statement of Vote (1992 Senate)
- Statement of Vote (1994 Governor)
- Statement of Vote (1994 Senate)
- Statement of Vote (1996 President)
- Statement of Vote (1998 Governor) Archived September 29, 2011, at the Wayback Machine
- Statement of Vote (1998 Senate) Archived September 29, 2011, at the Wayback Machine
- Statement of Vote (2000 President)
- Statement of Vote (2000 Senator)
- Statement of Vote (2002 Governor)
- Statement of Vote (2003 Recall Question)
- Statement of Vote (2003 Governor)
- Statement of Vote (2004 President)
- Statement of Vote (2004 Senator)
- Statement of Vote (2006 Governor)
- Statement of Vote (2006 Senator)
- Statement of Vote (2008 President)
- Statement of Vote (2010 Governor)
- Statement of Vote (2010 Senator)
- Statement of Vote (2012 President)
- Statement of Vote (2012 Senator)
- Statement of Vote (2014 Governor)
- Statement of Vote (2016 President)
- Statement of Vote (2016 Senator)
- Statement of Vote (2018 Governor)
- Statement of Vote (2018 Senator)
- 1992 election results
- 1994 election results
- 1996 election results
- 1998 election results
- 2000 election results
- 2002 election results
- 2004 election results
- 2006 election results
- 2008 election results
- 2010 election results
- 2012 election results
- 2014 election results
- 2016 election results
- 2018 election results