Box score (baseball)
In baseball, the statistical summary of a game is reported in a box score. An abbreviated version of the box score, duplicated from the field scoreboard, is the line score. The Baseball Hall of Fame credits Henry Chadwick with the invention of the box score.
Line score
The line score is a two-line chart that reports each team's run totals by inning, and total runs, total hits, and total errors on a line. The visiting team is on the top line and the home team on the bottom line. The terms top of the inning and bottom of the inning are derived from their positions in the line score. Sometimes, the winning team is bolded or colored for quick-reference. If the home team is already leading and does not bat in the bottom of the 9th inning, that position in the line score will have an "X" instead of a number of runs scored.
Line score for the Brooklyn Dodgers–New York Giants pennant-winning game of October 3, 1951:
| Team | 1 | 2 | 3 | 4 | 5 | 6 | 7 | 8 | 9 | R | H | E | |||||||||||
|---|---|---|---|---|---|---|---|---|---|---|---|---|---|---|---|---|---|---|---|---|---|---|---|
| Brooklyn | 1 | 0 | 0 | 0 | 0 | 0 | 0 | 3 | 0 | 4 | 8 | 0 | |||||||||||
| New York | 0 | 0 | 0 | 0 | 1 | 0 | 0 | 0 | 4 | 5 | 8 | 0 | |||||||||||
| WP: Larry Jansen LP: Ralph Branca | |||||||||||||||||||||||
Box score
The box score lists the line score as well as individual and team performance in the game. The statistics used are those recorded by the official scorer of each game.
The following box score is of a notable game in baseball history, game 6 of the 1991 World Series.
Saturday, October 26, 1991 Hubert H. Humphrey Metrodome, Minneapolis, Minnesota Atlanta 0 0 0 0 2 0 1 0 0 0 0 – 3 9 1 Minnesota 2 0 0 0 1 0 0 0 0 0 1 - 4 9 0 Atlanta Braves ab r h rbi bb so po a Smith dh 3 1 0 0 1 0 0 0 Pendleton 3b 5 1 4 2 0 0 1 2 Gant cf 5 0 0 1 0 0 2 0 Justice rf 4 0 0 0 1 1 3 0 Bream 1b 4 0 1 0 1 0 12 2 Mitchell pr,lf 0 0 0 0 0 0 0 0 Hunter lf,1b 5 0 0 0 0 0 1 0 Olson c 5 0 0 0 0 1 6 0 Lemke 2b 4 1 2 0 0 0 2 3 Belliard ss 2 0 1 0 0 1 1 4 Gregg ph 0 0 0 0 0 0 0 0 Blauser ph,ss 2 0 1 0 0 1 1 3 Totals 39 3 9 3 3 4 30 14 FIELDING - Atlanta DP: 2. Bream-Belliard-Bream, Blauser-Lemke-Bream. E: Hunter (1). BATTING - Atlanta HR: Pendleton (2,5th inning off Erickson 1 on 1 out). HBP: Smith (1,by Erickson). GDP: Smith (1,off Willis). Team LOB: 7. BASERUNNING - Atlanta CS: Mitchell (1,2nd base by Aguilera/Harper). Minnesota Twins ab r h rbi bb so po a Gladden lf 4 1 0 0 1 0 1 0 Knoblauch 2b 5 1 1 0 0 0 4 1 Puckett cf 4 2 3 3 0 1 3 0 Davis dh 4 0 0 0 0 1 0 0 Mack rf 4 0 2 1 0 0 0 0 Leius 3b 3 0 2 0 0 0 3 2 Pagliarulo ph,3b 1 0 0 0 0 1 2 0 Hrbek 1b 4 0 0 0 0 1 11 1 Ortiz c 2 0 0 0 0 1 4 0 Harper ph,c 2 0 0 0 0 1 0 1 Gagne ss 4 0 1 0 0 0 5 6 Totals 37 4 9 4 1 6 33 11 FIELDING - Minnesota DP: 2. Gagne-Hrbek, Gagne. BATTING - Minnesota 2B: Mack (1,off Avery). 3B: Puckett (1,off Avery). HR: Puckett (2,11th inning off Leibrandt 0 on 0 out). SF: Puckett (1,off Avery). GDP: Hrbek (1,off Avery); Gladden (1,off Stanton). Team LOB: 5. BASERUNNING - Minnesota SB: Gladden (2,2nd base off Avery/Olson); Puckett (1,2nd base off Stanton/Olson). Pitchers Atlanta Braves IP H R ER BB SO HR BFP Avery 6.0 6 3 3 1 3 0 25 Stanton 2.0 2 0 0 0 1 0 7 Pena 2.0 0 0 0 0 2 0 6 Leibrandt (L, 0-2) 0.0 1 1 1 0 0 1 1 TOTALS 10 9 4 4 1 6 1 39 Leibrandt faced 1 batter in the 11th inning Minnesota Twins IP H R ER BB SO HR BFP Erickson 6.0 5 3 3 2 2 1 26 Guthrie 0.1 1 0 0 1 1 0 3 Willis 2.2 1 0 0 0 1 0 8 Aguilera (W, 1-1) 2.0 2 0 0 0 0 0 6 TOTALS 11 9 3 3 3 4 1 43 Erickson faced 1 batter in the 7th inning WP–Guthrie (1). HBP–Erickson (1,Smith). Inherited Runners - Scored: Guthrie 1-0; Willis 3-1. U–Ed Montague (NL), Don Denkinger (AL), Harry Wendelstedt (NL), Drew Coble (AL), Rick Reed (AL), Terry Tata (NL). T–3:46. A–55,155. |
(All game references below refer to the box score above.)
At the top of the box score, the editor of a publication may list the time, date, and/or place of the game. In the example, the stadium's name (the Hubert H. Humphrey Metrodome) and city (Minneapolis) are listed.
The line score is always listed as part of the box score, usually near the top; it lists the total runs scored in each inning. (The Atlanta Braves scored two runs in the fifth inning and one in the seventh. The Minnesota Twins scored two runs in the first inning, one in the fifth, and one in the eleventh. ) Innings are normally grouped in sets of three for ease of reading. The team totals of runs, hits, and errors are listed last, after a separating character such as a dash. The actual score of the game is represented by the first column after the dash; (the Twins won this game four runs to three.)
The batting performances of each player in the game are grouped by team, with the visiting team listed first. Players are listed by last name in the order in which they were listed on the lineup card for the game, showing all players who enter the game at any point whether they make a plate appearance or not. Their fielding positions or batting roles are normally listed next to their last name. Typically only last names are used, unless two players with the same name appear in the game, in which case a distinctive first initial is also used. When a player switches fielding position, both positions are listed. (Brian Hunter, in the sixth position of the Braves' batting order, started at left field but also served as the first baseman.) Substitute players are listed where they were placed in the batting order (in cases such as a double switch, not necessarily in the position of the player they replaced). Players who had an offensive role only are listed by that role: "ph" if they entered as a pinch hitter or "pr" if as a pinch runner. Substitutes who enter for defensive purposes and do not make a plate appearance have their fielding position shown and their batting line score shown as zeros. When a pinch hitter or pinch runner remains in the game, his fielding position is also listed. Some box scores will indent substitutes' names to indicate their spot in the order was the same as the non-indented starter's name above it; others will leave all names left-justified. (The Twins' Brian Harper pinch hit for Junior Ortiz and then remained in the game as catcher.)
Batting statistics are displayed to the right of the names in the lineup. At minimum are shown each batter's at bats, runs, hits, and runs batted in. Some box scores show other player statistics such as home runs, stolen bases, bases on balls, strikeouts, fielding errors, times left on base, home runs, or season batting average. At the bottom of the lineup are the team totals for each category.
Additional batting, fielding, and base-running statistics are listed in non-tabular form normally below the batting order summaries:
- E– errors (Brian Hunter committed an error, his first of the postseason series).
- DP– double plays (Each team turned two double plays.) Some box scores list the fielders involved.
- 2B– doubles (Shane Mack hit a double, on a pitch from Steve Avery, his first in the postseason).
- 3B- triples (Kirby Puckett hit a triple, on a pitch from Avery, his first).
- HR- home runs (There were two home runs in the game. With one out, Terry Pendleton hit his second home run of the series, a home run with a man on base on a pitch from Scott Erickson in the fifth inning; with no outs, Puckett hit home run with no one on base in the eleventh inning, his second of the series, which won the game for Minnesota.)
- HBP- batters hit by a pitch (Lonnie Smith was hit by a pitch from Erickson. It was his first time being hit in this series)
- SF- sacrifice fly (Puckett was credited with a sacrifice fly, hit off of Avery.)
- CS- caught stealing (Keith Mitchell was thrown out by Brian Harper when attempting to steal second base on a pitch by Rick Aguilera.)
- SB– stolen base (Dan Gladden stole his second base of the series on a pitch from Avery to Greg Olson; Puckett also stole second on a pitch from Mike Stanton--his first stolen base of the series.)
- TB– total bases (It's one for a single, two for a double, three for a triple and four for a home run. For example, if a batter has two singles, a double and a home run, this would be eight total bases.)
Below the batting orders and line score, the pitching summary is listed. Each pitcher used in the game is listed, along with any decision awarded to that pitcher. A pitcher can be credited with a win, a loss, a save, or a hold. Cumulative totals for pitching decisions are also shown, for either regular season or post-season play. To the right of each pitcher's name are recorded the total innings pitched, hits given up, runs allowed, earned runs allowed, bases on balls issued, and strikeouts made. More elaborate statistics may also be displayed, such as home runs allowed, pitch count, or the pitcher's cumulative earned run average.
Other pitching events are shown below the summary.
- WP- wild pitch thrown (Mark Guthrie threw one wild pitch, his first of the series.)
- HBP – hit by pitch, the reverse of the listing from the batting summary (Erickson hit Lonnie Smith with a pitch, his first hit batsman of the series).
Other overall game information is shown at the bottom of the box score.
- U- umpire crew (Six umpires worked this game, listed by umpiring position. The home plate umpire is listed first, then the umpires for each base in order, then the left and right field umpires, if any. In inter-league play, league affiliations were also shown, but, with the merger of the major-league umpiring staffs prior to the 2000 season, these references have been eliminated .)
- T- time of the game, not counting rain delays or light failure (The game was played in three hours and forty-six minutes.)
- A- paid attendance (55,155 tickets were sold for this game.)
Most box scores also give the temperature, weather, and wind speed/direction.
Other events not shown in the example but recorded in most box scores include sacrifice hits ("S"), triple plays ("TP"), balks ("BK"), blown saves ("BS"), and passed balls ("PB"). Many box scores, to save space, do not list any categories where none of that event occurred in the game. Others will list the category followed by " – None".
In a baseball game, the number of plate appearances for each team must be equal to the number of batters put out, scored, and left on base. A box score is in balance (or proved) when the total of the team's times at bat, bases on balls received, hit batters, sacrifice bunts, sacrifice flies and batters awarded first base because of interference or obstruction equals the total of that team's runs, players left on base and the opposing team's putouts. In other words, the box score is accounting for the number of batters and what became of them (scored, left on base, or put out). If a box score is unbalanced, then there is a logical contradiction and thus an error somewhere in the box score.
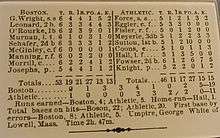
Early box scores
The first box scores tended to be vaguely related to cricket scorekeeping, in that only two offense-oriented figures were presented for each batter: "O" and "R", meaning "number of times put out" and "number of runs scored", respectively.
As fan interest in all aspects of the game increased, the box scores were revised and expanded to include the offensive categories At-Bats, Runs, Hits and sometimes Total Bases; and the defensive categories Put-Outs, Assists and Errors for each batter, as well as a statistical summary underneath the lineups listing extra-base hits, innings pitched, earned runs, etc.
In baseball, if the team scheduled to bat last is leading after 8½ innings, there is no turn at bat for that team, as it would not affect the outcome of the game, so the last of the ninth is usually marked with an "X" as a placeholder in the line score. Some newspapers (and some scoreboards) in those days showed the home team in the top line, resulting in the peculiarity of an "X" placed in what appeared to be the "top" of the ninth. This practice was a carryover from the time when the home team had the choice of whether to bat first or last, another similarity with cricket. Teams would often choose to bat first, counting on their ability to "get the jump" on the visiting team (as with football teams that win the coin toss), but the potential for the visitors scoring the winning run in the last of ninth was clearly an unsatisfying situation for the fans. The rules eventually required the home team to bat last, but the practice of listing the home team first was carried on for a while, in some places, even when it did not square with the actual events of the game.
The offensive statistic Runs Batted In was developed in the early 1900s, and was soon being carried in the lineup portion of the box scores.
As relief pitching became more common, a separate "lineup" section for the pitchers was developed, carrying individual Innings Pitched; the number of Hits, Runs, Earned Runs, and Bases on Balls allowed; and Strike-Outs achieved.
By the late 1960s or so, in the interest of space, most newspapers dropped the defensive stats from the lineups, just carrying the list of errors (if any) in the game summary. For a special event, such as World Series play (especially if a local team is involved), newspapers still often print the wider version of the box score.