Bioimage informatics
Bioimage informatics is a subfield of bioinformatics and computational biology.[1] It focuses on the use of computational techniques to analyze bioimages, especially cellular and molecular images, at large scale and high throughput. The goal is to obtain useful knowledge out of complicated and heterogeneous image and related metadata.
Automated microscopes are able to collect large numbers of images with minimal intervention. This has led to a data explosion, which absolutely requires automatic processing. Additionally, and surprisingly, for several of these tasks, there is evidence that automated systems can perform better than humans.[2][3] In addition, automated systems are unbiased, unlike human based analysis whose evaluation may (even unconsciously) be influenced by the desired outcome.
There has been an increasing focus on developing novel image processing, computer vision, data mining, database and visualization techniques to extract, compare, search and manage the biological knowledge in these data-intensive problems.[4][5]
Data Modalities
Several data collection systems and platforms are used, which require different methods to be handled optimally.
Fluorescent Microscopy
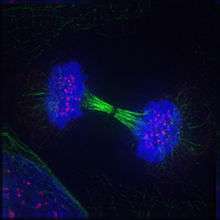
Fluorescent microscopy allows the direct visualization of molecules at the subcellular level, in both live and fixed cells. Molecules of interest are marked with either green fluorescent protein (GFP), another fluorescent protein, or a fluorescently-labeled antibody. Several types of microscope are regularly used: widefield, confocal, or two-photon. Most microscopy system will also support the collection of time-series (movies).
In general, filters are used so that each dye is imaged separately (for example, a blue filter is used to image Hoechst, then rapidly switched to a green filter to image GFP). For consumption, the images are often displayed in false color by showing each channel in a different color, but these may not even be related to the original wavelengths used. In some cases, the original image could even have been acquired in non-visible wavelengths (infrared is common).
The choices at the image acquisition stage will influence the analysis and often require special processing. Confocal stacks will require 3D processing and widefield pseudo-stacks will often benefit from digital deconvolution to remove the out-of-focus light.
The advent of automated microscopes that can acquire many images automatically is one of the reasons why analysis cannot be done by eye (otherwise, annotation would rapidly become the research bottleneck). Using automated microscopes means that some images might be out-of-focus (automated focus finding systems may sometimes be incorrect), contain a small number of cells, or be filled with debris. Therefore, the images generated will be harder to analyse than images acquired by an operator as they would have chosen other locations to image and focus correctly. On the other hand, the operator might introduce an unconscious bias in his selection by choosing only the cells whose phenotype is most like the one expected before the experiment.
Histology
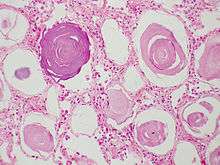
Histology is a microscopy application where tissue slices are stained and observed under the microscope (typically light microscope, but electron microscopy is also used).
When using a light microscope, unlike the case of fluorescent imaging, images are typically acquired using standard color camera-systems. This reflects partially the history of the field, where humans were often interpreting the images, but also the fact that the sample can be illuminated with white light and all light collected rather than having to excite fluorophores. When more than one dye is used, a necessary preprocessing step is to unmix the channels and recover an estimate of the pure dye-specific intensities.
It has been shown that the subcellular location of stained proteins can be identified from histology images.
If the goal is a medical diagnostic, then histology applications will often fall into the realm of digital pathology or automated tissue image analysis, which are sister fields of bioimage informatics. The same computational techniques are often applicable, but the goals are medically- rather than research-oriented.
Important Problems
Subcellular Location Analysis
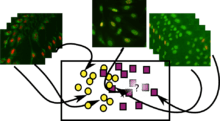
Subcellular location analysis was one of the initial problems in this field. In its supervised mode, the problem is to learn a classifier that can recognize images from the major cell organelles based on images.
Methods used are based on machine learning, building a discriminative classifier based on numeric features computed from the image. Features are either generic features from computer vision, such as Haralick texture features or features specially designed to capture biological factors (e.g., co-localization with a nuclear marker being a typical example).
For the basic problem of identifying organelles, very high accuracy values can be obtained, including better than ? results.[2] These methods are useful in basic cell biology research, but have also been applied to the discovery of proteins whose location changes in cancer cells.[6]
However, classification into organelles is a limited form of the problem as many proteins will localize to multiple locations simultaneously (mixed patterns) and many patterns can be distinguished even though they are not different membrane-bound components. There are several unsolved problems in this area and research is ongoing.
High-Content Screening
High throughput screens using automated imaging technology (sometimes called high-content screening) have become a standard method for both drug discovery and basic biological research. Using multi-well plates, robotics, and automated microscopy, the same assay can be applied to a large library of possible reagents (typically either small molecules or RNAi) very rapidly, obtaining thousands of images in a short amount of time. Due to the high volume of data generated, automatic image analysis is a necessity.[7]
When positive and negative controls are available, the problem can be approached as a classification problem and the same techniques of feature computation and classification that are used for subcellular location analysis can be applied.
Segmentation
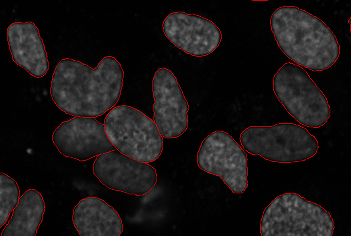
Segmentation of cells is an important sub-problem in many of the fields below (and sometimes useful on its own if the goal is only to obtain a cell count in a viability assay). The goal is to identify the boundaries of cells in a multi-cell image. This allows for processing each cell individually to measure parameters. In 3D data, segmentation must be performed in 3D space.
As the imaging of a nuclear marker is common across many images, a widely used protocol is to segment the nuclei. This can be useful by itself if nuclear measurements are needed or it can serve to seed a watershed which extends the segmentation to the whole image.
All major segmentation methods have been reported on cell images, from simple thresholding to level set methods. Because there are multiple image modalities and different cell types, each of which implies different tradeoffs, there is no single accepted solution for this problem.
Cell image segmentation as an important procedure is often used to study gene expression and colocalization relationship etc. of individual cells. In such cases of single-cell analysis it is often needed to uniquely determine the identities of cells while segmenting the cells. Such a recognition task is often non-trivial computationally. For model organisms such as C. elegans that have well-defined cell lineages, it is possible to explicitly recognize the cell identities via image analysis, by combining both image segmentation and pattern recognition methods.[9] Simultaneous segmentation and recognition of cells[10] has also been proposed as a more accurate solution for this problem when an "atlas" or other prior information of cells is available. Since gene expression at single cell resolution can be obtained using these types of imaging based approaches, it is possible to combine these methods with other single cell gene expression quantification methods such as RNAseq.
Tracking
Tracking is another traditional image processing problem which appears in bioimage informatics. The problem is to relate objects that appear in subsequent frames of a film. As with segmentation, the problem can be posed in both two- and three-dimensional forms.[11]
In the case of fluorescent imaging, tracking must often be performed on very low contrast images. As obtaining high contrast is done by shining more light which damages the sample and destroys the dye, illumination is kept at a minimum. It is often useful to think of a photon budget: the number of photons that can be used for imaging before the damage to the sample is so great that data can no longer be trusted. Therefore, if high contrast images are to be obtained, then only a few frames can be used; while for long movies, each frame will be of very low contrast.
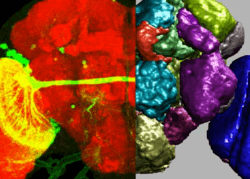
Registration
When image data samples of different natures, such as those corresponding to different labeling methods, different individuals, samples at different time points, etc. are considered, images often need to be registered for better comparison. One example is as time-course data is collected, images in subsequent frames must often be registered so that minor shifts in the camera position can be corrected for. Another example is that when many images of a model animal (e.g. C. elegans or Drosophila brain or a mouse brain) are collected, there is often a substantial need to register these images to compare their patterns (e.g. those correspond to the same or different neuron population, those share or differ in the gene expression, etc.).
Medical image registration software packages were early attempts to be used for the microscopic image registration applications. However, due to the often much larger image file size and a much bigger number of specimens in the experiments, in many cases it is needed to develop new 3D image registration software. The BrainAligner[12] is a software that has been used to automate the 3D deformable and nonlinear registration process using a reliable-landmark-matching strategy. It has been primarily used to generate more than 50,000 3D standardized fruitfly brain images at Janelia Farm of HHMI, with other applications including dragonfly and mice.
Important Venues
A consortium of scientists from universities and research institutes have organized annual meetings on bioimage informatics[13] since 2005. The ISMB conference has had a Bioimaging & Data Visualization track since 2010. The journal Bioinformatics also introduced a Bioimage Informatics track in 2012. The OpenAccess journal BMC Bioinformatics has a section devoted to bioimage analysis, visualization and related applications. Other computational biology and bioinformatics journals also regularly publish bioimage informatics work. A European Union Cost action called NEUBIAS (network of european bioimage analysts) has been organizing annual conferences as well as bioimage analyst training schools and taggathons since 2017.
Software
There are several packages that make bioimage informatics methods available through a graphical user interface such as ImageJ, FIJI, CellProfiler or Icy. Visualization and analysis platforms such as Vaa3D have appeared in recent years and have been used in both large scale projects especially for neuroscience and desktop applications.
Other researchers develop their own methods, typically based on a programming language with good computer vision support such as Python, C++, or MATLAB. The Mahotas library for Python is one popular example. Although, examples of researcher developed methods in programming languages with less computer vision support as R exist (e.g. trackdem [14]).
See also
- Focus stacking The technique of combining multiple images with difference focus distances into one.
- High-content screening
- digital pathology
- Medical imaging
External links
- Vaa3D: High-performance multi-dimensional image visualization and analysis
- Bioformats The Image file IO engine that supports dozens of formats
References
- Peng, H; Bateman A; Valencia A; Wren JD (2012). "Bioimage informatics: a new category in Bioinformatics". Bioinformatics. 28 (8): 1057. doi:10.1093/bioinformatics/bts111. PMC 3324521. PMID 22399678.
- Murphy, Robert; Velliste, M.; Porreca, G. (2003). "Robust numerical features for description and classification of subcellular location patterns in fluorescence microscope images". The Journal of VLSI Signal Processing. 35 (3): 311–321. CiteSeerX 10.1.1.186.9521. doi:10.1023/b:vlsi.0000003028.71666.44.
- Nattkemper, Tim; Thorsten Twellmann; Helge Ritter; Walter Schubert (2003). "Human vs. machine: evaluation of fluorescence micrographs". Computers in Biology and Medicine. 33 (1): 31–43. CiteSeerX 10.1.1.324.4664. doi:10.1016/S0010-4825(02)00060-4. PMID 12485628.
- Peng H (September 2008). "Bioimage informatics: a new area of engineering biology". Bioinformatics. 24 (17): 1827–36. doi:10.1093/bioinformatics/btn346. PMC 2519164. PMID 18603566.
- "The quest for quantitative microscopy". Nature Methods. 9 (7): 627. 2012. doi:10.1038/nmeth.2102. PMID 22930824.
- Glory, Estelle; Justin Newberg; Robert F. Murphy (2008). "Automated comparison of protein subcellular location patterns between images of normal and cancerous tissues". Biomedical Imaging: From Nano to Macro, 2008. ISBI 2008. 5th IEEE International Symposium on.
- Shariff, Aabid; Joshua Kangas; Luis Pedro Coelho; Shannon Quinn; Robert F Murphy (2010). "Automated image analysis for high-content screening and analysis". Journal of Biomolecular Screening. 15 (7): 726–734. doi:10.1177/1087057110370894. PMID 20488979.
- Coelho, Luis Pedro; Aabid Shariff; Robert F. Murphy (2009). "Nuclear segmentation in microscope cell images: a hand-segmented dataset and comparison of algorithms". Biomedical Imaging: From Nano to Macro, 2009. ISBI'09. IEEE International Symposium on. IEEE. doi:10.1109/ISBI.2009.5193098. PMC 2901896.
- Long, Fuhui; Peng, H.; Liu, X.; Kim, S.; Myers, E.W (Sep 2009). "A 3D digital atlas of C. elegans and its application to single-cell analyses". Nature Methods. 6 (9): 667–672. doi:10.1038/nmeth.1366. PMC 2882208. PMID 19684595.
- Qu, Lei; Long, F.; Liu, X.; Kim, S.; Myers, E.W.; Peng, H. (2011). "Simultaneous recognition and segmentation of cells: application in C. elegans". Bioinformatics. 27 (20): 2895–2902. doi:10.1093/bioinformatics/btr480. PMC 3187651. PMID 21849395.
- Dufour, Alexandre; Vasily Shinin; Shahragim Tajbakhsh; Nancy Guillén-Aghion; J-C. Olivo-Marin; Christophe Zimmer (2005). "Segmenting and tracking fluorescent cells in dynamic 3-D microscopy with coupled active surfaces" (PDF). Image Processing, IEEE Transactions on 14, no. 9. pp. 1396–1410. doi:10.1109/TIP.2005.852790. Archived from the original (PDF) on 2014-03-02..
- Peng, Hanchuan; Chung, P.; Long, F.; Qu, L.; Jenett, A.; Seeds, A.; Myers, E.W.; Simpson, J.H (2011). "BrainAligner: 3D registration atlases of Drosophila brains". Nature Methods. 8 (6): 493–498. doi:10.1038/nmeth.1602. PMC 3104101. PMID 21532582.
- "Bioimage Informatics Annual Meeting".
- Bruijning, Marjolein; Visser, Marco D.; Hallmann, Caspar A.; Jongejans, Eelke; Golding, Nick (2018). "trackdem: Automated particle tracking to obtain population counts and size distributions from videos in r". Methods in Ecology and Evolution. 9 (4): 965–973. doi:10.1111/2041-210X.12975. ISSN 2041-210X.