2006 Rome municipal election
Municipal elections were held in Rome on 28–29 May 2006 to elect the Mayor of Rome and 60 members of the City Council.
| ||||||||||||||||
| Turnout | 66.0% | |||||||||||||||
|---|---|---|---|---|---|---|---|---|---|---|---|---|---|---|---|---|
| ||||||||||||||||
| ||||||||||||||||


Background
Mayoral election
The centre-left coalition was led by the outgoing mayor Walter Veltroni, while the centre-right coalition was led by the incumbent Minister of Agricolture Gianni Alemanno, a member of the National Alliance (AN) party.
Voting system
The voting system is used for all mayoral elections in Italy, in the city with a population higher than 15,000 inhabitants. Under this system voters express a direct choice for the mayor or an indirect choice voting for the party of the candidate's coalition. If no candidate receives 50% of votes, the top two candidates go to a second round after two weeks. This gives a result whereby the winning candidate may be able to claim majority support, although it is not guaranteed.
The election of the City Council is based on a direct choice for the candidate with a preference vote: the candidate with the majority of the preferences is elected. The number of the seats for each party is determined proportionally.
Results
| Candidate | Party | Coalition | First round | ||
|---|---|---|---|---|---|
| Votes | % | ||||
| Walter Veltroni | DS | The Olive Tree | 926,932 | 61.42 | |
| Gianni Alemanno | AN | House of Freedoms | 559,810 | 37.09 | |
| Others | 22,452 | 1.49 | |||
| Eligible voters | 2,341,773 | 100.00 | |||
| Voted | 1,545,085 | 65.98 | |||
| Blank or invalid ballots | 35,891 | ||||
| Total valid votes | 1,509,194 | ||||
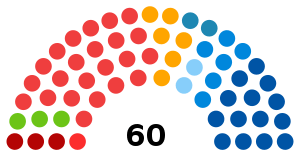
Summary of the 2006 Rome City Council election results
 | ||||||
| Parties and coalitions | Votes | % | Seats | |||
|---|---|---|---|---|---|---|
| The Olive Tree (L'Ulivo) | 441,914 | 33.8% | 23 | |||
| Veltroni List (Lista Veltroni) | LV | 80,328 | 6.1% | 4 | ||
| Communist Refoundation Party (Rifondazione Comunista) | PRC | 70,918 | 5.4% | 3 | ||
| Federation of the Greens (Federazione dei Verdi) | FdV | 62,262 | 4.8% | 3 | ||
| Others | 146,409 | 11.2% | 5 | |||
| Veltroni coalition (Centre-left) | 801,831 | 61.4% | 38 | |||
| National Alliance (Alleanza Nazionale) | AN | 254,337 | 19.5% | 14 | ||
| Forza Italia | FI | 132,869 | 10.2% | 6 | ||
| Union of the Centre (Unione di Centro) | UDC | 56,763 | 4.3% | 2 | ||
| Others | 39,909 | 3.1% | 0 | |||
| Alemanno coalition (Centre-right) | 483,878 | 37.0% | 22 | |||
| Others | 21,008 | 1.6% | 0 | |||
| Total | 1,306,717 | 100% | 60 | |||
| Votes cast / turnout | 1,545,085 | 66.0% | ||||
| Registered voters | 2,341,773 | |||||
| Source: Ministry of the Interior | ||||||
Municipi election
.png)
All the presidents of each municipio were elected on the first round. Table below shows the results for each municipio with the percentage for each coalition:
| Municipio | Centre-left | Centre-right | Elected President | Party |
|---|---|---|---|---|
| I | 61.8 | 37.3 | Giuseppe Lobefaro | DL |
| II | 53.9 | 44.7 | Guido Bottini | DS |
| III | 62.8 | 36.5 | Orlando Corsetti | DL |
| IV | 60.7 | 37.5 | Alessandro Cardente | FdV |
| V | 66.0 | 32.0 | Ivano Caradonna | DS |
| VI | 65.5 | 33.3 | Teodoro Giannini | RnP |
| VII | 64.1 | 34.2 | Roberto Mastrantonio | IdV |
| VIII | 62.2 | 35.9 | Fabrizio Scorzoni | DS |
| IX | 60.8 | 36.2 | Susana Ana Maria Fantino | PRC |
| X | 65.4 | 33.3 | Sandro Medici | PRC |
| XI | 64.1 | 34.3 | Andrea Catarci | PRC |
| XII | 57.7 | 41.8 | Patrizia Prestipino | DL |
| XIII | 59.3 | 39.3 | Paolo Ornelli | DS |
| XV | 61.6 | 37.2 | Giovanni Paris | DL |
| XVI | 61.2 | 37.4 | Fabio Bellini | DS |
| XVII | 54.5 | 44.3 | Antonella De Giusti | DL |
| XVIII | 52.1 | 46.9 | Maria Giovanna Filardi | DS |
| XIX | 57.8 | 40.2 | Fabio Lazzara | DS |
| XX | 48.1 | 50.0 | Massimiliano Fasoli | UDC |