Wuming District
| Wuming 武鸣区 · Vujmingz Gih | |
|---|---|
| District | |
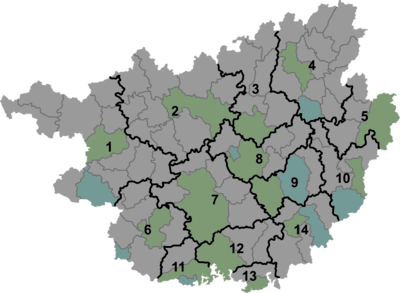 Wuming Location in Guangxi | |
| Coordinates: 23°09′32″N 108°16′26″E / 23.159°N 108.274°ECoordinates: 23°09′32″N 108°16′26″E / 23.159°N 108.274°E[1] | |
| Country | People's Republic of China |
| Autonomous region | Guangxi |
| Prefecture-level city | Nanning |
| Area[2] | |
| • Total | 3,378.36 km2 (1,304.39 sq mi) |
| Population (2010)[3] | |
| • Total | 544,478 |
| • Density | 160/km2 (420/sq mi) |
| Time zone | UTC+8 (China Standard) |
| Postal code | 5301XX |
Wuming District (simplified Chinese: 武鸣区; traditional Chinese: 武鳴區; pinyin: Wǔmíng Qū; Standard Zhuang: Vujmingz Yen) is under the administration of Nanning, the capital of Guangxi Zhuang Autonomous Region, China. Located north of the city proper, it borders the prefecture-level city of Baise to the west.
Shuangqiao (双桥镇) in Wuming District is used as the basis for the pronunciation of Standard Zhuang.
Climate
| Climate data for Wuming (1981−2030) | |||||||||||||
|---|---|---|---|---|---|---|---|---|---|---|---|---|---|
| Month | Jan | Feb | Mar | Apr | May | Jun | Jul | Aug | Sep | Oct | Nov | Dec | Year |
| Record high °C (°F) | 29.1 (84.4) |
34.5 (94.1) |
36.2 (97.2) |
37.7 (99.9) |
39.2 (102.6) |
38.2 (100.8) |
40.6 (105.1) |
38.7 (101.7) |
38.9 (102) |
36.3 (97.3) |
33.6 (92.5) |
29.7 (85.5) |
40.6 (105.1) |
| Average high °C (°F) | 17.1 (62.8) |
177 (351) |
21 (70) |
26.9 (80.4) |
30.6 (87.1) |
32.4 (90.3) |
33.4 (92.1) |
33.5 (92.3) |
320.3 (608.5) |
29.0 (84.2) |
247.6 (477.7) |
20.2 (68.4) |
82.4 (180.4) |
| Daily mean °C (°F) | 13.1 (55.6) |
14.7 (58.5) |
17.9 (64.2) |
22.8 (73) |
26.1 (79) |
28.0 (82.4) |
28.7 (83.7) |
28.7 (83.7) |
27.2 (81) |
23.9 (75) |
19.3 (66.7) |
15.0 (59) |
22.1 (71.8) |
| Average low °C (°F) | 10.4 (50.7) |
12.2 (54) |
15.3 (59.5) |
19.9 (67.8) |
22.9 (73.2) |
25.0 (77) |
25.6 (78.1) |
25.4 (77.7) |
23.7 (74.7) |
20.4 (68.7) |
15.7 (60.3) |
11.5 (52.7) |
19 (66.2) |
| Record low °C (°F) | 0.7 (33.3) |
2.5 (36.5) |
2.8 (37) |
8.7 (47.7) |
13.4 (56.1) |
16.8 (62.2) |
20.1 (68.2) |
20.8 (69.4) |
16.0 (60.8) |
10.0 (50) |
4.0 (39.2) |
0.4 (32.7) |
0.4 (32.7) |
| Average precipitation mm (inches) | 47.6 (1.874) |
47.4 (1.866) |
62.6 (2.465) |
81.4 (3.205) |
195.0 (7.677) |
207.3 (8.161) |
212.4 (8.362) |
166.8 (6.567) |
91.5 (3.602) |
52.2 (2.055) |
48.7 (1.917) |
26.0 (1.024) |
1,238.9 (48.775) |
| Average relative humidity (%) | 76 | 79 | 79 | 78 | 77 | 79 | 79 | 78 | 75 | 72 | 72 | 71 | 76 |
| Source: China Meteorological Data Service Center | |||||||||||||
References
External links
This article is issued from
Wikipedia.
The text is licensed under Creative Commons - Attribution - Sharealike.
Additional terms may apply for the media files.