Tropopause
The tropopause is the boundary in the Earth's atmosphere between the troposphere and the stratosphere. It is a thermodynamic gradient stratification layer, marking the end of troposphere. It lies, on average, at 17 kilometres (11 mi) above equatorial regions, and above 9 kilometres (5.6 mi) over the polar regions.
Definition

Going upward from the surface, it is the point where air ceases to cool with height, and becomes almost completely dry. More formally, the tropopause is the region of the atmosphere where the environmental lapse rate changes from positive, as it behaves in the troposphere, to the stratospheric negative one. Following is the exact definition used by the World Meteorological Organization:
The boundary between the troposphere and the stratosphere, where an abrupt change in lapse rate usually occurs. It is defined as the lowest level at which the lapse rate decreases to 2 °C/km or less, provided that the average lapse rate between this level and all higher levels within 2 km does not exceed 2 °C/km.[1]
The tropopause as defined above renders as a first-order discontinuity surface, that is, temperature as a function of height varies continuously through the atmosphere but the temperature gradient does not.[2]
Location
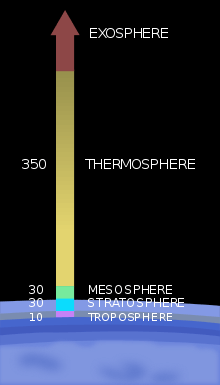
The troposphere is the lowest layer of the Earth's atmosphere; it is located right above the planetary boundary layer, and is the layer in which most weather phenomena take place. The troposphere contains the boundary layer, and ranges in height from an average of 9 km (5.6 mi; 30,000 ft) at the poles, to 17 km (11 mi; 56,000 ft) at the Equator.[3][4] In the absence of inversions and not considering moisture, the temperature lapse rate for this layer is 6.5 °C per kilometer, on average, according to the U.S. Standard Atmosphere.[5] A measurement of both the tropospheric and the stratospheric lapse rates helps identifying the location of the tropopause, since temperature increases with height in the stratosphere, and hence the lapse rate becomes negative. The tropopause location coincides with the lowest point at which the lapse rate falls below a prescribed threshold.
Since the tropopause responds to the average temperature of the entire layer that lies underneath it, it is at its peak levels over the Equator, and reaches minimum heights over the poles. On account of this, the coolest layer in the atmosphere lies at about 17 km over the equator. Due to the variation in starting height, the tropopause extremes are referred to as the equatorial tropopause and the polar tropopause.
Given that the lapse rate is not a conservative quantity when the tropopause is considered for stratosphere-troposphere exchanges studies, there exists an alternative definition named dynamic tropopause.[6] It is formed with the aid of potential vorticity, which is defined as the product of the isentropic density, i.e. the density that arises from using potential temperature as the vertical coordinate, and the absolute vorticity, given that this quantity attains quite different values for the troposphere and the stratosphere.[7] Instead of using the vertical temperature gradient as the defining variable, the dynamic tropopause surface is expressed in potential vorticity units (PVU).[nb 1] Given that the absolute vorticity is positive in the Northern Hemisphere and negative in the Southern Hemisphere, the threshold value should be taken as positive north of the Equator and negative south of it.[9] Theoretically, to define a global tropopause in this way, the two surfaces arising from the positive and negative thresholds need to be matched near the equator using another type of surface such as a constant potential temperature surface. Nevertheless, the dynamic tropopause is useless at equatorial latitudes because the isentropes are almost vertical.[8] For the extratropical tropopause in the Northern Hemisphere the WMO established a value of 1.5 PVU,[8] but greater values ranging between 2 and 3.5 PVU have been traditionally used.[10]
It is also possible to define the tropopause in terms of chemical composition.[11] For example, the lower stratosphere has much higher ozone concentrations than the upper troposphere, but much lower water vapor concentrations, so appropriate cutoffs can be used.
Phenomena
The tropopause is not a "hard" boundary. Vigorous thunderstorms, for example, particularly those of tropical origin, will overshoot into the lower stratosphere and undergo a brief (hour-order or less) low-frequency vertical oscillation.[12] Such oscillation sets up a low-frequency atmospheric gravity wave capable of affecting both atmospheric and oceanic currents in the region.
Most commercial aircraft are flown in the lower stratosphere, just above the tropopause, where clouds are usually absent, as also are significant weather perturbations.[13]
See also
Notes
References
- ↑ International Meteorological Vocabulary (2nd ed.). Geneva: Secretariat of the World Meteorological Organization. 1992. p. 636. ISBN 92-63-02182-1.
- ↑ Panchev 1985, p. 129.
- ↑ Hoinka, K. P. (1999). "Temperature, Humidity, and Wind at the Global Tropopause". Monthly Weather Review. American Meteorological Society. 127: 2248–2265. Bibcode:1999MWRv..127.2248H. doi:10.1175/1520-0493(1999)127<2248:THAWAT>2.0.CO;2.
- ↑ Gettelman, A.; Salby, M. L.; Sassi, F. (2002). "Distribution and influence of convection in the tropical tropopause region". Journal of Geophysical Research. American Geophysical Union. 107. Bibcode:2002JGRD..107.4080G. CiteSeerX 10.1.1.469.189. doi:10.1029/2001JD001048.
- ↑ Petty 2008, p. 112.
- ↑ Andrews, Holton & Leovy 1987, p. 371.
- ↑ Hoskins, B. J.; McIntyre, M. E.; Robertson, A. W. (1985). "On the use and significance of isentropic potential vorticity maps". Quarterly Journal of the Royal Meteorological Society. 111: 877–946. Bibcode:1985QJRMS.111..877H. doi:10.1002/qj.49711147002.
- 1 2 3 Tuck, A. F.; Browell, E. V.; Danielsen, E. F.; Holton, J. R.; Hoskins, B. J.; Johnson, D. R.; Kley, D.; Krueger, A. J.; Megie, G.; Newell, R. E.; Vaughan, G. (1985). "Strat-trop exchange". Atmospheric ozone 1985 – WMO Global Ozone Research and Monitoring Project Report No. 16. World Meteorological Organization. 1: 151–240.
- ↑ Hoinka, Klaus P. (December 1998). "Statistics of the Global Tropopause Pressure". Journal of Climate. American Meteorological Society (126): 3303–3325.
- ↑ Zängl, Günther; Hoinka, Klaus P. (15 July 2001). "The Tropopause in the Polar Regions". Journal of Climate. 14: 3117 , &ndash,  , 3139. Bibcode:2001JCli...14.3117Z. doi:10.1175/1520-0442(2001)014<3117:ttitpr>2.0.co;2.
- ↑ L. L. Pan; W. J. Randel; B. L. Gary; M. J. Mahoney; E. J. Hintsa (2004). "Definitions and sharpness of the extratropical tropopause: A trace gas perspective". Journal of Geophysical Research. 109: D23103. Bibcode:2004JGRD..10923103P. doi:10.1029/2004JD004982.
- ↑ Shenk, W. E. (1974). "Cloud top height variability of strong convective cells". Journal of Applied Meteorology. American Meteorological Society. 13: 918–922. Bibcode:1974JApMe..13..917S. doi:10.1175/1520-0450(1974)013<0917:cthvos>2.0.co;2.
- ↑ Petty 2008, p. 21.
Bibliography
- Andrews, D. G.; Holton, J. R.; Leovy, C. B. (1987). R., Dmowska; Holton, J. R., eds. Middle Atmosphere Dynamics. Academic Press. p. 371. ISBN 0-12-058576-6.
- Panchev, Stoǐcho (1985) [1981]. Dynamic meteorology. D. Reidel Publishing Company. ISBN 90-277-1744-3.
- Petty, Grant W. (2008). A First Course in Atmospheric Thermodynamics. Madison, WI: Sundog Publishing. ISBN 978-0-9729033-2-5.