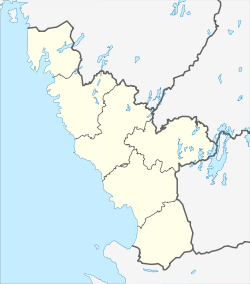
Torup, Halland
| Torup | |
|---|---|
 Torup 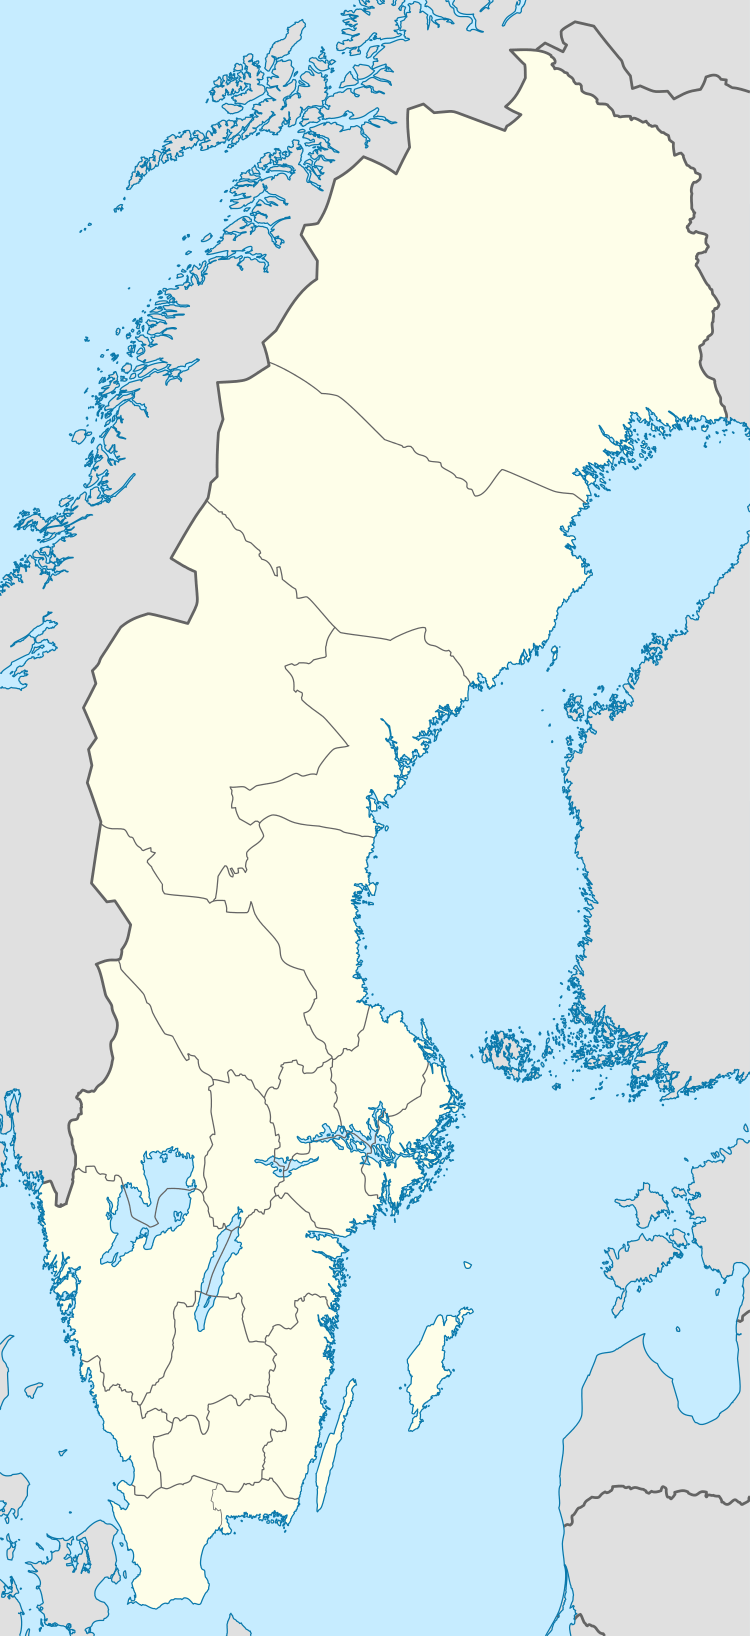 Torup | |
| Coordinates: 56°57′28.08″N 13°4′51.24″E / 56.9578000°N 13.0809000°ECoordinates: 56°57′28.08″N 13°4′51.24″E / 56.9578000°N 13.0809000°E | |
| Country | Sweden |
| Province | Halland |
| County | Halland County |
| Municipality | Hylte Municipality |
| Area[1] | |
| • Total | 1.63 km2 (0.63 sq mi) |
| Population (31 December 2010)[1] | |
| • Total | 1,183 |
| • Density | 726/km2 (1,880/sq mi) |
| Time zone | UTC+1 (CET) |
| • Summer (DST) | UTC+2 (CEST) |
Torup is a locality situated in Hylte Municipality, Halland County, Sweden with 1,183 inhabitants in 2010.[1]
Climate
Torup has a transitional oceanic climate with considerable moderate continental attributes. It is consistently the rainiest location in the country of the official 100 reference weather stations used by SMHI for its monthly reports. Considering its southerly latitude in the country, cold extremes are above average. Frost has been recorded even in the midst of summer. Temperature normals however do not differ much from other southern Sweden localities, with winter highs most often staying above freezing and summers being warm.
| Climate data for Torup (temperatures 2002-2015; precipitation Jan 2002-May 2018) | |||||||||||||
|---|---|---|---|---|---|---|---|---|---|---|---|---|---|
| Month | Jan | Feb | Mar | Apr | May | Jun | Jul | Aug | Sep | Oct | Nov | Dec | Year |
| Record high °C (°F) | 9.9 (49.8) |
12.2 (54) |
19.9 (67.8) |
28.6 (83.5) |
29.2 (84.6) |
33.1 (91.6) |
34.0 (93.2) |
35.5 (95.9) |
28.3 (82.9) |
22.1 (71.8) |
14.6 (58.3) |
11.2 (52.2) |
35.5 (95.9) |
| Average high °C (°F) | 1.3 (34.3) |
1.9 (35.4) |
6.1 (43) |
11.9 (53.4) |
16.9 (62.4) |
19.8 (67.6) |
22.4 (72.3) |
21.4 (70.5) |
17.3 (63.1) |
11.1 (52) |
6.3 (43.3) |
3.0 (37.4) |
11.6 (52.9) |
| Daily mean °C (°F) | −1.2 (29.8) |
−1.0 (30.2) |
1.8 (35.2) |
6.3 (43.3) |
11.0 (51.8) |
14.1 (57.4) |
16.9 (62.4) |
16.2 (61.2) |
12.3 (54.1) |
7.3 (45.1) |
3.9 (39) |
0.6 (33.1) |
7.3 (45.1) |
| Average low °C (°F) | −3.7 (25.3) |
−3.9 (25) |
−2.4 (27.7) |
0.7 (33.3) |
5.0 (41) |
8.3 (46.9) |
11.4 (52.5) |
11.0 (51.8) |
7.4 (45.3) |
3.4 (38.1) |
1.4 (34.5) |
−1.7 (28.9) |
3.0 (37.4) |
| Record low °C (°F) | −31.4 (−24.5) |
−29.5 (−21.1) |
−23.6 (−10.5) |
−11.5 (11.3) |
−7.5 (18.5) |
−2.7 (27.1) |
−0.7 (30.7) |
−2.4 (27.7) |
−5.8 (21.6) |
−13.6 (7.5) |
−18.3 (−0.9) |
−28.9 (−20) |
−31.4 (−24.5) |
| Average precipitation mm (inches) | 116.0 (4.567) |
75.4 (2.969) |
60.1 (2.366) |
54.3 (2.138) |
70.2 (2.764) |
104.4 (4.11) |
111.8 (4.402) |
146.7 (5.776) |
99.4 (3.913) |
120.4 (4.74) |
110.0 (4.331) |
125.9 (4.957) |
1,194.6 (47.031) |
| Source #1: SMHI Average Precipitation 2002-2018[2] | |||||||||||||
| Source #2: SMHI Average Data 2002-2015[3] | |||||||||||||
References
- 1 2 3 "Tätorternas landareal, folkmängd och invånare per km2 2005 och 2010" (in Swedish). Statistics Sweden. 14 December 2011. Archived from the original on 10 January 2012. Retrieved 10 January 2012.
- ↑ "SMHI Open Data". SMHI. September 2018. Retrieved 27 September 2018.
- ↑ "Statistics from Weather Stations" (in Swedish). SMHI. February 2016. Retrieved 21 February 2016.
| Wikimedia Commons has media related to Torup, Halland. |
This article is issued from
Wikipedia.
The text is licensed under Creative Commons - Attribution - Sharealike.
Additional terms may apply for the media files.