List of shrinking cities in the United States
The following municipalities in the United States have lost at least 20% of their population, from a peak of over 100,000, since 1950. In all but a few cases, the surrounding metropolitan areas and urban areas (including the shrinking metropolitan areas) have increased in population.
A city's loss in population is not always permanent. In particular, in 2014 it was noted by the Metropolitan Washington Council of Governments that the population of Washington, D.C. could approach 900,000 by 2040.[1]
Geography
A patchwork of cities across the northern United States, because of their vibrant industrial economies, were referred to collectively as "the Foundry of the Nation".[2] These are also referred to as the Manufacturing Belt or the Factory Belt. This includes most of the cities of the Midwest out to the Mississippi River, and many of those in the New England and Mid-Atlantic states, particularly those away from the Eastern Seaboard. After World War II, the cities in the area among the nation's 100 largest in the middle-20th century had population that had fallen most by the century's end.[3]
At the center lies an area stretching from northern Indiana and southern Michigan in the west to Upstate New York in the east, where local tax revenues still rely more heavily on manufacturing than on any other sector (by far the largest contiguous area of the U.S. where this is the case).[4]
Shrinking cities

.jpg)


| City | 1950 population |
Peak population |
Peak population year |
2010 population |
Decline from peak |
% decline from peak |
|---|---|---|---|---|---|---|
| Akron, Ohio | 274,605 | 290,351 | 1960 | 199,110 | 91,241 | 34.5% |
| Albany, New York | 134,995 | 134,995 | 1950 | 97,856 | 37,139 | 27.5% |
| Baltimore, Maryland | 949,708 | 949,708 | 1950 | 620,961 | 328,747 | 34.6% |
| Birmingham, Alabama | 326,037 | 340,887 | 1960 | 212,237 | 128,650 | 37.7% |
| Boston, Massachusetts | 801,444 | 801,444 | 1950 | 617,594 | 183,850 | 22.9% |
| Buffalo, New York | 580,132 | 580,132 | 1950 | 270,240 | 309,892 | 53.4% |
| Camden, New Jersey | 124,555 | 124,555 | 1950 | 77,344 | 47,211 | 37.9% |
| Canton, Ohio | 116,912 | 116,912 | 1950 | 73,007 | 43,905 | 37.6% |
| Chicago, Illinois | 3,620,962 | 3,620,962 | 1950 | 2,695,598 | 925,364 | 25.6% |
| Cincinnati, Ohio | 503,998 | 503,998 | 1950 | 296,943 | 207,055 | 41.1% |
| Cleveland, Ohio | 914,808 | 914,808 | 1950 | 396,815 | 517,993 | 56.6% |
| Dayton, Ohio | 243,872 | 262,332 | 1960 | 141,527 | 120,805 | 46.1% |
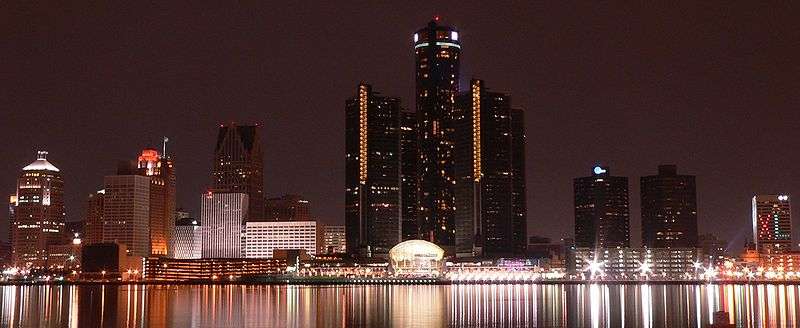
| Detroit, Michigan | 1,849,568 | 1,849,568 | 1950 | 713,777 | 1,135,791 | 61.4% |
| Erie, Pennsylvania | 130,803 | 138,440 | 1960 | 101,786 | 36,654 | 26.5% |
| Flint, Michigan | 163,413 | 196,940 | 1960 | 102,434 | 94,506 | 48% |
| Gary, Indiana | 133,911 | 178,320 | 1960 | 80,294 | 98,026 | 55% |
| Hammond, Indiana | 87,595 | 111,698 | 1960 | 80,830 | 30,868 | 27.6% |
| Hartford, Connecticut | 177,397 | 177,397 | 1950 | 124,060 | 53,337 | 30.1% |
| Jersey City, New Jersey | 299,017 | 316,715 | 1930 | 247,597 | 69,118 | 21.8% |
| Minneapolis, Minnesota | 521,718 | 521,718 | 1950 | 382,578 | 139,140 | 26.7% |
| Newark, New Jersey | 438,776 | 442,337 | 1930 | 277,140 | 165,197 | 37.3% |
| New Haven, Connecticut | 164,443 | 164,443 | 1950 | 129,779 | 34,664 | 21.1% |
| New Orleans, Louisiana** | 570,445 | 627,525 | 1960 | 384,320 | 243,205 | 38.8% |
| Niagara Falls, New York | 90,872 | 102,394 | 1960 | 50,194 | 52,200 | 51% |
| Philadelphia, Pennsylvania | 2,071,605 | 2,071,605 | 1950 | 1,526,006 | 545,599 | 26.3% |
| Pittsburgh, Pennsylvania | 676,806 | 676,806 | 1950 | 305,704 | 371,102 | 54.8% |
| Providence, Rhode Island | 248,674 | 253,504 | 1940 | 178,042 | 74,939 | 29.6% |
| Reading, Pennsylvania | 109,320 | 111,171 | 1930 | 88,082 | 23,089 | 20.8% |
| Rochester, New York | 332,488 | 332,488 | 1950 | 210,565 | 121,923 | 36.7% |
| Scranton, Pennsylvania | 125,536 | 143,333 | 1930 | 76,089 | 67,244 | 46.9% |
| Somerville, Massachusetts | 102,351 | 103,908 | 1930 | 75,754 | 28,154 | 27.1% |
| South Bend, Indiana | 115,911 | 132,445 | 1960 | 101,168 | 31,277 | 23.6% |
| St. Louis, Missouri | 856,796 | 856,796 | 1950 | 319,294 | 537,502 | 62.7% |
| Syracuse, New York | 220,583 | 220,583 | 1950 | 145,170 | 75,413 | 34.2% |
| Toledo, Ohio | 303,616 | 383,818 | 1970 | 287,208 | 96,610 | 25.2% |
| Trenton, New Jersey | 128,009 | 128,009 | 1950 | 84,913 | 43,096 | 33.7% |
| Utica, New York | 100,489 | 101,740 | 1930 | 62,235 | 39,505 | 38.8% |
| Washington, D.C. | 802,178 | 802,178 | 1950 | 601,723 | 200,455 | 25% |
| Wilmington, Delaware | 110,356 | 112,504 | 1940 | 70,851 | 41,653 | 37% |
| Youngstown, Ohio | 168,330 | 170,002 | 1930 | 66,982 | 103,020 | 60.6% |
Note: ** New Orleans' population is registering large increases post-Hurricane Katrina.
* Chicago registered 3 decades of population declines (1950 thru 1980) before growing again.
See also
- Commuter town
- Decline of Detroit
- Depopulation of the Great Plains
- Rural flight
- Urban sprawl
- Urban prairie
- Greyfield
- Urbanization
- White flight
- Black flight
International:
References
- ↑ Malouff, Dan (April 17, 2014). "By 2040, DC's population could be close to 900,000". Greater Greater Washington. Retrieved June 16, 2016.
- ↑ "Sun On The Snow Belt (editorial)". Chicago Tribune. August 25, 1985. Retrieved October 7, 2015.
- ↑ Hansen, Jeff; et al. (March 10, 2007). "Which Way Forward?". The Birmingham News. Retrieved October 7, 2015.
- ↑ "Rural Classifications: 2004 County Typology Codes". USDA Economic Research Service. Retrieved October 7, 2015.