Colorfulness


Colorfulness, chroma and saturation are attributes of perceived color relating to chromatic intensity. As defined formally by the International Commission on Illumination (CIE) they respectively describe three different aspects of chromatic intensity, but the terms are often used loosely and interchangeably in contexts where these aspects are not clearly distinguished.
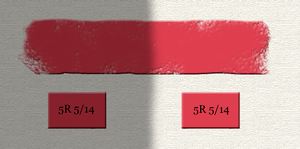
Colorfulness is the "attribute of a visual perception according to which the perceived color of an area appears to be more or less chromatic".[1][2] A note accompanying this definition in effect implies that the perception of colorfulness evoked by an object depends not only on its spectral reflectance but also on the strength of the illumination, and increases with the latter unless the brightness is very high.
Chroma is the "colorfulness of an area judged as a proportion of the brightness of a similarly illuminated area that appears white or highly transmitting".[3][2] A note accompanying this definition in effect implies that an object with a given spectral reflectance exhibits approximately constant chroma for all levels of illumination, unless the brightness is very high. Thus if a uniformly colored object is unevenly lit, it will generally exhibit greater colorfulness where it is most strongly lit, but will be perceived to have the same chroma over its entire surface. While colorfulness is an attribute of the color of the light reflected from different parts of the object, chroma is an attribute of the color seen as belonging to the object itself (called an object color[4]),and describes how different from a grey of the same lightness such an object color appears to be.[5]
Saturation is the "colorfulness of an area judged in proportion to its brightness",[6][2] which in effect is the perceived freedom from whitishness of the light coming from the area.[7] A note accompanying this definition in effect indicates that an object with a given spectral reflectance exhibits approximately constant saturation for all levels of illumination, unless the brightness is very high. Since the chroma and lightness of an object are its colorfulness and brightness judged in proportion to the same thing ("the brightness of a similarly illuminated area that appears white or highly transmitting"), the saturation of the light coming from that object is in effect the chroma of the object judged in proportion to its lightness. On a Munsell hue page, lines of uniform saturation thus tend to radiate from near the black point, while lines of uniform chroma are vertical.[7]
As colorfulness, chroma and saturation are defined as attributes of perception they can not be physically measured as such, but they can be quantified in relation to psychometric scales intended to be perceptually even, for example the chroma scales of the Munsell system.
Saturation
The saturation of a color is determined by a combination of light intensity and how much it is distributed across the spectrum of different wavelengths. The purest (most saturated) color is achieved by using just one wavelength at a high intensity, such as in laser light. If the intensity drops, then as a result the saturation drops. To desaturate a color of given intensity in a subtractive system (such as watercolor), one can add white, black, gray, or the hue's complement.
Various correlates of saturation follow.
- CIELUV and CIELAB
In CIELUV, saturation is equal to the chroma normalized by the lightness:

where (u′n, v′n) is the chromaticity of the white point, and chroma is defined below.[8]
By analogy, in CIELAB this would yield:

The CIE has not formally recommended this equation since CIELAB has no chromaticity diagram, and this definition therefore lacks direct correlation with older concepts of saturation.[9] Nevertheless, this equation provides a reasonable predictor of saturation, and demonstrates that adjusting the lightness in CIELAB while holding (a*, b*) fixed does affect the saturation.
But the following formula is in agreement with the human perception of saturation: The formula proposed by Eva Lübbe is in agreement with the verbal definition of Manfred Richter: Saturation is the proportion of pure chromatic color in the total color sensation.[10]

where Sab is the saturation, L* the lightness and C*ab is the chroma of the color.
- CIECAM02
In CIECAM02, saturation equals the square root of the colorfulness divided by the brightness:

This definition is inspired by experimental work done with the intention of remedying CIECAM97s's poor performance.[11][12] M is proportional to the chroma C (M = CFL0.25), thus the CIECAM02 definition bears some similarity to the CIELUV definition. An important difference is that the CIECAM02 model accounts for the viewing conditions through the parameter FL.[11]
- HSL and HSV
Saturation is also one of three coordinates in the HSL and HSV color spaces. However, in the HSL color space saturation exists independently of lightness. I.e. both a very light color and a very dark color can be heavily saturated in HSL; whereas in the previous definitions—as well as in the HSV color space—colors approaching white all feature low saturation.
Excitation purity

The excitation purity (purity for short) of a stimulus is the difference from the illuminant's white point to the furthest point on the chromaticity diagram with the same hue (dominant wavelength for monochromatic sources); using the CIE 1931 color space:[13]

where (xn, yn) is the chromaticity of the white point and (xI, yI) is the point on the perimeter whose line segment to the white point contains the chromaticity of the stimulus. Different color spaces, such as CIELAB or CIELUV may be used, and will yield different results.
Chroma in CIE 1976 L*a*b* and L*u*v* color spaces
The naïve definition of saturation does not specify its response function. In the CIE XYZ and RGB color spaces, the saturation is defined in terms of additive color mixing, and has the property of being proportional to any scaling centered at white or the white point illuminant. However, both color spaces are nonlinear in terms of psychovisually perceived color differences. It is also possible—and sometimes desirable—to define a saturation-like quantity that is linearized in term of the psychovisual perception.
In the CIE 1976 L*a*b* and L*u*v* color spaces, the unnormalized chroma is the radial component of the cylindrical coordinate CIE L*C*h (lightness, chroma, hue) representation of the L*a*b* and L*u*v* color spaces, also denoted as CIE L*C*h(a*b*) or CIE L*C*h for short, and CIE L*C*h(u*v*). The transformation of (a*, b*) to (C*ab, hab) is given by:


and analogously for CIE L*C*h(u*v*).
The chroma in the CIE L*C*h(a*b*) and CIE L*C*h(u*v*) coordinates has the advantage of being more psychovisually linear, yet they are non-linear in terms of linear component color mixing. And therefore, chroma in CIE 1976 L*a*b* and L*u*v* color spaces is very much different from the traditional sense of "saturation".
Chroma in color appearance models
Another, psychovisually even more accurate, but also more complex method to obtain or specify the saturation is to use a color appearance model. Here, the chroma color appearance parameter might (depending on the color appearance model) be intertwined with e.g. the physical brightness of the illumination or the characteristics of the emitting/reflecting surface, which is more sensible psychovisually.
References
- ↑ "colourfulness | eilv". eilv.cie.co.at8 k. Archived from the original on 2017-08-06. Retrieved 2017-12-20.
- 1 2 3 Fairchild, Mark (2013). Color Appearance Models. John Wiley & Sons. , page 87.
- ↑ "CIE e-ILV 17-139". Archived from the original on 2017-04-10.
- ↑ "CIE e-ILV 17-831". Archived from the original on 2017-04-10.
- ↑ "The Dimensions of Colour". www.huevaluechroma.com. Archived from the original on 2017-03-30. Retrieved 2017-04-10.
- ↑ "CIE e-ILV 17-1136". Archived from the original on 2017-04-10.
- 1 2 "The Dimensions of Colour". www.huevaluechroma.com. Archived from the original on 2017-03-30. Retrieved 2017-04-10.
- ↑ Schanda, János (2007). Colorimetry: Understanding the CIE System. Wiley Interscience. ISBN 978-0-470-04904-4. Archived from the original on 2017-01-17. , page 88.
- ↑ Hunt, Robert William Gainer (1993). Leslie D. Stroebel, Richard D. Zakia, ed. The Focal Encyclopedia of Photography. Focal Press. p. 124. ISBN 0-240-51417-3. Archived from the original on 2017-01-17.
- ↑ Lübbe, Eva (2010). Colours in the Mind - Colour Systems in Reality- A formula for colour saturation. [Book on Demand]. ISBN 978-3-7881-4057-1.
- 1 2 Moroney, Nathan; Fairchild, Mark D.; Hunt, Robert W.G.; Li, Changjun; Luo, M. Ronnier; Newman, Todd (November 12, 2002). IS&T/SID Tenth Color Imaging Conference. The CIECAM02 Color Appearance Model (PDF). Scottsdale, Arizona: The Society for Imaging Science and Technology. ISBN 0-89208-241-0.
- ↑ Juan, Lu-Yin G.; Luo, Ming R. (June 2002). Robert Chung, Allan Rodrigues, eds. Magnitude estimation for scaling saturation. 9th Congress of the International Colour Association. Proceedings of SPIE. 4421. pp. 575–578. doi:10.1117/12.464511.
- ↑ Stroebel, Leslie D.; Zakia, Richard D. (1993). The Focal Encyclopedia of Photography (3E ed.). Focal Press. p. 121. ISBN 0-240-51417-3. Archived from the original on 2017-01-17.
Color topics | ||||||||
|---|---|---|---|---|---|---|---|---|
| Color science |
|  | ||||||
| Color philosophy |
| |||||||
| Color terms |
| |||||||
| Color organizations | ||||||||
| Lists | ||||||||
| Related | ||||||||
| ||||||||