Roman economy
During the Roman Republic, the Roman economy was largely agrarian, centered on the trading of commodities such as grain and wine.[2] Financial markets were established through such trade, and financial institutions which extended credit for personal use and public infrastructure, were established primarily through inter-family wealth.[3] In times of agricultural and cash shortfall, Roman officials and moneyers tended to respond by coining money; this happened during the prolonged crisis of the First Punic War, and created economic distortion and difficulties. Beginning in the early Roman Empire, the economy became monetized to a near-universal extent, in the sense of using money to express prices and debts, and a basic banking system was formed.[4] Emperors issued coinage stamped with their portraits to disseminate propaganda, to create public goodwill, and to symbolise their wealth and power.[5] The Roman Imperial economy was often unstable, inflated in part by Emperors who issued money to fund high-profile imperial projects such as public building works, or costly wars that offered opportunities for propaganda, but little or no material gain.[4]

There was no central bank to monitor the money supply and control economic conditions, and nearly no regulation of the banking system.[7] The setup of the banking system under the Empire allowed the exchange of extremely large sums without the physical transfer of coins, which led to fiat money. With no central bank, a professional deposit banker (argentarius, coactor argentarius, or later nummularius) received and held deposits for a fixed or indefinite term, and lent money to third parties.[8] Generally, available capital exceeded the amount needed by borrowers, so loans were made and credit was extended on risky terms.[9] The senatorial elite were involved heavily in private lending, both as creditors and borrowers, making loans from their personal fortunes on the basis of social connections.[4] Banks of classical antiquity typically kept less in reserves than the full total of customers' deposits, as they had no incentive to ensure that customers' deposits would be insured in the event of a bank run.[4] It was common consensus among Romans at the time, especially due to Seneca's ideologies, that anyone involved in commerce should have access to credit.[10] This tendency toward fiat money caused the money supply to fluctuate consistently.[10]
Emperors of the Antonine and Severan dynasties overall debased the currency, particularly the denarius, under the pressures of meeting military payrolls.[11] Sudden inflation during the reign of Commodus damaged the credit market.[9] In the mid-200s, the supply of specie contracted sharply.[12] Conditions during the Crisis of the Third Century—such as reductions in long-distance trade, disruption of mining operations, and the physical transfer of gold coinage outside the empire by invading enemies—greatly diminished the money supply and the banking sector by the year 300.[13] Although Roman coinage had long been fiat money or fiduciary currency, general economic anxieties came to a head under Aurelian, and bankers lost confidence in coins legitimately issued by the central government. Despite Diocletian's introduction of the gold solidus and monetary reforms, the credit market of the Empire never recovered its former robustness.[9]
Mining and metallurgy
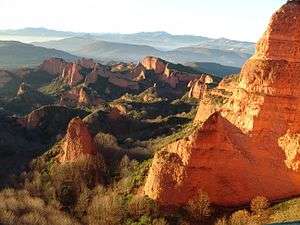
The main mining regions of the Empire were Spain (gold, silver, copper, tin, lead); Gaul (gold, silver, iron); Britain (mainly iron, lead, tin), the Danubian provinces (gold, iron); Macedonia and Thrace (gold, silver); and Asia Minor (gold, silver, iron, tin). Intensive large-scale mining—of alluvial deposits, and by means of open-cast mining and underground mining—took place from the reign of Augustus up to the early 3rd century AD, when the instability of the Empire disrupted production. The gold mines of Dacia, for instance, were no longer available for Roman exploitation after the province was surrendered in 271. Mining seems to have resumed to some extent during the 4th century.[14]

Hydraulic mining, which Pliny referred to as ruina montium ("ruin of the mountains"), allowed base and precious metals to be extracted on a proto-industrial scale.[16] The total annual iron output is estimated at 82,500 tonnes,.[17] Copper was produced at an annual rate of 15,000 t,[18] and lead at 80,000 t,[19] both production levels unmatched until the Industrial Revolution;[20] Spain alone had a 40 percent share in world lead production.[21] The high lead output was a by-product of extensive silver mining which reached 200 t per annum.[22] At its peak around the mid-2nd century AD, the Roman silver stock is estimated at 10,000 t, five to ten times larger than the combined silver mass of medieval Europe and the Caliphate around 800 AD.[23] As an indication of the scale of Roman metal production, lead pollution in the Greenland ice sheet quadrupled over its prehistoric levels during the Imperial era, and dropped again thereafter.[24]
The invention and widespread application of hydraulic mining, namely hushing and ground-sluicing, aided by the ability of the Romans to plan and execute mining operations on a large scale, allowed various base and precious metals to be extracted on a proto-industrial scale only rarely, if ever, matched until the Industrial Revolution.[25] The most common fuel by far for smelting and forging operations, as well as heating purposes, was wood and particularly charcoal, which is nearly twice as efficient.[26] In addition, coal was mined in some regions to a fairly large extent: Almost all major coalfields in Roman Britain were exploited by the late 2nd century AD, and a lively trade along the English North Sea coast developed, which extended to the continental Rhineland, where bituminous coal was already used for the smelting of iron ore.[27]
| Output per annum | Comment | |
|---|---|---|
| Iron | 82,500 t[28] | Based on "conservative estimate" of iron production at 1.5 kg per head, assuming a population size of 55m,.[29] |
| Copper | 15,000 t[30] | Largest preindustrial producer[31] |
| Lead | 80,000 t[32] | Largest preindustrial producer[33] |
| Silver | 200 t[34] | At its peak around the mid-2nd century AD, Roman stock is estimated at 10,000 t, five to ten times larger than the combined silver mass of medieval Europe and the Caliphate around 800 AD.[35] |
| Gold | 9 t[36] | Production in Asturia, Callaecia, and Lusitania (all Iberian Peninsula) alone |
Transportation and communication

The Roman Empire completely encircled the Mediterranean, which they called "our sea" (mare nostrum).[38] Roman sailing vessels navigated the Mediterranean as well as the major rivers of the Empire, including the Guadalquivir, Ebro, Rhône, Rhine, Tiber and Nile.[39] Transport by water was preferred where possible, as moving commodities by land was more difficult.[40] Vehicles, wheels, and ships indicate the existence of a great number of skilled woodworkers.[41]
Land transport utilized the advanced system of Roman roads. The in-kind taxes paid by communities included the provision of personnel, animals, or vehicles for the cursus publicus, the state mail and transport service established by Augustus. Relay stations were located along the roads every seven to twelve Roman miles, and tended to grow into a village or trading post.[42] A mansio (plural mansiones) was a privately run service station franchised by the imperial bureaucracy for the cursus publicus. The support staff at such a facility included muleteers, secretaries, blacksmiths, cartwrights, a veterinarian, and a few military police and couriers. The distance between mansiones was determined by how far a wagon could travel in a day.[42] Mules were the animal most often used for pulling carts, travelling about 4 mph.[43] As an example of the pace of communication, it took a messenger a minimum of nine days to travel to Rome from Mainz in the province of Germania Superior, even on a matter of urgency.[44] In addition to the mansiones, some taverns offered accommodations as well as food and drink; one recorded tab for a stay showed charges for wine, bread, mule feed, and the services of a prostitute.[45]
Trade and commodities
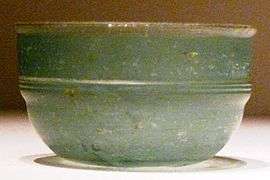
Right image:Green Roman glass cup unearthed from an Eastern Han Dynasty (25-220 AD) tomb, Guangxi, China; the first Roman glassware discovered in China, dating to the early 1st century BC, was excavated from a Western Han tomb in the southern port city of Guangzhou, most likely arriving via the Indian Ocean and South China Sea.[47]
Roman provinces traded among themselves, but trade extended outside the frontiers to regions as far away as China and India.[48] The main commodity was grain.[49] Chinese trade was mostly conducted overland through middle men along the Silk Road; Indian trade, however, also occurred by sea from Egyptian ports on the Red Sea. Also traded were olive oil, various foodstuffs, garum (fish sauce), slaves, ore and manufactured metal objects, fibres and textiles, timber, pottery, glassware, marble, papyrus, spices and materia medica, ivory, pearls, and gemstones.[50]
Though most provinces were capable of producing wine, regional varietals were desirable and wine was a central item of trade. Shortages of vin ordinaire were rare.[51] The major suppliers for the city of Rome were the west coast of Italy, southern Gaul, the Tarraconensis region of Spain, and Crete. Alexandria, the second-largest city, imported wine from Laodicea in Syria and the Aegean.[52] At the retail level, taverns or speciality wine shops (vinaria) sold wine by the jug for carryout and by the drink on premises, with price ranges reflecting quality.[53]
Trade in the early Roman Empire allowed Rome to become as vast and great as it did. Emperor Augustus, despite his intense public and private spending, took control of trade from the government and expanded Roman influence by opening new trading markets in overseas areas such as Britain, Germany, and Africa.[54] Rome dominated trade and influence over the world in the age of the Roman Empire but could not advance in their industrial and manufacturing processes.[54] This ultimately threatened the expanding trading and commerce industries that Augustus brought about, as well as the strong standing of the Empire in the eyes of the Romans and the world.
Whereas the Roman Economy was able to thrive in the first few centuries AD thanks to its advanced trade and commerce, the boom was tempered as their ways of conducting business changed drastically. Due to Augustus and the aristocracy holding the large majority of land and wealth in Rome,[54] trade and commerce in the basic everyday commodities began to decline. Trade began to only take place for the more luxurious commodities, effectively excluding the majority of Romans due to their poverty.[54] Foreign trade was also incredibly significant to the rise and complexity of the Roman Economy, and the Romans traded commodities such as wine, oil, grain, salt, arms, and iron to countries primarily in the West.[54][39] When those countries came under decline in around 2nd century AD, and respective trade between them and the Roman Empire had to cease as a result, this put a dent in the strength of the Roman economy as foreign trade was a major factor of economic growth for the superfluously resourced Roman Empire.[54] Compounded with their inability to make proper production advancements to keep up with their growing and evolving economy, these events hindered Roman trade, limited their array of commodities and harmed the economy.
Labour and occupations
Inscriptions record 268 different occupations in the city of Rome, and 85 in Pompeii.[55] Professional associations or trade guilds (collegia) are attested for a wide range of occupations, including fishermen (piscatores), salt merchants (salinatores), olive oil dealers (olivarii), entertainers (scaenici), cattle dealers (pecuarii), goldsmiths (aurifices), teamsters (asinarii or muliones), and stonecutters (lapidarii).[56] These are sometimes quite specialized: one collegium at Rome was strictly limited to craftsmen who worked in ivory and citrus wood.[57]
Work performed by slaves falls into five general categories: domestic, with epitaphs recording at least 55 different household jobs; imperial or public service; urban crafts and services; agriculture; and mining.[58] Convicts provided much of the labour in the mines or quarries, where conditions were notoriously brutal.[59] In practice, there was little division of labour between slave and free,[60] and most workers were illiterate and without special skills.[61] The greatest number of common labourers were employed in agriculture: in the Italian system of industrial farming (latifundia), these may have been mostly slaves, but throughout the Empire, slave farm labour was probably less important than other forms of dependent labour by people who were technically not enslaved.[60]
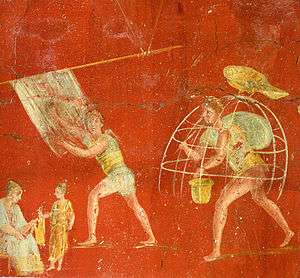
Textile and clothing production was a major source of employment. Both textiles and finished garments were traded among the peoples of the Empire, whose products were often named for them or a particular town, rather like a fashion "label".[62] Better ready-to-wear was exported by businessmen (negotiatores or mercatores) who were often well-to-do residents of the production centres.[63] Finished garments might be retailed by their sales agents, who travelled to potential customers, or by vestiarii, clothing dealers who were mostly freedmen; or they might be peddled by itinerant merchants.[63] In Egypt, textile producers could run prosperous small businesses employing apprentices, free workers earning wages, and slaves.[64] The fullers (fullones) and dye workers (coloratores) had their own guilds.[65] Centonarii were guild workers who specialized in textile production and the recycling of old clothes into pieced goods.[66]
GDP and income distribution
Economic historians vary in their calculations of the gross domestic product of the Roman economy during the Principate.[67] In the sample years of 14, 100, and 150 AD, estimates of per capita GDP range from 166 to 380 HS. The GDP per capita of Italy is estimated as 40[68] to 66 percent[69] higher than in the rest of the Empire, due to a more advanced level of urbanization and trade, as well as tax transfers from the provinces and the concentration of elite income in the heartland.
In the Scheidel–Friesen economic model, the total annual income generated by the Empire is placed at nearly 20 billion HS, with about 5 percent extracted by central and local government. Households in the top 1.5 percent of income distribution captured about 20 percent of income. Another 20 percent went to about 10 percent of the population who can be characterized as a non-elite middle. The remaining "vast majority" produced more than half of the total income, but lived near subsistence.[70] All cited economic historians stress the point that any estimate can only be regarded as a rough approximation to the realities of the ancient economy, given the general paucity of surviving pertinent data.
| Unit | Goldsmith 1984[71] |
Hopkins 1995/96[72] |
Temin 2006[73] |
Maddison 2007[74] |
Bang 2008[75] |
Scheidel/Friesen 2009[76] |
Lo Cascio/Malanima 2009[68] | |
|---|---|---|---|---|---|---|---|---|
| GDP per capita in | Sesterces | HS 380 | HS 225 | HS 166 | HS 380 | HS 229 | HS 260 | – |
| Wheat equivalent | 843 kg | 491 kg | 614 kg | 843 kg | 500 kg | 680 kg | – | |
| 1990 Int$ | – | – | – | $570 | – | $620 | $940 | |
| Population (Approx. year) |
55m (14 AD) |
60m (14 AD) |
55m (100 AD) |
44m (14 AD) |
60m (150 AD) |
70m (150 AD) |
– (14 AD) | |
| Total GDP in | Sesterces | HS 20.9bn | HS 13.5bn | HS 9.2bn | HS 16.7bn | HS 13.7bn | ~HS 20bn | – |
| Wheat equivalent | 46.4 Mt | 29.5 Mt | 33.8 Mt | 37.1 Mt | 30 Mt | 50 Mt | – | |
| 1990 Int$ | – | – | – | $25.1bn | – | $43.4bn | – | |
| "–" indicates unknown value. | ||||||||
A ^ Decimal fractions rounded to the nearest tenth. Italic numbers not directly given by the authors; they are obtained by multiplying the respective value of GDP per capita by estimated population size.
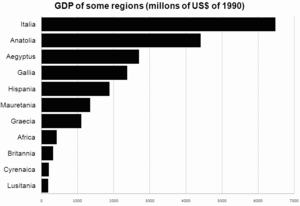
Regional breakdown
| Region | Population (in th) |
NDI per capita (in 1990 Int$) |
Total NDI (in m 1990 Int$) |
|---|---|---|---|
| Roman Europe (including Italy) | 23,100 | 593 | 13,689 |
| Roman Europe (excluding Italy) | 16,100 | 478 | 7,689 |
| Roman Asia | 12,200 | 550 | 6,710 |
| Roman Africa | 8,700 | 541 | 4,710 |
| Total Roman Empire | 44,000 | 570 | 25,109 |
Angus Maddison is the only economist cited who offers a detailed breakdown of the national disposable income (NDI) of the various parts of the Roman Empire. His "highly provisional" estimate (see right) relies on a low-count of the Roman population of only 44 million at the time of the death of Augustus in 14 AD. Italia is considered to have been the richest region, due to tax transfers from the provinces and the concentration of elite income in the heartland; its NDI per capita is estimated at having been between 40%[68] and 66%[69] higher than in the rest of the empire. Besides Italy, the wealthiest province was Egypt, in terms of NDI per capita.[78]
The European NDI per capita was higher than in the Asian and African provinces if Italy is included, but without it, the rest of Europe had a lower NDI per capita than the Asian and African provinces.[77] The Hellenistic Eastern provinces (Greece, Asia Minor, Syria, Egypt) were about 20% wealthier than their mostly Latin-speaking Western counterparts, with Egypt alone being about 28% wealthier. However, Italia, which was not administered as a province, enjoyed a higher per capita income than any one of them.[79]
Taxation
Taxation under the Empire amounted to about 5% of the Empire's gross product.[80] The typical tax rate paid by individuals ranged from 2 to 5%.[81] The tax code was "bewildering" in its complicated system of direct and indirect taxes, some paid in cash and some in kind. Taxes might be specific to a province, or kinds of properties such as fisheries or salt evaporation ponds; they might be in effect for a limited time.[82] Tax collection was justified by the need to maintain the military,[83][84] and taxpayers sometimes got a refund if the army captured a surplus of booty.[85] In-kind taxes were accepted from less-monetized areas, particularly those who could supply grain or goods to army camps.[86]

The primary source of direct tax revenue was individuals, who paid a poll tax and a tax on their land, construed as a tax on its produce or productive capacity.[81] Supplemental forms could be filed by those eligible for certain exemptions; for example, Egyptian farmers could register fields as fallow and tax-exempt depending on flood patterns of the Nile.[87] Tax obligations were determined by the census, which required each head of household to appear before the presiding official and provide a head count of his household, as well as an accounting of property he owned that was suitable for agriculture or habitation.[87]
A major source of indirect-tax revenue was the portoria, customs and tolls on imports and exports, including among provinces.[81] Special taxes were levied on the slave trade. Towards the end of his reign, Augustus instituted a 4% tax on the sale of slaves,[88] which Nero shifted from the purchaser to the dealers, who responded by raising their prices.[89] An owner who manumitted a slave paid a "freedom tax", calculated at 5% of value.[90]
An inheritance tax of 5% was assessed when Roman citizens above a certain net worth left property to anyone but members of their immediate family. Revenues from the estate tax and from a 1% sales tax on auctions went towards the veterans' pension fund (aerarium militare).[81]
Low taxes helped the Roman aristocracy increase their wealth, which equalled or exceeded the revenues of the central government. An emperor sometimes replenished his treasury by confiscating the estates of the "super-rich", but in the later period, the resistance of the wealthy to paying taxes was one of the factors contributing to the collapse of the Empire.[83]
State revenues
With the conclusion of the Third Mithridatic War in 63 BC, the Roman Republic now incorporated the Kingdom of Pontus, Cilicia, most of Syria, and the island of Crete into its growing dominion, as well as turning the Kingdom of Judea into a client state.[91] The Roman historian Plutarch records that after Pompey's return to Rome as a renowned conqueror of the east, tablets were presented showing that state revenues had increased from 50 million denarii to 85 million, an increase from 200 to 340 million sesterces from new taxes levied.[91] Yet this was apparently roughly the size of the entire state budget of the Ptolemaic Kingdom of Hellenistic Egypt. Both Cicero and Strabo related how at the beginning of the reign of Ptolemy XII Auletes (80-51 BC) his kingdom received an annual revenue of 12,500 talents, the equivalent of 75 million denarii, or 300 million sesterces.[91] Hence, with the Roman conquest of Egypt in the Final War of the Roman Republic (32-30 BC) and transformation of Egypt into a Roman province, one would readily assume a considerable increase in state revenues was made. The revenues garnered in Egypt in 80 BC alone was seven times the amount of tax money contemporary Roman Gaul offered to the Roman coffers following its conquest by Julius Caesar, a mere 40 million sesterces.[91] Yet this was roughly the same amount of taxes Rome was able to levy from Egypt (i.e. 40 million sesterces) after is conquest by Octavian, bringing the total figure for state revenues up to 420 million (which included 40 million from newly conquered Egypt, 40 million from Gaul, and 340 million from all other provinces).[92] The whole of Roman Britain after its conquest produced only about 11 million sesterces in revenues whereas the city of Alexandria in Egypt alone generated roughly 36 million sesterces.[93] Gold mining from the Roman provinces of Hispania on the Iberian Peninsula produced roughly 80 million seterces every year.[93]
During the 1st century AD, the total value of imported goods form the maritime trade coming from the Indian Ocean region (including the silk and spice trade) was roughly 1,000 million sesterces, allowing the Roman state to garner 250 million sesterces of that figure in tax revenue.[94] Even after the reduction of the amount of Roman legions from about fifty to twenty-eight (500,000 down to 300,000 full-time soldiers and auxiliaries) the Roman state under Augustus still had to spend out 640 million sesterces on military costs alone per annum (with total state expenses hovering around 1,000 million).[95] Raoul McLaughlin stresses that "as long as international commerce thrived, the Roman Empire could meet these high-level military costs."[95] A further 25 million sesterces in state revenues was gathered by taxing the Roman exported goods loaded on ships destined for Arabia and India (worth roughly 100 million in total).[96]
Historical financial crises
The Financial Crisis of 33AD
The financial crisis of 33AD is largely considered to be caused by policies that Tiberius took in order to limit the aristocrats' wealth and land-ownership, and done in response to Augustus's massive private and public expenditures. Prior to 33AD, Augustus engaged in lavish spending in the public and private sector, while greatly encouraging land ownership and investment in real estate.[97][98] Augustus thought that all citizens should have access to land and money. As a result, he aggressively engaged in a massive extension of credit into the real estate and public sector, and engaged in riskier and riskier loans.[98] Due to his policies, land and real estate prices rose dramatically, benefitting his wealthy and noble land-owner friends who owned large amounts of property and invested heavily in real estate.[98] Tiberius noticed such collusion, and looked to curb the amount of land that the wealthy and elites owned, as well as control the rapidly inflating money supply. He engaged in heavy austerity policies such as ordering for all loans be paid off immediately, and began confiscating property from the wealthy land-owners.[98] By restricting loans for land purchasing, and the demand to pay loans in full, debtors were forced to sell off their property and real estate, which drastically dropped real estate and land prices.[97] Paired with Tiberius' credit restriction policies and the Senate naively demanding that people continue to invest in land despite what was going on, massive deflation occurred which ultimately cause the market to collapse.[97][98]
See also
- Economic sectors
- Provinces
- Related economies
Notes and references
- ↑ "Statistics on World Population, GDP and Per Capita GDP, 1–f>".
- ↑ Garnsey, Peter, et al. The Roman Empire: Economy, Society and Culture. 2nd ed., University of California Press, 2015, www.jstor.org/stable/10.1525/j.ctt9qh25h.
- ↑ Temin, Peter. “Financial Intermediation in the Early Roman Empire.” The Journal of Economic History, vol. 64, no. 3, 2004, pp. 705–733., www.jstor.org/stable/3874817.
- 1 2 3 4 Andreau, Banking and Business in the Roman World, p. 2; Harris, "The Nature of Roman Money," n.p.
- ↑ Bond, Shelagh (October 1957). "The Coinage of the Early Roman Empire". Greece & Rome. 4. JSTOR 642136.
- ↑ J. Rufus Fears, "The Theology of Victory at Rome: Approaches and Problem," Aufstieg und Niedergang der römischen Welt II.17.2 (1981), pp. 752 and 824, and in the same volume, "The Cult of Virtues and Roman Imperial Ideology," p. 908.
- ↑ David Kessler and Peter Temin, "Money and Prices in the Early Roman Empire," in The Monetary Systems of the Greeks and Romans, in The Monetary Systems of the Greeks and Romans (Oxford University Press, 2008), n.p.
- ↑ Jean Andreau, Banking and Business in the Roman World (Cambridge University Press, 1999), p. 2.
- 1 2 3 Harris, "The Nature of Roman Money," in The Monetary Systems of the Greeks and Romans, n.p.
- 1 2 W.V. Harris, "The Nature of Roman Money," in The Monetary Systems of the Greeks and Romans, n.p.
- ↑ Harl, Coinage in the Roman Economy, 300 B.C. to A.D. 700, p. 125–136.
- ↑ Harl, Coinage in the Roman Economy, 300 B.C. to A.D. 700, pp. 128–129.
- ↑ Harris, "The Nature of Roman Money," in The Monetary Systems of the Greeks and Romans, n.p.; Harl, Coinage in the Roman Economy, 300 B.C. to A.D. 700, pp. 128–129.
- ↑ "Mining," in Late Antiquity: A Guide to the Postclassical World p. 579.
- ↑ Hong, Sungmin; Candelone, Jean-Pierre; Patterson, Clair C.; Boutron, Claude F. (1994). "Greenland Ice Evidence of Hemispheric Lead Pollution Two Millennia Ago by Greek and Roman Civilizations". Science. 265 (5180): 1841–1843. doi:10.1126/science.265.5180.1841. PMID 17797222.
- ↑ Wilson, Andrew (2002): "Machines, Power and the Ancient Economy", The Journal of Roman Studies, Vol. 92, pp. 1–32 (17–21, 25, 32)
- ↑ Craddock, Paul T. (2008): "Mining and Metallurgy", in: Oleson, John Peter (ed.): The Oxford Handbook of Engineering and Technology in the Classical World, Oxford University Press, ISBN 978-0-19-518731-1, p. 108; Sim, David; Ridge, Isabel (2002): Iron for the Eagles. The Iron Industry of Roman Britain, Tempus, Stroud, Gloucestershire, ISBN 0-7524-1900-5, p. 23; Healy, John F. (1978): Mining and Metallurgy in the Greek and Roman World, Thames and Hudson, London, ISBN 0-500-40035-0, p. 196. Assumes a productive capacity of c. 1.5 kg per capita. Healy, John F. (1978): Mining and Metallurgy in the Greek and Roman World, Thames and Hudson, London, ISBN 0-500-40035-0, p. 196
- ↑ Hong, Sungmin; Candelone, Jean-Pierre; Patterson, Clair C.; Boutron, Claude F. (1996): "History of Ancient Copper Smelting Pollution During Roman and Medieval Times Recorded in Greenland Ice", Science, Vol. 272, No. 5259, pp. 246–249 (366–369); cf. also Wilson, Andrew (2002): "Machines, Power and the Ancient Economy", The Journal of Roman Studies, Vol. 92, pp. 1–32 (25–29)
- ↑ Hong, Sungmin; Candelone, Jean-Pierre; Patterson, Clair C.; Boutron, Claude F. (1994): "Greenland Ice Evidence of Hemispheric Lead Pollution Two Millennia Ago by Greek and Roman Civilizations", Science, Vol. 265, No. 5180, pp. 1841–1843; Callataÿ, François de (2005): "The Graeco-Roman Economy in the Super Long-Run: Lead, Copper, and Shipwrecks", Journal of Roman Archaeology, Vol. 18, pp. 361–372 (361–365); Settle, Dorothy M.; Patterson, Clair C. (1980): "Lead in Albacore: Guide to Lead Pollution in Americans", Science, Vol. 207, No. 4436, pp. 1167–1176 (1170f.); cf. also Wilson, Andrew (2002): "Machines, Power and the Ancient Economy", The Journal of Roman Studies, Vol. 92, pp. 1–32 (25–29)
- ↑ Callataÿ, François de (2005): "The Graeco-Roman Economy in the Super Long-Run: Lead, Copper, and Shipwrecks", Journal of Roman Archaeology, Vol. 18, pp. 361–372 (361–369); Hong, Sungmin; Candelone, Jean-Pierre; Patterson, Clair C.; Boutron, Claude F. (1996): "History of Ancient Copper Smelting Pollution During Roman and Medieval Times Recorded in Greenland Ice", Science, Vol. 272, No. 5259, pp. 246–249 (247, fig. 1 and 2; 248, table 1); Hong, Sungmin; Candelone, Jean-Pierre; Patterson, Clair C.; Boutron, Claude F. (1994): "Greenland Ice Evidence of Hemispheric Lead Pollution Two Millennia Ago by Greek and Roman Civilizations", Science, Vol. 265, No. 5180, pp. 1841–1843; Settle, Dorothy M.; Patterson, Clair C. (1980): "Lead in Albacore: Guide to Lead Pollution in Americans", Science, Vol. 207, No. 4436, pp. 1167–1176 (1170f.)
- ↑ Hong, Sungmin; Candelone, Jean-Pierre; Patterson, Clair C.; Boutron, Claude F. (1994). "Greenland Ice Evidence of Hemispheric Lead Pollution Two Millennia Ago by Greek and Roman Civilizations". Science. 265 (5180): 1841–1843. doi:10.1126/science.265.5180.1841. PMID 17797222.
- ↑ Patterson, C. C. (1972): "Silver Stocks and Losses in Ancient and Medieval Times", The Economic History Review, Vol. 25, No. 2, pp. 205–235 (228, table 6); Callataÿ, François de (2005): "The Graeco-Roman Economy in the Super Long-Run: Lead, Copper, and Shipwrecks", Journal of Roman Archaeology, Vol. 18, pp. 361–372 (365f.)
- ↑ Patterson, C. C. (1972): "Silver Stocks and Losses in Ancient and Medieval Times", The Economic History Review, Vol. 25, No. 2, pp. 205–235 (216, table 2); Callataÿ, François de (2005): "The Graeco-Roman Economy in the Super Long-Run: Lead, Copper, and Shipwrecks", Journal of Roman Archaeology, Vol. 18, pp. 361–372 (365f.)
- ↑ Hopkins, The Political Economy of the Roman Empire, p. 197.
- ↑ Wilson 2002, pp. 17–21, 25, 32
- ↑ Cech 2010, p. 20
- ↑ Smith 1997, pp. 322–324
- ↑ Craddock 2008, p. 108; Sim, Ridge 2002, p. 23; Healy 1978, p. 196
- ↑ Sim, Ridge 2002, p. 23; Healy 1978, p. 196
- ↑ World output, the large bulk of which is attributed to Roman mining and smelting activities (mainly in Spain, Cyprus and Central Europe): Hong, Candelone, Patterson, Boutron 1996, p. 247; Callataÿ 2005, pp. 366–369; cf. also Wilson 2002, pp. 25–29
- ↑ Hong, Candelone, Patterson, Boutron 1996, p. 247, fig. 1 & 2; 248, table 1; Callataÿ 2005, pp. 366–369
- ↑ World output, the large bulk of which is attributed to Roman silver mining and smelting activities (in Central Europe, Britain, the Balkans, Greece, Asia Minor and, above all, Spain, with a 40% share in world production alone): Hong, Candelone, Patterson, Boutron 1994, p. 1841–1843; Callataÿ 2005, pp. 361–365; Settle, Patterson 1980, pp. 1170f.; cf. also Wilson 2002, pp. 25–29
- ↑ Hong, Candelone, Patterson, Boutron 1994, p. 1841–1843; Settle, Patterson 1980, pp. 1170f.; Callataÿ 2005, pp. 361–365 follows the aforementioned authors, but cautions that the Greco-Roman levels may have already been surpassed by the end of the Middle Ages (p. 365).
- ↑ Patterson 1972, p. 228, table 6; Callataÿ 2005, pp. 365f.; cf. also Wilson 2002, pp. 25–29
- ↑ Patterson 1972, p. 216, table 2; Callataÿ 2005, pp. 365f.
- ↑ Pliny: Naturalis Historia, 33.21.78, in: Wilson 2002, p. 27
- ↑ Élise Marlière, "Le tonneua en Gaule romaine," Gallia 58 (2001) 181–210, especially p. 184; Corbier, "Coinage, Society, and Economy," in CAH 12, p. 404.
- ↑ Kevin Greene, The Archaeology of the Roman Economy p. 17.
- 1 2 W.V. Harris, "Trade," in The Cambridge Ancient History: The High Empire A.D. 70–192 (Cambridge University Press, 2000), vol. 11, p. 713.
- ↑ Harris, "Trade," in CAH 11, p. 714.
- ↑ Roger Bradley Ulrich, Roman Woodworking (Yale University Press, pp. 1–2.
- 1 2 Stambaugh, The Ancient Roman City, p. 253.
- ↑ Ray Laurence, "Land Transport in Roman Italy: Costs, Practice and the Economy," in Trade, Traders and the Ancient City (Routledge, 1998), p. 129.
- ↑ Keith Hopkins, "The Political Economy of the Roman Empire," in The Dynamics of Ancient Empires : State Power from Assyria to Byzantium (Oxford University Press, 2009), p. 187.
- ↑ Holleran, Shopping in Ancient Rome, p. 142.
- ↑ Harper, P.O. (2002), "Iranian Luxury Vessels in China From the Late First Millennium B.C.E. to the Second Half of the First Millennium C.E.," in Annette L. Juliano and Judith A. Lerner (eds), Silk Road Studies VII: Nomads, Traders, and Holy Men Along China's Silk Road, 95–113, Turnhout: Brepols Publishers, ISBN 2503521789, pp 106-107.
- ↑ An, Jiayao. (2002), "When Glass Was Treasured in China," in Annette L. Juliano and Judith A. Lerner (eds), Silk Road Studies VII: Nomads, Traders, and Holy Men Along China's Silk Road, 79–94, Turnhout: Brepols Publishers, ISBN 2503521789, p. 83.
- ↑ Harris, "Trade," in CAH 11, p. 713.
- ↑ Harris, "Trade," in CAH 11, p. 710.
- ↑ Harris, "Trade," in CAH 11, pp. 717–729.
- ↑ Mireille Corbier, "Coinage, Society, and Economy," in Cambridge Ancient History: The Crisis of Empire, A.D. 193–337 (Cambridge University Press, 2005), vol. 12, p. 404; Harris, "Trade," in CAH 11, p. 719.
- ↑ Harris, "Trade," in CAH 11, p. 720.
- ↑ Holleran, Shopping in Ancient Rome, pp. 146–147.
- 1 2 3 4 5 6 West, Louis C. (November 1932). "The Economic Collapse of the Roman Empire". The Classical Journal. 28: 98. JSTOR 3290252.
- ↑ Hopkins, "The Political Economy of the Roman Empire," p. 196.
- ↑ Verboven, "The Associative Order: Status and Ethos among Roman Businessmen," preprint pp. 18, 23.
- ↑ Eborarii and citriarii: Verboven, "The Associative Order: Status and Ethos among Roman Businessmen," preprint p. 21.
- ↑ "Slavery in Rome," in The Oxford Encyclopedia of Ancient Greece and Rome (Oxford University Press, 2010), p. 323.
- ↑ "Slavery in Rome," in The Oxford Encyclopedia of Ancient Greece and Rome, p. 323.
- 1 2 Garnsey and Saller, The Roman Empire: Economy, Society and Culture, p. 111.
- ↑ Peter Temin, "The Labor Market of the Early Roman Empire," Journal of Interdisciplinary History 34.1 (2004), p. 517.
- ↑ A.H.M. Jones, "The Cloth Industry under the Roman Empire," Economic History Review 13.2 (1960), pp. 184–185.
- 1 2 Jones, "The Cloth Industry under the Roman Empire,"p. 192.
- ↑ Jones, "The Cloth Industry under the Roman Empire," pp. 188–189.
- ↑ Jones, "The Cloth Industry under the Roman Empire," pp. 190–191.
- ↑ Vout, "The Myth of the Toga," p. 212. The college of centonarii is an elusive topic in scholarship, since they are also widely attested as urban firefighters; see Jinyu Liu, Collegia Centonariorum: The Guilds of Textile Dealers in the Roman West (Brill, 2009). Liu sees them as "primarily tradesmen and/or manufacturers engaged in the production and distribution of low- or medium-quality woolen textiles and clothing, including felt and its products."
- ↑ Scheidel, Walter; Morris, Ian; Saller, Richard, eds. (2007): The Cambridge Economic History of the Greco-Roman World, Cambridge University Press, ISBN 978-0-521-78053-7
- 1 2 3 Lo Cascio, Elio; Malanima, Paolo (Dec. 2009): "GDP in Pre-Modern Agrarian Economies (1–1820 AD). A Revision of the Estimates", Rivista di storia economica, Vol. 25, No. 3, pp. 391–420 (391–401)
- 1 2 Maddison 2007, pp. 47–51
- ↑ Scheidel, Walter; Friesen, Steven J. (2006). "The Size of the Economy and the Distribution of Income in the Roman Empire". Journal of Roman Studies. 99: 62–63. doi:10.3815/007543509789745223.
- ↑ Goldsmith 1984, pp. 263–288
- ↑ Hopkins 1995/96, pp. 41–75. His estimates are upward revisions from Hopkins 1980, pp. 101–125, where he lays out his basic method.
- ↑ Temin 2006, pp. 31–54
- ↑ Maddison 2007, pp. 43–47; 50, table 1.10; 54, table 1.12
- ↑ Bang 2008, pp. 86–91
- ↑ Scheidel, Friesen Nov. 2009, pp. 61–91
- 1 2 Maddison 2007, p. 54, table 1.12
- ↑ Maddison 2007, p. 55, table 1.14
- ↑ Maddison 2007, p. 57, table 1.14
- ↑ Morris, p. 183.
- 1 2 3 4 Potter (2009), p. 187.
- ↑ Potter (2009), pp. 185–187.
- 1 2 Morris, p. 184.
- ↑ Potter (2009), p. 185
- ↑ Potter (2009), p. 185.
- ↑ Potter (2009), p. 188.
- 1 2 Potter (2009), p. 186.
- ↑ Cassius Dio 55.31.4.
- ↑ Tacitus, Annales 13.31.2.
- ↑ This was the vicesima libertatis, "the twentieth for freedom"; Potter (2009), p. 187.
- 1 2 3 4 Raoul McLaughlin (2014). The Roman Empire and the Indian Ocean: the Ancient World Economy and the Kingdoms of Africa, Arabia, and India. Barnsley: Pen & Sword Military. ISBN 978-1-78346-381-7, p. 6.
- ↑ Raoul McLaughlin (2014). The Roman Empire and the Indian Ocean: the Ancient World Economy and the Kingdoms of Africa, Arabia, and India. Barnsley: Pen & Sword Military. ISBN 978-1-78346-381-7, p. 7.
- 1 2 Raoul McLaughlin (2014). The Roman Empire and the Indian Ocean: the Ancient World Economy and the Kingdoms of Africa, Arabia, and India. Barnsley: Pen & Sword Military. ISBN 978-1-78346-381-7, p. 12.
- ↑ Raoul McLaughlin (2014). The Roman Empire and the Indian Ocean: the Ancient World Economy and the Kingdoms of Africa, Arabia, and India. Barnsley: Pen & Sword Military. ISBN 978-1-78346-381-7, p. 14.
- 1 2 Raoul McLaughlin (2014). The Roman Empire and the Indian Ocean: the Ancient World Economy and the Kingdoms of Africa, Arabia, and India. Barnsley: Pen & Sword Military. ISBN 978-1-78346-381-7, p. 16.
- ↑ Raoul McLaughlin (2014). The Roman Empire and the Indian Ocean: the Ancient World Economy and the Kingdoms of Africa, Arabia, and India. Barnsley: Pen & Sword Military. ISBN 978-1-78346-381-7, p. 19.
- 1 2 3 [Financial Panic of 33AD." Financial Panic of 33AD | Armstrong Economics. Armstrong Economics, 2017. Web. 25 Apr. 2017. "Financial Panic of 33AD"] Check
|url=value (help). Armstrong Economics. - 1 2 3 4 5 Frank, Tenney. “The Financial Crisis of 33 A. D.” The American Journal of Philology, vol. 56, no. 4, 1935, pp. 336–341., www.jstor.org/stable/289972.
Sources
- Bang, Peter Fibiger (2008): The Roman Bazaar: A Comparative Study of Trade and Markets in a Tributary Empire, Cambridge University Press, ISBN 0-521-85532-2, pp. 86–91
- Bang, Peter Fibiger (2009). "The Ancient Economy and New Institutional Economics". The Journal of Roman Studies. 99: 194–206. doi:10.3815/007543509789744783.
- Callataÿ, François de (2005). "The Graeco-Roman Economy in the Super Long-Run: Lead, Copper, and Shipwrecks". Journal of Roman Archaeology. 18: 361–372.
- Cech, Brigitte (2010): Technik in der Antike, Wissenschaftliche Buchgesellschaft, Darmstadt, ISBN 978-3-8062-2080-3
- Craddock, Paul T. (2008): "Mining and Metallurgy", in: Oleson, John Peter (ed.): The Oxford Handbook of Engineering and Technology in the Classical World, Oxford University Press, ISBN 978-0-19-518731-1, pp. 93–120
- Goldsmith, Raymond W. (1984). "An Estimate of the Size and Structure of the National Product of the Early Roman Empire". Review of Income and Wealth. 30 (3): 263–288. doi:10.1111/j.1475-4991.1984.tb00552.x.
- Healy, John F. (1978): Mining and Metallurgy in the Greek and Roman World, Thames and Hudson, London, ISBN 0-500-40035-0
- Hong, Sungmin; Candelone, Jean-Pierre; Patterson, Clair C.; Boutron, Claude F. (1994). "Greenland Ice Evidence of Hemispheric Lead Pollution Two Millennia Ago by Greek and Roman Civilizations". Science. 265 (5180): 1841–1843. doi:10.1126/science.265.5180.1841. PMID 17797222.
- Hong, Sungmin; Candelone, Jean-Pierre; Patterson, Clair C.; Boutron, Claude F. (1996). "History of Ancient Copper Smelting Pollution During Roman and Medieval Times Recorded in Greenland Ice". Science. 272 (5259): 246–249. doi:10.1126/science.272.5259.246.
- Hopkins, Keith (1980). "Taxes and Trade in the Roman Empire (200 B.C.–A.D. 400)". The Journal of Roman Studies. 70: 101–125. doi:10.2307/299558.
- Hopkins, Keith (1995/6): "Rome, Taxes, Rents, and Trade", Kodai, Vol. 6/7, pp. 41–75
- Lo Cascio, Elio; Malanima, Paolo (2009). "GDP in Pre-Modern Agrarian Economies (1–1820 AD). A Revision of the Estimates". Rivista di storia economica. 25 (3): 391–420.
- Maddison, Angus (2007): "Contours of the World Economy, 1–2030 AD. Essays in Macro-Economic History", Oxford University Press, ISBN 978-0-19-922721-1
- Parker, A. J. (1992): "Ancient Shipwrecks of the Mediterranean and the Roman Provinces", Archaeopress (British Archaeological Reports (BAR) International S.), ISBN 0-86054-736-1
- Patterson, C. C. (1972). "Silver Stocks and Losses in Ancient and Medieval Times". The Economic History Review. 25 (2): 205–235. doi:10.2307/2593904.
- Scheidel, Walter (April 2006): Population and Demography, Princeton/Stanford Working Papers in Classics, Version 1.0
- Scheidel, Walter; Friesen, Steven J. (2009). "The Size of the Economy and the Distribution of Income in the Roman Empire". The Journal of Roman Studies. 99: 61–91. doi:10.3815/007543509789745223.
- Settle, Dorothy M.; Patterson, Clair C. (1980). "Lead in Albacore: Guide to Lead Pollution in Americans". Science. 207 (4436): 1167–1176. doi:10.1126/science.6986654. PMID 6986654.
- Sim, David; Ridge, Isabel (2002): Iron for the Eagles. The Iron Industry of Roman Britain, Tempus, Stroud, Gloucestershire, ISBN 0-7524-1900-5
- Smith, A. H. V. (1997). "Provenance of Coals from Roman Sites in England and Wales". Britannia. 28: 297–324. doi:10.2307/526770.
- Temin, Peter (2006): "Estimating GDP in the Early Roman Empire", Lo Cascio, Elio (ed.): Innovazione tecnica e progresso economico nel mondo romano, Edipuglia, Bari, ISBN 978-88-7228-405-6, pp. 31–54
- Wilson, Andrew (2002). "Machines, Power and the Ancient Economy". The Journal of Roman Studies. 92: 1–32. doi:10.1017/s0075435800032135.
| Library resources about Roman Economy |
Further reading
- Bowman, A. K. and Wilson, A. I. (eds) (2009), Quantifying the Roman Economy: Methods and Problems, Oxford Studies in the Roman Economy 1. Oxford University Press, Oxford
- Bowman, A. K. and Wilson, A. I. (eds) (2012), Settlement, Urbanisation and Population, Oxford Studies in the Roman Economy 2. Oxford University Press, Oxford
- Scheidel, Walter; Morris, Ian; Saller, Richard, eds. (2007): The Cambridge Economic History of the Greco-Roman World, Cambridge University Press, ISBN 978-0-521-78053-7
- Temin, Peter (2006). "The Economy of the Early Roman Empire". Journal of Economic Perspectives. 20 (1): 133–151. doi:10.1257/089533006776526148. ISSN 0895-3309.