Mid-twentieth century baby boom
The middle of the twentieth century was marked by significant and persistent increase in fertility rates in many countries of the world, especially in the West, resulting in the famous baby boomer generation. There is some disagreement as to the precise beginning and ending dates of the post-war baby boom, but it is most often agreed to have begun in 1946 immediately after World War II; some place it earlier, at the increase of births during 1941–1943. The boom coincided with the marriage boom, a significant increase in nuptiality.[1]
The baby boom started to decline as birth rates in the United States started to decline in 1958, and grinded to a halt six years later in 1964. In countries that had suffered heavy war damage, displacement of people, and post-war economic hardship (e.g., Germany and Poland), the boom began some years later.
Causes
Economist and demographer Richard Easterlin in his "Twentieth Century American Population Growth" (2000), explains the growth pattern of American population in the 20th century by examining the fertility rate fluctuations and the decreasing mortality rate. Easterlin attempts to prove the cause of the baby boom and baby bust by the "relative income" theory, despite the various other theories that these events have been attributed to. The "relative income" theory suggests that couples choose to have children based on a couple's ratio of potential earning power and the desire to obtain material objects. This ratio depends on the economic stability of the country and how people are raised to value material objects. The "relative income" theory explains the baby boom by suggesting that the late 1940s and the 1950s brought low desires to have material objects, because of the Great Depression and World War II, as well as plentiful job opportunities (being a post-war period). These two factors gave rise to a high relative income, which encouraged high fertility. Following this period, the next generation had a greater desire for material objects, however an economic slowdown in the United States made jobs harder to acquire. This resulted in lower fertility rates causing the Baby Bust.[2]
Jan Van Bavel and David S. Reher proposed that the increase in nuptiality (marriage boom) coupled with low efficiency of contraception was the main cause of the baby-boom. They doubted the explanations (including the Easterlin hypothesis) which considered the post-war economic prosperity that followed deprivation of the Great Depression as main cause of the baby-boom, stressing that GDP-birth rate association was not consistent (positive before 1945 and negative after) with GDP growth accounting for mere 5 percent of the variance in the crude birth rate over the period studied by the authors.[3]
Matthias Doepke, Moshe Hazan, and Yishay Maoz all argued that the baby-boom was mainly caused by the alleged crowding out from labor force of females who reached adulthood in 1950s by females who start to work during the Second World War and do not quit job after the economy recovered.[4] Andriana Bellou and Emanuela Cardia promote similar argument, but they claiming that it were women who entered labor force during the Great Depression who crowded out women who participate in the baby-boom.[5] Glenn Sandström disagrees with both variants of this interpretation based on the data from Sweden showing that an increase in nuptiality (which was one of the main causes of an increase in fertility) was limited to economically active women. He pointed out that in 1939 a law prohibiting the firing of a woman when she got married was passed in the country.[6]
Greenwood, Seshadri, and Vandenbroucke ascribe the baby boom to the diffusion of new household appliances that led to reduction of costs of childbearing.[7] However Martha J. Bailey and William J. Collins criticize their explanation on the basis that improvement of household technology began before baby-boom, differences and changes in ownership of appliances and electrification in U.S. counties are negatively correlated with birth rates during baby-boom, that the correlation between cohort fertility of the relevant women and access to electrical service in early adulthood is negative, and that Amish also experienced the baby boom.[8]
Judith Blake and Prithwis Das Gupta point out the increase in ideal family size in the times of baby-boom.[9]
Peter Lindert partially attribute the baby-boom to the extension of income tax coverage on most of US population in the early 1940s. The latter actualize already existed and newly created tax exemptions for children and married couples creating the new incentive for earlier marriage and higher fertility.[10] It is proposed that because of the fact that the taxation was progressive the baby-boom was more pronounced among the richer population.[11]
In the United States
Most baby boomers are now in their 60s or 70s, with the oldest member of the boom being around 75. The trailing boomers are in their late 50s, with the youngest being 58 as of 2018 (If one uses Strauss and Howes generational span of 1943-1960). In the economy, many are now retiring and leaving the labor force.
In 1946, live births in the U.S. surged from 222,721 in January to 339,499 in October. By the end of the 1940s, about 32 million babies had been born, compared with 24 million in the 1930s. In 1954, annual births first topped four million and did not drop below that figure until 1965, when four out of ten Americans were under the age of 20.[12]
Definition of the boom years
It is important to distinguish between the demographic boom in births, and the actual generations born during that period.
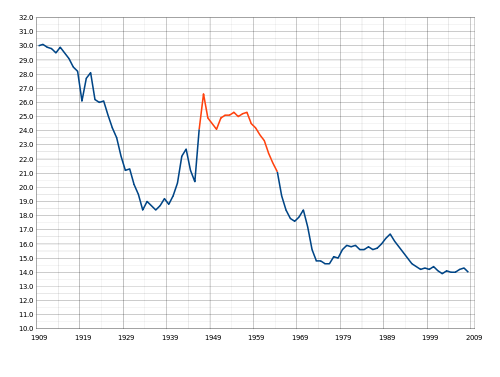
As shown in the birth rate chart to the right, the baby boom in the United States is as much defined by the low birth rates that preceded and followed it as it is by an exceptionally high post-war fertility rate. The birth rate from 1946 to 1964 is much lower than the birth rate prior to World War I, although it is high in comparison to the time periods immediately preceding and following 1946–1964.
The exact beginning and end of the baby boom can be debated. The U.S. Census Bureau defines baby boomers as those born between mid-1946 and mid-1964,[14] although the U.S. birth rate began to shoot up in 1941 and to decline after 1957. Deborah Carr considers baby boomers to be those born between 1944 and 1959,[15] while Strauss and Howe place the beginning of the baby boom in 1943. The following table shows changes in U.S. population during the period of U.S. involvement in World War II and for the five years thereafter, based on U.S. census information.[16]
| Year | US resident population (thousands) |
Net change (thousands) |
Percent change |
|---|---|---|---|
| 1941 | 133,121 | 1,161 | 0.88% |
| 1942 | 133,920 | 799 | 0.60% |
| 1943 | 134,245 | 325 | 0.24% |
| 1944 | 132,885 | −1,360 | −1.01% |
| 1945 | 132,481 | −404 | −0.30% |
| 1946 | 140,054 | 7,573 | 5.72% |
| 1947 | 143,446 | 3,392 | 2.42% |
| 1948 | 146,093 | 2,647 | 1.85% |
| 1949 | 148,665 | 2,572 | 1.76% |
| 1950 | 151,868 | 3,203 | 2.15% |
| 10-year average | - | 1,991 | 1.43% |
Historical and social background
When the war ended in 1945, millions of veterans returned home and reintegrated into civilian life. To help this process, Congress passed the G.I. Bill of Rights. This encouraged home ownership and investment in higher education through the distribution to veterans of loans at low or zero interest rates.
Returning veterans married, started families, pursued higher education, and bought their first homes. With veterans' benefits, the twenty-somethings found new homes in planned communities on the outskirts of American cities. This group, whose formative years covered the Great Depression, was a generation hardened by poverty and deprived of the security of a home or job. Now thriving on the American Dream, life was simple, jobs were plentiful, and a record number of babies were born.
Many Americans believed that lack of post-war government spending would send the United States back into depression. However, consumer demand fueled economic growth. The baby boom triggered a housing boom, a consumption boom and a boom in the labor force. Between 1950 and 1960, the nation's real GDP rose almost 50%, from $2.2 trillion to $3.1 trillion (in 2009 dollars). The middle class grew and the majority of America's labor force held white-collar jobs. This increase led to urbanization and increased the demand for ownership of cars and other 1950s and 1960s inventions.
Marriage rates
Marriage rates rose sharply in the 1940s and reached all-time highs. After World War II, Americans began to marry at a younger age: the average age of a person at their first marriage dropped to 22.5 years for males and 20.1 for females, down from 24.3 for males and 21.5 for females in 1940.[17] Getting married immediately after high school was becoming commonplace and women were increasingly under tremendous pressure to marry by the age of 20. The stereotype developed that women were going to college to earn their M.R.S. (Mrs.) degree.[18]
Family sizes
Family size increased sharply throughout the baby boom: the average woman bore 3.09 children in 1950 which increased to 3.65 children per family in 1960; the peak was in 1957, when the figure stood at 3.77. Most women became pregnant with their first child within seven months of their wedding; between 1940 and 1960, the number of families with three children doubled and the number of families having a fourth child quadrupled.
In the United States more babies were born during the seven years after 1948 than in the previous 30, causing a shortage of teenage babysitters. Madison, New Jersey, for example, only had 50 high-school girls to babysit for a town of 8,000, and any sitter could have had two sitting jobs at once if desired. $5 of the $7 that a California couple spent to go to the movies in 1950 went to the babysitter.[19]
In Canada
In Canada, the baby boom is usually defined as occurring from 1947 to 1966, with over 400,000 babies born yearly. Canadian soldiers were repatriated later than American servicemen, and Canada's birthrate did not start to rise until 1947. Most Canadian demographers prefer to use the later date of 1966 as the boom's end year in that country. The later end than the US (baby-boom generation: babies born from 1946 to 1964; see preceding paragraphs) is ascribed to a later adoption of birth control pills.[20][21]
In Australia
The author and columnist Bernard Salt places the Australian baby boom between 1946 and 1961.[22][23]
In the United Kingdom
After a short baby boom immediately after the war peaking in 1946, the United Kingdom experienced a second baby boom during the 1960s, with a peak in births in 1964, and a third, smaller boom peaking in 1990. The three peaks can clearly be seen in the UK Population Pyramid.[24][25]
European and South-Pacific trends
Many European countries, Australia and New Zealand also experienced a baby boom. In some cases the total fertility rate almost doubled. The American birth model, conceived by demographer Frank Notestein, was punctuated by an end to the upsurge in births and a return to pre-war levels. In many European countries the first year of the Post World War II baby boom was the year 1946, but in Germany the first year was the year 1955 in Finland the largest birth rate was in August and September 1945. Japan had two separate baby booms. The first started in 1947, the second in 1971. Prior to World War II, mortality rates in Europe and America were on a general decline due to improved nutrition and medicine, and a surge in births were previously not experienced at such a large scale. Based on this model, baby boom years for other countries regarded for having a baby boom are as follows:

- France 1946–1974
- United Kingdom 1946–1949; 1956-1974
- Finland 1945–1950
- Germany 1955–1967
- Sweden 1946–1952
- Denmark 1946–1950
- Netherlands 1946–1972
- Ireland 1946–1982
- Hungary 1946–1957
- Iceland 1946–1969
- New Zealand 1946–1961
- Australia 1946–1961
- Japan 1947–1949, 1971–1974
In some of these examples, an "echo boom" followed some time after as the offspring of the initial boom gave rise to a second increase, with a baby "bust" in between. The birth years of the baby boom as noted being both short and long lived, creates what many believe to be a myth to the notion of defining baby boomers as one "generation", as a unified concept is clearly not possible. Indeed, multiple generations may be present in a single country such as Ireland where the boom lasted 36 years. This overlapping effect of generations is not illuminated when considering crude fertility rates. The only common ground for the collective boom is the same approximate starting year. This example can be applied to each state in the United States on an individual basis. The states with a census in place in 1946 saw fertility rates drop to pre-war levels throughout the 1960s, with the average being in 1964.
In developing countries
Along with developed countries of the West, many developing countries also witnessed baby-boom.[26]
See also
Bibliography
- Barkan, Elliott Robert. From All Points: America's Immigrant West, 1870s-1952, (2007) 598 pages
- Barrett, Richard E., Donald J. Bogue, and Douglas L. Anderton. The Population of the United States 3rd Edition (1997) compendium of data
- Carter, Susan B., Scott Sigmund Gartner, Michael R. Haines, and Alan L. Olmstead, eds. The Historical Statistics of the United States (Cambridge UP: 6 vol; 2006) vol 1 on population; available online; massive data compendium; online version in Excel
- Chadwick Bruce A. and Tim B. Heaton, eds. Statistical Handbook on the American Family. (1992)
- Easterlin, Richard A. The American Baby Boom in Historical Perspective, (1962), the single most influential study complete text online
- Easterlin, Richard A. Birth and Fortune: The Impact of Numbers on Personal Welfare (1987), by leading economist excerpt and text search
- Gillon, Steve. Boomer Nation: The Largest and Richest Generation Ever, and How It Changed America (2004), by leading historian. excerpt and text search
- Hawes Joseph M. and Elizabeth I. Nybakken, eds. American Families: a Research Guide and Historical Handbook. (Greenwood Press, 1991)
- Klein, Herbert S. A Population History of the United States. Cambridge University Press, 2004. 316 pp
- Macunovich, Diane J. Birth Quake: The Baby Boom and Its Aftershocks (2002) excerpt and text search
- Mintz Steven and Susan Kellogg. Domestic Revolutions: a Social History of American Family Life. (1988)
- Wells, Robert V. Uncle Sam's Family (1985), general demographic history
- Weiss, Jessica. To Have and to Hold: Marriage, the Baby Boom, and Social Change (2000) excerpt and text search
References
- ↑ Hajnal, John (April 1953). "The Marriage Boom". Population Index. 19 (2): 80–101. doi:10.2307/2730761. JSTOR 2730761.
- ↑ See Richard A. Easterlin, Birth and Fortune: The Impact of Numbers on Personal Welfare (1987)
- ↑ Van Bavel, Jan; Reher, David S. (2013). "The Baby Boom and Its Causes: What We Know and What We Need to Know". Population and Development Review. 39 (2): 257–288. doi:10.1111/j.1728-4457.2013.00591.x.
- ↑ Doepke, Matthias; Hazan, Moshe; Maoz, Yishay D. (2015). "The Baby Boom and World War II: A Macroeconomic Analysis" (PDF). Review of Economic Studies. 82 (3): 1031–1073. doi:10.3386/w13707.
- ↑ Bellou, Andriana; Cardia, Emanuela (2014). "Baby-Boom, Baby-Bust and the Great Depression". Institute of Labor Economics.
- ↑ Sandström, Glenn (November 2017). "A reversal of the socioeconomic gradient of nuptiality during the Swedish mid-20th-century baby boom" (PDF). Demographic Research. 37. doi:10.4054/DemRes.2017.37.50.
- ↑ Greenwood, Jeremy; Seshadri, Ananth; Vandenbroucke, Guillaume (2005). "The Baby Boom and Baby Bust". American Economic Review. 95 (1): 183–207. doi:10.1257/0002828053828680.
- ↑ Bailey, Martha J.; Collins, William J. (2011). "Did Improvements in Household Technology Cause the Baby Boom? Evidence from Electrification, Appliance Diffusion, and the Amish". American Economic Journal: Macroeconomics. 3 (2): 189–217. doi:10.1257/mac.3.2.189.
- ↑ Blake, Judith; Das Gupta, Prithwis (December 1975). "Reproductive Motivation Versus Contraceptive Technology: Is Recent American Experience an Exception?". Population and Development Review. 1 (2): 229–249. doi:10.2307/1972222. JSTOR 1972222.
- ↑ Lindert, Peter H. (1978). Fertility and Scarcity in America. Princeton, New Jersey, USA: Princeton University Press. ISBN 9781400870066.
- ↑ Zhao, Jackie Kai. "War Debt and the Baby Boom". The Penn State College of Information Sciences and Technology. Society for Economic Dynamics.
- ↑ Figures in Landon Y. Jones, "Swinging 60s?" in Smithsonian Magazine, January 2006, pp 102–107.
- ↑ Pre-2003 data came from: "Table 1-1. Live Births, Birth Rates, and Fertility Rates, by Race: United States, 1909-2003". Centers for Disease Control and Prevention (CDC). (Retrieved from: "Vital Statistics of the United States, 2003, Volume I, Natality". CDC.) Post-2003 data came from: "National Vital Statistics Reports" (8 December 2010). CDC. Volume 59, no. 1. The graph is an expanded SVG version of File:U.S.BirthRate.1909.2003.png
- 1 2 "Fueled by Aging Baby Boomers, Nation's Older Population to Nearly Double in the Next 20 Years, Census Bureau Reports". United States Census Bureau. 6 May 2014.
- ↑ Carr, Deborah (2002). "The Psychological Consequences of Work-Family Trade-Offs for Three Cohorts of Men and Women" (PDF). Social Psychology Quarterly. 65 (2). doi:10.2307/3090096.
- ↑ "Population and Household Economic Topics". Census.gov. Retrieved August 21, 2010.
- ↑ "Median Age at First Marriage, 1890–2006". Infoplease. Retrieved July 22, 2008.
- ↑ "People & Events: Mrs. America: Women's Roles in the 1950s". PBS. Retrieved July 22, 2008.
- ↑ Forman-Brunell, Miriam (2009). Babysitter: An American History. New York University Press. pp. 49–50. ISBN 978-0-8147-2759-1.
- ↑ The dates 1946 to 1962 are given in Doug Owram, Born at the right time: a history of the baby-boom generation (1997)
- ↑ David Foot, Boom, Bust and Echo: Profiting from the Demographic Shift in the 21st Century (1997) see Pearce, Tralee (24 June 2006). "By definition: Boom, bust, X and why". The Globe and Mail. Archived from the original on 7 August 2006.
- ↑ Salt, Bernard (2004). The Big Shift. South Yarra, Vic.: Hardie Grant Books. ISBN 978-1-74066-188-1.
- ↑ Head, Neil; Arnold, Peter (November 2003). "Book Review: The Big Shift" (PDF). The Australian Journal of Emergency Management. 18 (4). Archived from the original on 2009-03-05.
- ↑ Office for National Statistics UK population interactive content
- ↑ Office for National Statistics Animated Population Pyramid for the UK Archived 2013-01-01 at the Wayback Machine.
- ↑ Reher, David; Requena, Miguel (2014). "The mid-twentieth century fertility boom from a global perspective". The History of the Family. 20 (3): 420–445. doi:10.1080/1081602X.2014.944553.