Phylogenetic tree
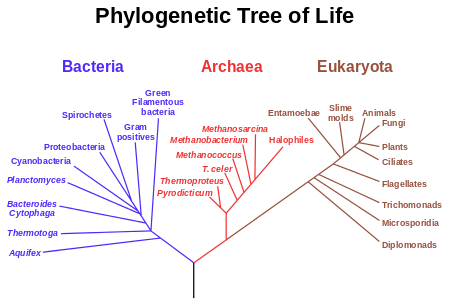
A phylogenetic tree or evolutionary tree is a branching diagram or "tree" showing the evolutionary relationships among various biological species or other entities—their phylogeny (/faɪˈlɒdʒəni/)—based upon similarities and differences in their physical or genetic characteristics. All life on Earth is part of a single phylogenetic tree, indicating common ancestry.
In a rooted phylogenetic tree, each node with descendants represents the inferred most recent common ancestor of those descendants, and the edge lengths in some trees may be interpreted as time estimates. Each node is called a taxonomic unit. Internal nodes are generally called hypothetical taxonomic units, as they cannot be directly observed. Trees are useful in fields of biology such as bioinformatics, systematics, and phylogenetics. Unrooted trees illustrate only the relatedness of the leaf nodes and do not require the ancestral root to be known or inferred.
History
The idea of a "tree of life" arose from ancient notions of a ladder-like progression from lower into higher forms of life (such as in the Great Chain of Being). Early representations of "branching" phylogenetic trees include a "paleontological chart" showing the geological relationships among plants and animals in the book Elementary Geology, by Edward Hitchcock (first edition: 1840).
Charles Darwin (1859) also produced one of the first illustrations and crucially popularized the notion of an evolutionary "tree" in his seminal book The Origin of Species. Over a century later, evolutionary biologists still use tree diagrams to depict evolution because such diagrams effectively convey the concept that speciation occurs through the adaptive and semirandom splitting of lineages. Over time, species classification has become less static and more dynamic.
The term phylogenetic, or phylogeny, derives from the two ancient greek words φῦλον (phûlon), meaning "race, lineage", and γένεσις (génesis), meaning "origin, source".[1][2]
Types
Rooted tree
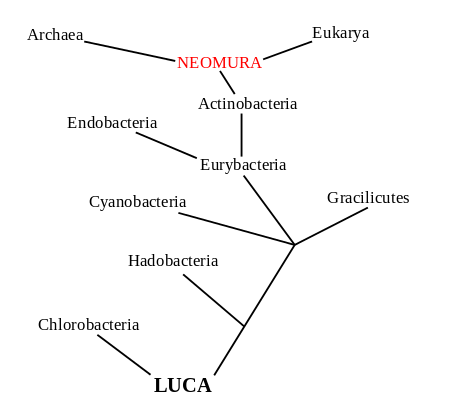
A rooted phylogenetic tree (see two graphics at top) is a directed tree with a unique node — the root — corresponding to the (usually imputed) most recent common ancestor of all the entities at the leaves of the tree. The root node does not have a parent node, but serves as the parent of all other nodes in the tree. The root is therefore a node of degree 2 while other internal nodes have a minimum degree of 3 (where "degree" here refers to the total number of incoming and outgoing edges).
The most common method for rooting trees is the use of an uncontroversial outgroup—close enough to allow inference from trait data or molecular sequencing, but far enough to be a clear outgroup.
Unrooted tree
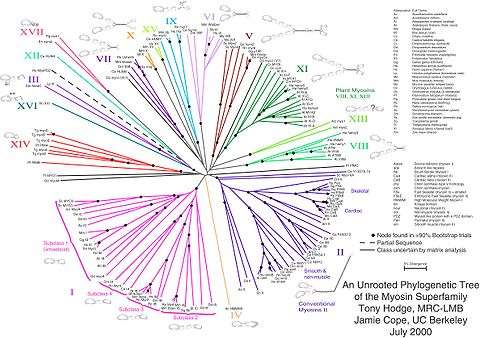
Unrooted trees illustrate the relatedness of the leaf nodes without making assumptions about ancestry. They do not require the ancestral root to be known or inferred.[4] Unrooted trees can always be generated from rooted ones by simply omitting the root. By contrast, inferring the root of an unrooted tree requires some means of identifying ancestry. This is normally done by including an outgroup in the input data so that the root is necessarily between the outgroup and the rest of the taxa in the tree, or by introducing additional assumptions about the relative rates of evolution on each branch, such as an application of the molecular clock hypothesis.[5]
Bifurcating tree
Both rooted and unrooted phylogenetic trees can be either bifurcating or multifurcating, and either labeled or unlabeled. A rooted bifurcating tree has exactly two descendants arising from each interior node (that is, it forms a binary tree), and an unrooted bifurcating tree takes the form of an unrooted binary tree, a free tree with exactly three neighbors at each internal node. In contrast, a rooted multifurcating tree may have more than two children at some nodes and an unrooted multifurcating tree may have more than three neighbors at some nodes. A labeled tree has specific values assigned to its leaves, while an unlabeled tree, sometimes called a tree shape, defines a topology only. The number of possible trees for a given number of leaf nodes depends on the specific type of tree, but there are always more multifurcating than bifurcating trees, more labeled than unlabeled trees, and more rooted than unrooted trees. The last distinction is the most biologically relevant; it arises because there are many places on an unrooted tree to put the root. For labeled bifurcating trees, there are:

total rooted trees and

total unrooted trees, where represents the number of leaf nodes. Among labeled bifurcating trees, the number of unrooted trees with leaves is equal to the number of rooted trees with leaves.[6]


Special tree types
- A dendrogram is a general name for a tree, whether phylogenetic or not, and hence also for the diagrammatic representation of a phylogenetic tree.[9]
- A cladogram is a phylogenetic tree formed using cladistic methods. This type of tree only represents a branching pattern; i.e., its branch spans do not represent time or relative amount of character change.[10]
- A phylogram is a phylogenetic tree that has branch spans proportional to the amount of character change.[11]
- A chronogram is a phylogenetic tree that explicitly represents evolutionary time through its branch spans.
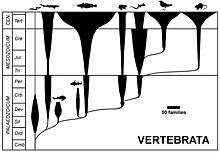
- A spindle diagram (often called a Romerogram after the American palaeontologist Alfred Romer) is the representation of the evolution and abundance of the various taxa through time.
- A Dahlgrenogram is a diagram representing a cross section of a phylogenetic tree
- A phylogenetic network is not strictly speaking a tree, but rather a more general graph, or a directed acyclic graph in the case of rooted networks. They are used to overcome some of the limitations inherent to trees.
Construction
Phylogenetic trees composed with a nontrivial number of input sequences are constructed using computational phylogenetics methods. Distance-matrix methods such as neighbor-joining or UPGMA, which calculate genetic distance from multiple sequence alignments, are simplest to implement, but do not invoke an evolutionary model. Many sequence alignment methods such as ClustalW also create trees by using the simpler algorithms (i.e. those based on distance) of tree construction. Maximum parsimony is another simple method of estimating phylogenetic trees, but implies an implicit model of evolution (i.e. parsimony). More advanced methods use the optimality criterion of maximum likelihood, often within a Bayesian Framework, and apply an explicit model of evolution to phylogenetic tree estimation.[6] Identifying the optimal tree using many of these techniques is NP-hard,[6] so heuristic search and optimization methods are used in combination with tree-scoring functions to identify a reasonably good tree that fits the data.
Tree-building methods can be assessed on the basis of several criteria:[12]
- efficiency (how long does it take to compute the answer, how much memory does it need?)
- power (does it make good use of the data, or is information being wasted?)
- consistency (will it converge on the same answer repeatedly, if each time given different data for the same model problem?)
- robustness (does it cope well with violations of the assumptions of the underlying model?)
- falsifiability (does it alert us when it is not good to use, i.e. when assumptions are violated?)
Tree-building techniques have also gained the attention of mathematicians. Trees can also be built using T-theory.[13]
Limitations
Although phylogenetic trees produced on the basis of sequenced genes or genomic data in different species can provide evolutionary insight, they have important limitations. Most importantly, they do not necessarily accurately represent the evolutionary history of the included taxa. In fact, they are literally scientific hypotheses, subject to falsification by further study (e.g., gathering of additional data, analyzing the existing data with improved methods). The data on which they are based is noisy;[14] the analysis can be confounded by genetic recombination,[15] horizontal gene transfer,[16] hybridisation between species that were not nearest neighbors on the tree before hybridisation takes place, convergent evolution, and conserved sequences.
Also, there are problems in basing the analysis on a single type of character, such as a single gene or protein or only on morphological analysis, because such trees constructed from another unrelated data source often differ from the first, and therefore great care is needed in inferring phylogenetic relationships among species. This is most true of genetic material that is subject to lateral gene transfer and recombination, where different haplotype blocks can have different histories. In general, the output tree of a phylogenetic analysis is an estimate of the character's phylogeny (i.e. a gene tree) and not the phylogeny of the taxa (i.e. species tree) from which these characters were sampled, though ideally, both should be very close. For this reason, serious phylogenetic studies generally use a combination of genes that come from different genomic sources (e.g., from mitochondrial or plastid vs. nuclear genomes), or genes that would be expected to evolve under different selective regimes, so that homoplasy (false homology) would be unlikely to result from natural selection.
When extinct species are included in a tree, they are terminal nodes, as it is unlikely that they are direct ancestors of any extant species. Skepticism might be applied when extinct species are included in trees that are wholly or partly based on DNA sequence data, because little useful "ancient DNA" is preserved for longer than 100,000 years, and except in the most unusual circumstances no DNA sequences long enough for use in phylogenetic analyses have yet been recovered from material over 1 million years old.
The range of useful DNA materials has expanded with advances in extraction and sequencing technologies. Development of technologies able to infer sequences from smaller fragments, or from spatial patterns of DNA degradation products, would further expand the range of DNA considered useful.
In some organisms, endosymbionts have an independent genetic history from the host.
Phylogenetic networks are used when bifurcating trees are not suitable, due to these complications which suggest a more reticulate evolutionary history of the organisms sampled.
See also
References
- ↑ Bailly, Anatole (1981-01-01). Abrégé du dictionnaire grec français. Paris: Hachette. ISBN 978-2010035289. OCLC 461974285.
- ↑ Bailly, Anatole. "Greek-french dictionary online". www.tabularium.be. Archived from the original on December 3, 2017. Retrieved March 2, 2018.
- ↑ Hodge T, Cope M (1 October 2000). "A myosin family tree". J Cell Sci. 113 (19): 3353–4. PMID 10984423. Archived from the original on 30 September 2007.
- ↑ "Archived copy". Archived from the original on 2014-04-14. Retrieved 2014-05-26.
- ↑ Maher BA (2002). "Uprooting the Tree of Life". The Scientist. 16: 18. Archived from the original on 2003-10-02.
- 1 2 3 Felsenstein J. (2004). Inferring Phylogenies Sinauer Associates: Sunderland, MA.
- ↑ Letunic, Ivica; Bork, Peer (1 January 2007). "Interactive Tree Of Life (iTOL): an online tool for phylogenetic tree display and annotation" (PDF). Bioinformatics. Cambridge. 23 (1): 127–128. doi:10.1093/bioinformatics/btl529. ISSN 1367-4803. PMID 17050570. Archived (PDF) from the original on November 29, 2015. Retrieved 2015-07-21.
- ↑ Ciccarelli, FD; Doerks, T; Von Mering, C; Creevey, CJ; Snel, B; Bork, P (2006). "Toward automatic reconstruction of a highly resolved tree of life" (Submitted manuscript). Science. 311 (5765): 1283–7. Bibcode:2006Sci...311.1283C. doi:10.1126/science.1123061. PMID 16513982.
- ↑ Fox, Emily. "The dendrogram". coursea. coursea. Archived from the original on 28 September 2017. Retrieved 28 September 2017.
- ↑ Mayr, Ernst (2009)"Cladistic analysis or cladistic classification?". Journal of Zoological Systematics and Evolutionary Research. 12: 94–128. doi:10.1111/j.1439-0469.1974.tb00160.x..
- ↑ Antonio Soares, Ricardo Râbelo, Alexandre Delbem, Optimization based on phylogram analysis, In Expert Systems with Applications, Volume 78, 2017, Pages 32-50, ISSN 0957-4174, https://doi.org/10.1016/j.eswa.2017.02.012.
- ↑ Penny, D.; Hendy, M. D.; Steel, M. A. (1992). "Progress with methods for constructing evolutionary trees". Trends in Ecology and Evolution. 7 (3): 73–79. doi:10.1016/0169-5347(92)90244-6. PMID 21235960.
- ↑ A. Dress, K. T. Huber, and V. Moulton. 2001. Metric Spaces in Pure and Applied Mathematics. Documenta Mathematica LSU 2001: 121-139
- ↑ Townsend JP, Su Z, Tekle Y (2012). "Phylogenetic Signal and Noise: Predicting the Power of a Data Set to Resolve Phylogeny". Genetics. 61 (5): 835–849. doi:10.1093/sysbio/sys036. PMID 22389443.
- ↑ Arenas M, Posada D (2010). "The effect of recombination on the reconstruction of ancestral sequences". Genetics. 184 (4): 1133–1139. doi:10.1534/genetics.109.113423. PMC 2865913. PMID 20124027.
- ↑ Woese C (2002). "On the evolution of cells". Proc Natl Acad Sci USA. 99 (13): 8742–7. Bibcode:2002PNAS...99.8742W. doi:10.1073/pnas.132266999. PMC 124369. PMID 12077305.
Further reading
- Schuh, R. T. and A. V. Z. Brower. 2009. Biological Systematics: principles and applications (2nd edn.) ISBN 978-0-8014-4799-0
- Manuel Lima, The Book of Trees: Visualizing Branches of Knowledge, 2014, Princeton Architectural Press, New York.
- MEGA, a free software to draw phylogenetic trees.
External links
| Wikimedia Commons has media related to Phylogenetic tree. |
Images
General
- An overview of different methods of tree visualization is available at Page, R. D. M. (2011). "Space, time, form: Viewing the Tree of Life". Trends in Ecology & Evolution. 27 (2): 113–120. doi:10.1016/j.tree.2011.12.002.
- Discover Life An interactive tree based on the U.S. National Science Foundation's Assembling the Tree of Life Project
- PhyloCode
- A Multiple Alignment of 139 Myosin Sequences and a Phylogenetic Tree
- Tree of Life Web Project
- Phylogenetic inferring on the T-REX server
- NCBI's Taxonomy Database
- ETE: A Python Environment for Tree Exploration This is a programming library to analyze, manipulate and visualize phylogenetic trees. Ref.
- A daily-updated tree of (sequenced) life Fang, H.; Oates, M. E.; Pethica, R. B.; Greenwood, J. M.; Sardar, A. J.; Rackham, O. J. L.; Donoghue, P. C. J.; Stamatakis, A.; De Lima Morais, D. A.; Gough, J. (2013). "A daily-updated tree of (sequenced) life as a reference for genome research". Scientific Reports. 3: 2015. Bibcode:2013NatSR...3E2015F. doi:10.1038/srep02015. PMID 23778980.
| Relevant fields | |
|---|---|
| Basic concepts | |
| Inference methods | |
| Current topics | |
| Group traits | |
| Group types | |
| Nomenclature | |
| |