Pennsylvania House of Representatives, District 166
 | |
| Current | Greg Vitali (D–Haverford) |
|---|---|
| Demographics |
87.5% White 5.3% Black 2.8% Hispanic |
| Population (2011) • Citizen voting age |
61,878 48,869 |
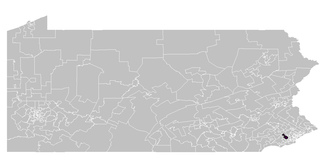
The 166th Pennsylvania House of Representatives District is in South Eastern Pennsylvania and has been represented by Greg Vitali since 1993.
District profile
The 166th Pennsylvania House of Representatives District is located in Delaware County and Montgomery County and includes the following areas:[1]
- Delaware County
- Haverford Township (PART, Wards 02, 03, 04, 05, 06, 07 and 08)
- Radnor Township (PART)
- Ward 01 [PART, Division 02]
- Ward 02
- Ward 03 [PART, Division 02]
- Ward 05 [PART, Division 01]
- Ward 07
- Montgomery County
- Lower Merion Township (PART)
- Ward 04
- Ward 08
- Ward 10 [PART, Division 03]
- Lower Merion Township (PART)
Representatives
| Representative | Party | Years | District home | Note |
|---|---|---|---|---|
| Prior to 1969, seats were apportioned by county. | ||||
| George R. Johnson | Republican | 1969 – 1972 | ||
| Faith Ryan Whittlesey | Republican | 1973 – 1976 | Resigned from office[2] | |
| Stephen F. Freind | Republican | 1976 – 1992 | Elected in a special election in April 1976[3] | |
| Greg Vitali | Democrat | 1993 – present | Haverford Township | Incumbent |
Recent election results
| Party | Candidate | Votes | % | ± | |
|---|---|---|---|---|---|
| style="background-color: Template:Democtatic Party (United States)/meta/color; width: 5px;" | | Template:Democtatic Party (United States)/meta/shortname | Greg vitali | 14,924 | 58.29 | |
| style="background-color: Template:Rebuplican Party (United States)/meta/color; width: 5px;" | | Template:Rebuplican Party (United States)/meta/shortname | John Williamson | 10,678 | 41.71 | |
| Margin of victory | 4,246 | 16.58 | |||
| Turnout | 25,602 | 100 | |||
Recent election results
| Party | Candidate | Votes | % | ± | |
|---|---|---|---|---|---|
| Democratic | Greg Vitali | 21,611 | 63.1 | ||
| Republican | Bill toal | 12,637 | 36.9 | ||
| Margin of victory | 8,974 | 26.2 | |||
| Turnout | 34,248 | 100 | |||
Recent election results
| Party | Candidate | Votes | % | ± | |
|---|---|---|---|---|---|
| Democratic | Greg Vitali | 14,325 | 63.1 | ||
| Republican | Sarah Armstrong | 8,375 | 36.9 | ||
| Margin of victory | 5,950 | 26.2 | |||
| Turnout | 22,700 | 100 | |||
Recent election results
| Party | Candidate | Votes | % | ± | |
|---|---|---|---|---|---|
| Democratic | Greg Vitali | 23,783 | 66.03 | ||
| Republican | James Knapp | 12,236 | 33.97 | ||
| Margin of victory | 11,547 | 32.06 | |||
| Turnout | 36,019 | 100 | |||
References
- Cox, Harold (2004). "Legislatures - 1776-2004". Wilkes University Election Statistics Project. Wilkes University.
- ↑ "Composite Listing of House of Representatives Districts" (PDF). Pennsylvania Department of State. Retrieved 2015-02-19.
- ↑ Cox, Harold (November 3, 2004). "Pennsylvania House of Representatives - 1975-1976" (PDF). Wilkes University Election Statistics Project. Wilkes University.
- ↑ Cox, Harold (November 3, 2004). "Pennsylvania House of Representatives - 1975-1976" (PDF). Wilkes University Election Statistics Project. Wilkes University.
External Links
- District map from the United States Census Bureau
- Pennsylvania House Legislative District Maps from the Pennsylvania Redistricting Commission.
- Population Data for District 44 from the Pennsylvania Redistricting Commission.
| Topics |  | |
|---|---|---|
| Elections | ||
| Districts |
| |
This article is issued from
Wikipedia.
The text is licensed under Creative Commons - Attribution - Sharealike.
Additional terms may apply for the media files.