Palmview, Texas
| Palmview, Texas | |
|---|---|
| City | |
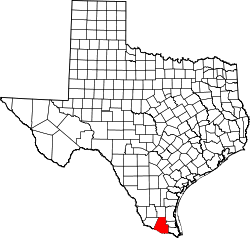
 Location of Palmview, Texas | |
 | |
| Coordinates: 26°13′36″N 98°22′32″W / 26.22667°N 98.37556°WCoordinates: 26°13′36″N 98°22′32″W / 26.22667°N 98.37556°W | |
| Country |
|
| State |
|
| County |
|
| Incorporated | 1978[1] |
| Area | |
| • Total | 2.82 sq mi (7.31 km2) |
| • Land | 2.82 sq mi (7.31 km2) |
| • Water | 0.0 sq mi (0.0 km2) |
| Elevation | 148 ft (45 m) |
| Population (2010) | |
| • Total | 5,460 |
| • Density | 1,934/sq mi (746.9/km2) |
| Time zone | UTC-6 (Central (CST)) |
| • Summer (DST) | UTC-5 (CDT) |
| ZIP codes | 78539, 78572 |
| Area code(s) | 956 |
| FIPS code | 48-54804[2] |
| GNIS feature ID | 1388588[3] |
| Website |
cityofpalmview |
Palmview is a city in Hidalgo County, Texas. The population was 5,460 at the 2010 United States Census.[4] It is part of the McAllen–Edinburg–Mission and Reynosa–McAllen metropolitan areas.
Geography
Palmview is in southwestern Hidalgo County, to the west of Mission. U.S. Route 83 passes through the city as a freeway, leading east 10 miles (16 km) to McAllen and west 30 miles (48 km) to Rio Grande City.
According to the United States Census Bureau, Palmview has a total area of 2.8 square miles (7.3 km2), all land.[4]
Demographics
| Historical population | |||
|---|---|---|---|
| Census | Pop. | %± | |
| 1980 | 683 | — | |
| 1990 | 1,818 | 166.2% | |
| 2000 | 4,107 | 125.9% | |
| 2010 | 5,460 | 32.9% | |
| Est. 2016 | 5,745 | [5] | 5.2% |
| U.S. Decennial Census[6] | |||
As of the census[2] of 2000, there were 4,107 people, 1,093 households, and 977 families residing in the city. The population density was 1,712.5 people per square mile (660.7/km²). There were 1,671 housing units at an average density of 696.7 per square mile (268.8/km²). The racial makeup of the city was 67.35% White, 0.02% Black, 0.12% Native American, 0.12% Asian, 31.19% from other races, and 1.19% from two or more races. Hispanic or Latino of any race were 93.21% of the population.
There were 1,093 households out of which 57.7% had children under the age of 18 living with them, 73.8% were married couples living together, 12.0% had a female householder with no husband present, and 10.6% were non-families. 9.2% of all households were made up of individuals and 4.8% had someone living alone who was 65 years of age or older. The average household size was 3.76 and the average family size was 4.01.
In the city, the population was spread out with 37.2% under the age of 18, 12.0% from 18 to 24, 29.0% from 25 to 44, 13.5% from 45 to 64, and 8.3% who were 65 years of age or older. The median age was 26 years. For every 100 females, there were 96.5 males. For every 100 females age 18 and over, there were 89.0 males.
The median income for a household in the city was $27,000, and the median income for a family was $29,936. Males had a median income of $23,854 versus $21,250 for females. The per capita income for the city was $10,193. About 25.2% of families and 28.6% of the population were below the poverty line, including 35.1% of those under age 18 and 11.1% of those age 65 or over.
Education
Palmview is served by the La Joya Independent School District. Zoned schools include:[7][8]
- Elementary: Enrique Camarena, Guillermo Flores, Henry B. González, Leo J. Leo, and E. B. Reyna[9]
- Middle: C. Chavez, Irene Garcia, Memorial, and A. Richards[10]
- Palmview High School and La Joya High School[11]
In addition, South Texas Independent School District and IDEA Public Schools (Charter) operates magnet schools that serve the community.
City government
References
- ↑ https://cityofpalmview.com/palmview-on-track-to-get-sewer-service-for-first-time/
- 1 2 "American FactFinder". United States Census Bureau. Retrieved 2008-01-31.
- ↑ "US Board on Geographic Names". United States Geological Survey. 2007-10-25. Retrieved 2008-01-31.
- 1 2 "Geographic Identifiers: 2010 Census Summary File 1 (G001): Palmview city, Texas". American Factfinder. U.S. Census Bureau. Retrieved February 16, 2018.
- ↑ "Population and Housing Unit Estimates". Retrieved June 9, 2017.
- ↑ "Census of Population and Housing". Census.gov. Retrieved June 4, 2015.
- ↑ "2010 CENSUS - CENSUS BLOCK MAP (INDEX): Palmview city, TX." U.S. Census Bureau. Retrieved on September 16, 2018. Pages: 1 and 2
- ↑ "SCHOOL DISTRICT REFERENCE MAP (2010 CENSUS): Hidalgo County, TX." U.S. Census Bureau. Retrieved on August 2, 2018.
- ↑ "Elementary School Zones 2017-2018." La Joya Independent School District. Retrieved on September 16, 2018.
- ↑ "Middle School Zones 2017-2018." La Joya Independent School District. Retrieved on September 16, 2018.
- ↑ "High School Zones 2017-2018." La Joya Independent School District. Retrieved on September 16, 2018.