World oil market chronology from 2003
- This article is a chronology of events affecting the oil market. For a discussion of the energy crisis of the same period, see 2000s energy crisis and Effects of 2000s energy crisis. For current fuel prices see Gasoline usage and pricing.
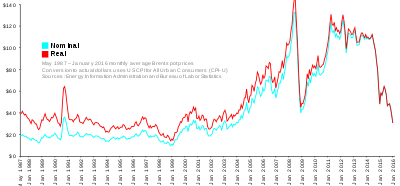
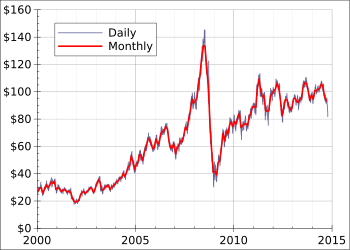
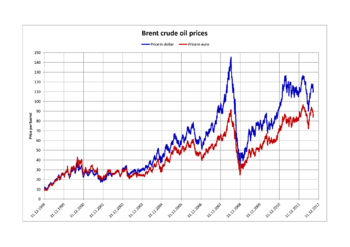
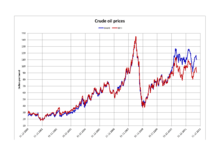
From the mid-198s to September 2003, the inflation adjusted price of a barrel of crude oil on NYMEX was generally under $25/barrel. Then, during 2004, the price rose above $40, and then $60. A series of events led the price to exceed $60 by August 11, 2005, leading to a record-speed hike that reached $75 by the middle of 2006. Prices then dropped back to $60/barrel by the early part of 2007 before rising steeply again to $92/barrel by October 2007, and $99.29/barrel for December futures in New York on November 21, 2007.[1] Throughout the first half of 2008, oil regularly reached record high prices.[2][3][4][5] Prices on June 27, 2008, touched $141.71/barrel, for August delivery in the New York Mercantile Exchange, amid Libya's threat to cut output, and OPEC's president predicted prices may reach $170 by the Northern summer.[6][7] The highest recorded price per barrel maximum of $147.02 was reached on July 11, 2008.[8] After falling below $100 in the late summer of 2008, prices rose again in late September. On September 22, oil rose over $25 to $130 before settling again to $120.92, marking a record one-day gain of $16.37. Electronic crude oil trading was temporarily halted by NYMEX when the daily price rise limit of $10 was reached, but the limit was reset seconds later and trading resumed.[9] By October 16, prices had fallen again to below $70, and on November 6 oil closed below $60.[10] Then in 2009, prices went slightly higher, although not to the extent of the 2005–2007 crisis, exceeding $100 in 2011 and most of 2012. Since late 2013 the oil price has fallen below the $100 mark, plummeting below the $50 mark one year later.
As the price of producing petroleum did not rise significantly, the price increases have coincided with a period of record profits for the oil industry. Between 2004 and 2007, the profits of the six supermajors – ExxonMobil, Total, Shell, BP, Chevron, and ConocoPhillips – totaled $494.8 billion.[11] Likewise, major oil-dependent countries such as Saudi Arabia, the United Arab Emirates, Canada, Russia, Venezuela and Nigeria have benefited economically from surging oil prices during the 2000s.
2003
United States crude oil prices averaged $30 a barrel in 2003 due to political instability within various oil producing nations. It rose 19% from the average in 2002.[12] The 2003 invasion of Iraq marked a significant event for oil markets because Iraq contains a large amount of global oil reserves.[13] The conflict coincided with an increase in global demand for petroleum, but it also reduced Iraq's current oil production and has been blamed for increasing oil prices.[14] However, oil company CEO Matthew Simmons emphasizes the peaking and decline of oil-exporting in Mexico, Indonesia and the United Kingdom is the reason for the price gouging. According to Simmons,[15] isolated events, such as the Iraq war, affect short-term prices but do not determine a long-term trend. Simmons cites the use of enhanced oil recovery techniques in large fields such as Mexico's Cantarell,[15] which maintained production for a few years until it eventually declined. Pumping oil out of Iraq may reduce petroleum prices in the short term, but will be unable to perpetually lower the price. From Simmons' point of view, the invasion of Iraq is associated with the start of long-term increase in oil prices, but it may mitigate the decline in oil production by retaining a partial amount of Iraq's oil reserves. As a direct consequence, the oil production capacity was diminished to 2 million barrels (320,000 m3) per day.[16]
2004 to 2008: rising costs of oil
After retreating for several months in late 2004 and early 2005, crude oil prices rose to new highs in March 2005. The price on NYMEX has been above $50 per barrel since March 5, 2005. In June 2005, crude oil prices broke the psychological barrier of $60 per barrel.
From 2005 onwards, the price elasticity of the crude oil market changed significantly. Before 2005 a small increase in oil price lead to an noticeable expansion of the production volume. Later price rises let the production grow only by small numbers. This was the reason to call 2005 a tipping point.[17]
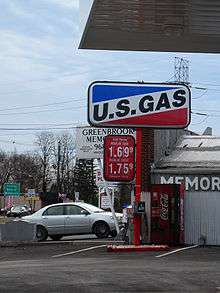
After the destruction of Hurricane Katrina in the United States, gasoline prices reached a record high during the first week of September 2005. The average retail price was, on average, $3.04 per U.S. gallon.[18] The average retail price of a liter of petrol in the United Kingdom was 86.4p on October 19, 2006, or $6.13 per gallon.[19] Oil production in Iraq continued to decline as result of the nation's ongoing conflict causing a decrease in production to 1 million barrels per day (160,000 m3/d).[20]
In mid-2006, crude oil was traded for over USD 79 per barrel (bbl),[21] setting an all-time record. The run-up is attributed to a 1.9 increase in gasoline consumption, geopolitical tensions resulting from North Korea's missile launch. The ongoing Iraq war, as well as Israel and Lebanon going to war are also causative factors. The higher price of oil substantially cut growth of world oil demand in 2006, including a reduction in oil demand of the OECD.[22] After news of North Korea's successful nuclear test on October 9, 2006, oil prices rose past $60 a barrel, but fell back the next day.
On October 19, 2007, U.S. light crude rose to $90.02 per barrel due to a combination of ongoing tensions in eastern Turkey and the reducing strength of the U.S. dollar.[23] Prices fell briefly on the expectation of increased U.S. crude oil stocks, however they quickly rose to a peak of $92.22 on October 26, 2007.[24]
On January 2, 2008, U.S. light crude surpassed $100 per barrel before falling to $99.69 due to tensions on New Years Day in Nigeria, and on suspicion that U.S. crude stocks will have dropped for the seventh consecutive week. A BBC report from the following day stated a single trader bid up the price; Stephen Schork, a former floor trader on the New York Mercantile Exchange and the editor of an oil market newsletter, said one floor trader bought 1,000 barrels (160 m3), the smallest amount permitted, and immediately sold it for $99.40 at a $600 loss.[25] Oil fell back later in the week to $97.91 at the close of trading on Friday, January 4, in part due to a weak jobs report that showed unemployment had risen.[26]
On March 5, 2008, OPEC accused the United States of economic "mismanagement" that was pushing oil prices to record highs, rebuffing calls to boost output and laying blame at the George W. Bush administration.[27] Oil prices surged above $110 to a new inflation-adjusted record on March 12, 2008 before settling at $109.92.[28] On April 18, 2008 the price of oil broke $117 per barrel after a Nigerian militant group claimed an attack on an oil pipeline.[29] Oil prices rose to a new high of $119.90 a barrel on April 22, 2008,[30] before dipping and then rising $3 on April 25, 2008 to $119.10 on the New York Mercantile Exchange after a news report that a ship contracted by the U.S. Military Sealift Command fired at an Iranian boat.[31]
On June 6, prices rose $11 in 24 hours, the largest gain in history due to the possibility of an Israeli attack on Iran.[32] The combination of two major oil suppliers reducing supply generated fears of a repeat of the 1973 oil crisis. The mid-July decision of Saudi Arabia to increase oil output caused little significant influence on prices. According to the oil minister of the Islamic Republic of Iran, Gholam-Hossein Nozari, the world markets were saturated[33] and a Saudi promise of increased production would not lower prices.[34] Several Asian refineries were refusing Saudi petroleum in late June because they were over priced grade.[35]
On July 3, "the Brent North Sea crude contract for August delivery rose to $US145.01 a barrel" in Asian trade.[36] London Brent crude reached a record of $145.75 a barrel, and Brent crude for August delivery peaked to a record $145.11 a barrel on London's ICE Futures Europe exchange, and to $144.44 a barrel on the NYMExchange.[37][38] By midday in Europe, crude rose to $145.85 a barrel on the NYME while Brent crude futures rose to a trading record of $146.69 a barrel on the ICE Futures exchange.[39][40]
2008: oil prices peak at $145.85 then bottom at $32
On July 15, 2008, a bubble-bursting sell-off began after remarks by President Bush the previous day that the ban on oil drilling would be lifted.[41] This precipitated an $8 drop, the biggest since the first US-Iraq war. By the end of the week, crude oil fell 11% to $128, also affected by easing of tensions between the US and Iran.[42] By August 13, prices had fallen to $113 a barrel.[43] By the middle of September, oil price fell below $100 for the first time in over six months,[44] falling below $92 in the aftermath of the Lehman Brothers bankruptcy.[45]
A stronger US dollar and a likely decline in European demand were suggested to be among the causes of the decline.[46] By October 24, the price of crude dropped to $64.15,[47] and closed at $60.77 on November 6.[10] By the end of December, 2008, oil had bottomed out at $32.
2009
In January 2009, oil prices rose temporarily because of tensions in the Gaza Strip.[48] From mid January to February 13, oil fell to near $35 a barrel.[49]
2010
On May 21, 2010, the price of oil had dropped in two weeks from $88 to $70 mainly due to concerns over how European countries would reduce budget deficits; if the European economy slowed down, this would mean less demand for crude oil. Also, if the European economic crisis caused the American economy to have problems, demand for oil would be reduced further.[50] Other factors included the strong dollar and high inventories. According to the U.S. Energy Information Administration, gas prices nationwide averaged $2.91 on May 10, dropping to $2.79 two weeks later. The Deepwater Horizon oil spill was not a factor in gas prices since the well had not produced.[51]
Prices rose back to $90/barrel in December 2010.[52] The US average for a gallon of 87 octane regular unleaded averaged $3.00/gallon on December 23, sparking fear of a second recession if prices reached $100/barrel and $4.00/gallon gasoline, as forecasted for spring 2011. The price increases in December were based on global demand and the Arctic blasts affecting North America and Europe.
2011
Political turmoil in Egypt, Libya, Yemen, and Bahrain drove oil prices to $95/barrel in late February 2011. A few days prior, oil prices on the NYMEX closed at $86. Oil prices topped at $103 on February 24 where oil production is curtailed to the political upheaval in Libya.[53]
Oil supplies remained high, and Saudi Arabia assured an increase in production to counteract shutdowns. Still, the Mideast and North African crisis led to a rise in oil prices to the highest level in two years, with gasoline prices following. Though most Libyan oil went to Europe, all oil prices reacted. The average price of gasoline in the United States increased 6 cents to $3.17.[54] On March 1, 2011, a significant drop in Libyan production and fears of more instability in other countries pushed the price of oil over $100 a barrel in New York trading, while the average price of gas reached $3.37. Despite Saudi promises, the sour type oil the country exported could not replace the more desirable sweet Libyan oil.[55] On March 7, 2011, the average price of gas having reached $3.57, individuals were making changes in their driving.[56]
The weakened U.S. Dollar resulted in a spike to $112/barrel with the national average of $3.74/gallon – with expectations of damaging the U.S. economy suggestive of a long-term recession.[57] As of April 26, the national average was $3.87 – with a fear of $4/gallon as the nationwide average prior to the summer driving season.[58]
The national average rose on May 5, 2011 for the 44th straight day, reaching $3.98. However, that same day, West Texas Intermediate crude fell below $100 a barrel, the lowest since March 16.[59] This came after crude oil for June delivery reached $114.83 on May 2, the highest since September 2008, before closing at $97.18 on May 6, a day after dropping 9 percent, the most dramatic single-day drop in over two years. Gas prices fell slightly on May 6, and experts predicted $3.50 a gallon by summer.[60][61][62]
In mid-June, West Texas Intermediate crude for July delivery fell nearly $2 to $93.01, the lowest price since February. The dollar was up and the euro and other currencies down, and the European economic crisis made investors concerned. London Brent crude fell 81 cents to $113.21. On June 15 the Energy Information Association said oil consumption was down 3.5 percent from a year earlier, but wholesale gasoline demand was up for the first time in several weeks. The price of gas on June 17 was $3.67.5 a gallon, 25.1 cents lower than a month earlier but 96.8 cents above a year earlier.[63] On June 24, the price of gas was $3.62.8 and expected to go much lower due to the opening of the Strategic Petroleum Reserve. U.S. oil prices fell below $90 before rising again, and Brent crude fell two percent.[64] However, on June 29, West Texas intermediate crude had risen to $94.96, almost $5 above the lowest point reached after the previous week's action. One reason was the falling dollar, as Greece appeared less likely to default on its debt; concern over the Greek debt crisis had caused falling oil prices.[65][66] After another week, oil for August delivery had risen from $90.61 to $98.67 and gas prices were up five cents. Increased worldwide demand was one reason.[67] Brent Crude remained high at $118.38 partly due to supply problems in Europe, including lower North Sea production and the continuing war in Libya.[68]
On August 4, the price of oil dropped 6 percent to its lowest level in 6 months. On August 5, the price had dropped $8.82 in a week to $86.88 per barrel on the New York Mercantile Exchange. The same pessimistic economic news that caused stock prices to fall also decreased expected energy demand, and experts predicted a gas price drop of 35 cents per gallon from the average of $3.70.[69] On August 8, oil fell over 6 percent, in its largest drop since May, to $81, its lowest price of the year.[70] On September 24, oil reached $79.85, down 9 percent for the week, due to concerns about another recession and the overall world economy. The average price of gas was $3.51, with predictions of $3.25 by November, but it was below $3 in some markets.[71]
During October, the price of oil rose 22 percent, the fastest pace since February, as worries over the U.S. economy decreased, leading to predictions of $4 by early 2012. As of November 8, the price reached $96.80. Gas prices were not following the increase, due to lower demand resulting from the economy, the normal decrease in travel, lower oil prices in other countries, and production of winter blends which cost less. The average rose slightly to $3.41 but predictions of $3.25 were made.[72]
2012
Shortages of oil could have resulted if Iran closed the Strait of Hormuz, through which one-fifth of exported oil travels, as a result of sanctions due to the country's nuclear policies. The price of oil stayed near $100 throughout January because of concerns over supplies, and the European debt situation. The average price of gas was $3.38 on January 20, up 17 cents from a month earlier.[73][74] Another factor was planned closing of refineries in the U.S. and Europe due to lower demand.[75] By early February, the national average was $3.48, though oil prices were at $98, the lowest in six weeks, and U.S. demand was the lowest since September 2001.[76] On February 20, benchmark March crude oil reached $105.21, the highest in nine months. This came one day after Iran's oil ministry announced an end to sales to British and French companies; though this would have little actual impact on supplies, fears resulted in higher prices. Also, approval of the bailout plan for Greece was expected, and China's action to raise the money supply was likely to stimulate the economy.[77] Brent crude was up 11 percent for the year to $119.58 on February 17, with cold weather in Europe and higher Third World demand, and West Texas Intermediate crude was up 19 percent to $103.24. The average price of gas was $3.53.[78] On February 29, the average was $3.73.[79] The average peaked at $3.94 early in April,[80][81][82][83] and on April 24, it was $3.85 compared to $3.86 a year earlier; it had been two years since gas prices were lower than the previous year. Crude oil prices were down; West Texas Intermediate was $103.55 a barrel,[84] down from over $107 late in March,[85] and Brent Crude $118.16[84] after peaking above $128 in March.[86] On May 7, benchmark U.S. crude reached $95.34, the lowest price of the year, after voters in France and Greece ousted government officials who would cut spending to solve the debt crisis.[87] Benchmark oil in New York actually rose for two days straight early in June, to $84.29. With U.S. oil supplies the highest since 1990, gas reached $3.57 on June 5.[88] After falling again to its lowest price since October 2011, Benchmark crude rose 5.8 percent to $82.18 on June 29, with Brent crude up 4.5 percent to $95.51. European bailout efforts included lending money to banks, decreasing likelihood of failures. Also, European countries decided not to buy Iranian oil. The price of gas was $3.35, the lowest since January 6.[89] On July 17, Benchmark Crude reached $89.22 and Brent crude $104 after good economic news in the United States. Gas rose to $3.40.[90]
On August 7, a California refinery fire contributed to a jump in oil futures. Other refinery problems, a pipeline leak, fears about Iran, the crisis in Syria, North Sea problems, and Tropical Storm Ernesto all contributed to a 20 percent jump in oil prices in six weeks. The price of gas reached $3.63 but was not expected to go much higher.[91] Good economic news in the United States contributed to oil reaching its highest price since May on August 17, with Benchmark Crude reaching $96.01, while Brent crude fell slightly to $113.71.[92]
Early in September, a mix of bad economic news from the United States and good economic news from Europe caused the price of oil to fall slightly. On September 4, Benchmark Crude reached $95.41, with Brent crude at $114.84. The price of gas went down slightly to $3.82[93] but was still the highest ever for Labor Day weekend.[94] Hurricane Isaac contributed to a temporary spike in gas prices, but on September 12 gas once again rose, to $3.86, as refineries cut production prior to the switch from summer blend gasoline to winter blend. Benchmark Crude also reached its highest level since early May and continued to rise above $99 after Federal Reserve announcements of actions to improve the economy and the 2012 diplomatic missions attacks. Brent crude rose slightly to nearly $116.[95][96][97] Early in October, the average gas price was $3.78 and falling, though still a record for the month.[98] Late in the month, the average reached $3.62 after a 13-cent drop in a week, the most since November 2008. Brent crude was down $8 in the previous month.[99] By the start of November, the average was $3.54, partly due to lower demand after Hurricane Sandy.[100] Crude oil futures fell after Barack Obama was re-elected November 6.[101] After Thanksgiving, lower U.S. oil inventories, good economic news in the United States and good news relating to the Greek bailout helped push Brent crude up to $111.04, and benchmark oil for January delivery to $87.92; benchmark oil reached $86.24 on November 28, and gas was $3.41.[102][103]
On December 13, Brent crude was down to $109.20, while benchmark oil fell slightly due to U.S. fiscal cliff concerns and rose due to Federal Reserve efforts to help the U.S. economy, ending the day at $86.77.[104] In mid-December, gas prices reached $3.25, the lowest for 2012.[105] Oil was trading for between $84 and $90.[106]
2013
On January 17, with good economic news in the United States, Benchmark oil reached its highest level since September, going over $95. Brent crude rose above $110. Gas was at $3.29.[107]
Refinery shutdowns led to a dramatic rise in gas prices. Late in February, gas was at $3.78, up 14 cents from a week earlier.[108][109] On February 25, with European stock markets doing well, Benchmark crude for April rose above $94 after a significant drop the previous week due to news the Federal Reserve might end its stimulus efforts, making the dollar stronger. Brent crude was over $115.[110] Two days later gas reached its highest point, $3.79 a gallon. By mid-April, with low demand expected due to negative economic news, gas was down to $3.56 as Brent crude fell to $103.04, its lowest price since July.[111] With economic problems worldwide leading to low demand, gas prices fell 3 percent in April, the most in a month in ten years, to the lowest level for that month since 2010.[112]
Before Memorial Day, when gas was $3.63,[113] gas supplies fell even though oil supplies were the highest in 35 years. U.S. economic news was also negative. On May 30, Benchmark crude for July rose slightly to $93.61 after falling the previous day, and Brent crude fell slightly to $102.19.[114] On June 5 the price of oil rose again with supplies lower. Benchmark crude rose above $94. The price of gas was $3.62.[115] On June 12, the International Energy Agency said demand for oil would still rise in 2013, but not as much as previously believed due to the economy. Also, May OPEC production was the highest in seven months. Benchmark crude fell slightly to $95.31, and Brent crude rose to $103.27.[116] On June 20, with the Federal Reserve stating that its stimulus program could end if the U.S. economy continued to improve, as well as economic problems in China, Benchmark crude fell below $97. Brent crude fell to $104.24.[117]
On July 10, oil prices were the highest in more than a year as a result of lower supplies and trouble in Egypt. In the past week, Brent crude had climbed 7 percent to $108.51. Because too much oil was being produced for the infrastructure to handle it, West Texas Intermediate was lower than Brent crude for several years; it has returned to being consistent with Brent.[118][119] On July 5 it reached $103.22.[120] On July 19 with good economic news in the United States, Benchmark crude reached $108.05, while gas was $3.67, the highest on a Friday since March 22. Brent crude was at $108.07.[121] Gas was $3.63 on August 1, though good economic news in the U.S., China and Europe meant oil was going up again after a decline the previous week. Benchmark crude reached $107.89, while Brent crude was $109.54.[122] On August 16 Benchmark oil was $107.46 after six days of increases as Egypt's problems continued. The concern was access to the Suez Canal, which appears unlikely to be a problem but still concerns companies. Brent crude was $110.48 on August 19.[123] On August 28 West Texas intermediate reached $110.10, the highest since May 2011, and Brent crude reached $116.61, its highest point since February 19, due to concern about U.S. involvement in Syria. Meanwhile, inventories in the United States had their biggest increase in four months.[124] Benchmark crude rose to $107.56 on September 11 due to lower supplies after dropping due to hopes for a peaceful Syria solution; Brent crude rose to $111.50.[125]
Gas was $3.59 at the start of the month, but at the end of September, the price of gas was $3.39, the lowest for the time of year since 2010. The New York Mercantile Exchange price on September 27 was $102.87. Refineries had no hurricanes or other problems.[126][127] Benchmark crude fell to $103.31 on October 3 after the U.S. government shutdown, and Brent crude was $109.[128] On October 21, Benchmark crude was $99.22, the first time below $100 since July. Higher supplies and fewer threats from the Middle East were the reasons. Brent crude was $109.64 and gas reached $3.35.[129] On November 13, Brent crude reached $107.12 and was $13.24 higher than West Texas Intermediate, the largest difference since April, due to trouble in Libya and sanctions against Iran.[130] On November 25, Benchmark crude decreased to $93.92 while Brent crude reached $110.41 after the agreement regarding Iran's nuclear program.[131] On December 16, Benchmark crude rose to $97.44 and Brent crude reached $110.53 with good economic news from Europe and more Libya trouble. Gas was $3.23, three cents higher than a month earlier.[132] On December 27, due to a better economy in the United States leading to higher demand, oil closed about $100 for the first time since October. Gas was $3.27, two cents below a year earlier.[133]
2014
On January 2, Benchmark crude fell by the most in one day since November 2012 to close at $95.44. Brent crude was $107.78. Gas was $3.33.[133] With the Iran agreement and increased production from Libya and the North Sea, Benchmark oil was around $92 on January 13 and Brent crude was $105.98.[134] After good economic news from Japan, Benchmark crude fell slightly from its highest close of 2014, $98.23 on January 30. Brent crude fell to $107.25. The difference between the two fell below $10 for the first time since November, partly due to cold weather in the United States which resulted in high heating oil demand.[135] Early in February gas was $3.27.[136] Cold weather led to the price of oil staying above $100 for most of February, but lower prices were expected. With United States fourth quarter economic growth expected to be lower than an early estimate, Benchmark crude fell slightly on February 27 to $102.40, with Brent crude reaching $108.61.[137] On March 24, due to the dispute over Crimea, problems in Libya, and the Houston Ship Channel collision, Benchmark crude rose above $100 and Brent crude rose to $107.41. Economic problems in China kept prices from going even higher.[138] Later in the week, good economic news from the United States, lower oil supplies in Oklahoma and a force majeure by Shell Nigeria pushed prices slightly higher, to $102.12 for Benchmark crude and $108.29 for Brent.[139] On April 7, Benchmark crude fell below $101 and Brent crude fell to $105.64 with news that Libya might open more terminals in May,[140] but more Ukraine problems pushed the prices back up on April 8.[141] Gas was $3.59, matching the level in 2013.[136]
Continued Ukraine problems pushed oil higher on April 24, with Benchmark crude at $101.94 and Brent crude at $110.33, though an April 23 report said U.S. oil supplies were higher than expected. The price of gas was $3.68.5, the highest since March 2013.[142] On April 30, Benchmark crude dropped below $100 for the first time in three weeks as oil supplies continued to rise and the unusually cold winter resulted in negative U.S. economic news. Gas was up 14 cents for the month, the most in three years.[143] More Ukraine trouble pushed Benchmark crude above $100 and Brent crude over $108 on May 12,[144] and further problems in Libya helped push Benchmark crude over $102 and Brent crude over $110 by May 15, though negative economic news in the U.S. and an unexpected increase in oil stockpiles pushed Benchmark crude back down temporarily.[145][146] Continued concerns over Ukraine and Libya pushed oil back above $104.[147] The price of gas was $3.65.[113]
Trouble in Iraq resulted in higher prices for oil and gas in June. West Texas crude reached $106 and Brent crude $115.75. At the end of the month Benchmark crude was just above $105 while Brent crude fell below $113.[148][149] The price of gas was $3.66.[150]
After three weeks of going down, U.S. crude fell below $100 for the first time since May on July 15. However, with Middle East and Ukraine problems sending oil higher, Benchmark crude finished July 18 just above $103, with Brent crude staying above $107.[151] With low demand and plentiful supplies, and despite good economic news from China and the United States, Brent crude fell below $107 on July 24, and U.S. crude dropped to $102.10.[152] On July 28, gas was $3.52, down five cents from a week earlier, due to refiners cutting prices.[153] Two weeks later gas was $3.48, less than a year earlier.[154] And on August 14, light sweet oil was $95.58, the lowest since January, while Brent crude reached $102.01, the lowest since June, after falling the most in one day since January. Production in Libya was up, and economic slowdowns were expected in Europe and China, making even lower prices likely.[155]
As of Labor Day, gas was $3.41, 18 cents lower than in 2013. Low demand and high North American production cancelled out effects of troubles in the Middle East and Ukraine. West Texas crude was below $94 on August 27 and Brent crude below $103.[148] On October 16, West Texas crude fell below $80 for the first time in more than two years, while Brent crude reached $82.60, the lowest since November 2010. OPEC Members were not expected to act as increases in the U.S. supply resulting from high oil shale production added to a worldwide surplus.[156] On October 31, the average price of gas reached $3 and was expected to go below that figure for the first time since December 2010. Demand for oil was down and there were many new sources. United States oil production was up 70 percent since 2008, and Iraq and Canada were producing more.[157] According to the Lundberg survey released December 7, gas was down 12 cents from two weeks earlier to $2.72. Demand was low while production was high, and the strong dollar contributed.[158] With demand low in China and Europe and OPEC deciding not to cut back, West Texas Intermediate reached $63.50 on December 8, the lowest since July 2009, while Brent crude reached $66.90, a level not seen since October 2009.[159] After Saudi Arabia oil minister Ali Al-Naimi said OPEC members could not cut production on their own,[160] oil prices rose slightly December 18 but finished the day lower with Benchmark crude at $54.11 and Brent crude $59.27, both the lowest since May 2009.[161] Gas was $2.49 a gallon.[162] Days later gas was $2.38, the lowest in five years, after 89 straight days of going down, the longest continuous decline ever according to AAA. The price of oil was down 50 percent since April, while gas had fallen 36 percent. Economic problems in Europe and Asia, high gas mileage, a strong dollar, higher U.S. production and no action by OPEC have been credited.[163]
By 12 December 2014, the price of benchmark crude oil, both Brent and WTI reached their lowest prices since 2009. Brent crude oil and accordingly to all type of Crude Oil dropped to US$62.75 a barrel for January delivery on the London-based ICE Futures Europe exchange and futures for West Texas Intermediate (WTI) for January settlement slid to $58.80 a barrel in electronic trading on the New York Mercantile Exchange (NYME). This represents a 40 percent decrease in 2014.[164] The CIBC reported that the global oil industry continued to produce massive amounts of oil in spite of a stagnant crude oil market. Oil production from the Bakken formation was forecast in 2012 to grow by 600,000 barrels every year through 2016. By 2012 Canadian tight oil and oil sands production was also surging.[165]
In June 2014 crude oil prices dropped by about a third as U.S. shale oil production increased and China and Europe's demand for oil decreased. In spite of huge global oversupply, on 27 November 2014 in Vienna, Saudi Oil Minister Ali al-Naimi blocked the appeals from the poorer OPEC member states, such as Venezuela, Iran and Algeria, for production cuts. The European crude oil benchmark, Brent, plunged to US$71.25, a four-year low. Al-Naimi argued that the market would be left to correct itself, this will put pressure on companies in the US to reduce shale fracturing operations. OPEC had a "long-standing policy of defending prices". OPEC is ready to let the Brent oil price drop to $60 to slow down US shale oil production.[166] In spite of a troubled economy in member countries, al-Naimi repeated his statement on Saudi inaction on 10 December 2014.[167] By the end of 2014, as the demand for global oil consumption continued to decline, the remarkably rapid oil output growth in ‘light, tight’ oil production in the North Dakota Bakken, the Permian and Eagle Ford Basins in Texas, while rejuvenating economic growth in "U.S. refining, petrochemical and associated transportation industries, rail & pipelines, destabilized international oil markets."[168]
2015
On January 16, Brent crude rose as high as $50.16 before falling back, and the International Energy Agency said production was down due to lower prices and higher prices were likely late in 2015.[169] West Texas Intermediate, down 10 percent for the month, closed at $48.48 on January 14[170] after closing at $45.89 the previous day. Gas was $2.12.[171]
After the January 23 death of King Abdullah led to concerns about the future, West Texas Intermediate climbed as high as $47.76 and Brent crude reached $49.80.[172]
From January 30 to February 3, oil rose 20 percent, but on February 4, U.S. crude futures fell 8.7 percent to $48.45, the most in one day since November 28, 2014. Brent crude fell from $59 to $54 two weeks after reaching $45. U.S. inventories were the highest since 1982, while the dollar was recovering from "its worst day in more than a year".[173]
Although inventory remained high, Brent crude reached its highest price of 2015 on February 17, closing at $62.53 after reaching $63. Problems in the Middle East, especially Libya, contributed to the rise. Fighting in Ukraine was also a factor.[174]
At the end of February, with refineries changing to summer blend, the price of gas was $2.37,[175] up from $2.03 in January.[176] Other factors included an explosion at a Torrance, California refinery and a strike involving steel workers at 20 refineries.[175]
On March 13, oil declined 5 percent for a total drop of 10 percent for the week.[176] Benchmark crude reached $45.16[177] and Brent crude was $56.24.[178] Supplies continued to increase and the price was expected to fall until changes by refineries for summer. Gas reached $2.46 March 7 but fell to $2.44 a week later.[176] U.S. inventories were the highest since records had been kept, but on March 18, with the Federal Reserve indicating interest rates would not rise quickly, oil prices increased 6 percent.[179]
Brent crude rose 16 percent in April, reaching $64.95, its highest price for 2015, on April 16. U.S. crude was $56.62 on April 17. Reasons were a drop in expected shale oil production in the United States and the war in Yemen.[180] Gas was $2.41, up a penny in a week.[181]
On May 5, gas reached $2.63 after rising for 19 days; gas was going up faster than oil,[182] which reached its highest 2015 price, $61.10 for U.S. crude and $68.40 for Brent crude, before settling at $60.40 and $67.52 respectively. The dollar was lower but different sources conflicted over whether U.S. inventories were down for the first time in 2015, or up as they had been.[183]
West Texas Intermediate closed slightly higher at $58.98 on May 19, and Brent crude rose slightly to just over $65 as U.S. supplies, still near records, fell while refineries increased production.[184] On May 26, gas was $2.74.[185]
On June 10, West Texas Intermediate reached $61.43, the highest price since December. Demand was expected to stay high, but OPEC production was also staying high. Brent crude was $65.70[186][187] while gas was $2.76.[188]
On July 1, with an increase in U.S. inventory for the first time in two months, U.S. benchmark oil fell by the most in one day since April 8 to $56.26, the lowest since April 22, while Brent crude fell to $62.01.[189] Gas was $2.77.[190]
Oil fell by about $10 in July as the U.S. dollar was strong, supplies were high, and the Chinese stock market was down. Near the end of the month, Brent crude reached $53.31, close to the lowest in six months, while U.S. crude, at $48.52, was close to a four-month low,[191] and gas was $2.69.[192] A week later, with supplies high and summer driving in the United States ending, oil fell below $45, close to the six-year low reached in March.[193] Brent crude was below $50.[194] Gas was $2.64.[195]
On August 11, U.S. crude reached $43.08, its lowest price since February 2009. Brent crude was below $50.[196] Gas was $2.59.[197] On August 26, U.S. crude reached $38.60,[198] once again its lowest price since February 2009, before jumping more than 10 percent the next day to $42.56 for its biggest increase in one day since March 2009. Brent crude was up 10 percent to $47. U.S. supplies had fallen dramatically, especially in Cushing, Oklahoma.[199] Gas was $2.56, the lowest at this time of year since 2004, though refinery problems kept it from being lower.[200]
During August, Brent reached a low of $42.23 and U.S. crude was as low as $37.75.[201] Then U.S. crude jumped 28 percent in 3 days, the most since 1990. Brent crude also climbed 28 percent above $54, the highest in a month.[202]
On September 11, Goldman Sachs predicted continued surpluses and falling prices, and U.S. crude fell to $44.74 while Brent crude reached $47.93.[203] Gas was $2.37.[204]
A drop in supplies from Cushing, speculation about Federal Reserve action on interest rates, and U.S. help for Kurds in Syria contributed to a rise in U.S. crude to $47.15, while Brent was $50. [201]
On September 25, the price of gas was $2.29.[205] On September 29, with U.S. crude inventories up and Cushing supplies falling more slowly, West Texas Intermediate finished at $45.23, with Brent crude falling to $47.97.[206]
After an International Energy Agency prediction of high supplies for the next year, U.S. crude fell the most in a week in more than two months, ending October 15 below $47, and Brent crude had its biggest loss for a week in nearly two months, just under $50 on October 16.[207] With Middle Eastern countries producing more oil than needed and Iran expected to add even more as a result of the nuclear deal, as well as slow growth in China, U.S. crude fell below $46 on October 19 and Brent crude reached $48,51 early October 20.[208] Gas was $2.25.[209]
On November 4, prices fell over 3 percent as a result of higher U.S. inventories and U.S. output, before rising slightly, Brent crude recovering to $48.76 and West Texas Intermediate reaching $46.37.[210] Gas was $2.19, the lowest for the time of year since 2004.[211]
On November 19, U.S. crude fell below $40, and Brent crude slipped below $44.[212] Gas was $2.13.[213] Higher demand, winter weather in the United States and a promise by Saudi Arabia to work toward stabilizing prices sent West Texas Intermediate back over $42 and Brent crude over $44 on November 23.[214]
On the first week of December Brent crude fell to $42.43 and U.S. crude slipped below $40 after OPEC first said it would increase production and then decided not to make changes. Other factors were a weak dollar and a strong Euro.[215]
On December 11, oil fell to $35.62. The next day, gas was $2.02, the lowest in over six years.[216]
On December 21, Brent crude fell as low as $36.35 a barrel; this was the lowest price since July 2004.[217] U.S. crude rose slightly to $36.14.[218] Gas fell below $2 for the first time since 2009.[219]
On December 30 with U.S. supplies still high, light sweet crude fell to $36.60, while Brent crude reached $36.46. Oil ended the year down 30 percent.[220]
In early 2015, the US oil price fell below $50 per barrel dragging Brent oil to just below $50 as well.[221]
Steve Briese, a commodity analyst, who had forecasted in March 2014 a decline to world price to $75 from $100, based on 30 years of extra supply[222] in early December 2014 projected a low of $35 a barrel.[223] On Jan 8, 2015 commodity hedge fund manager Andrew J. Hall suggested that $40-a-barrel is close to “an absolute price floor,” adding that a significant amount of U.S. and Canadian production can’t cover the cash costs of operating at that price.[224]
In mid-January 2015, Goldman Sachs predicted the U.S. oil benchmark to average $40.50 a barrel and Brent to average $42 a barrel in the second quarter. For the year, Goldman sees Brent prices averaging $50.40 and for the U.S. benchmark, $47.15 a barrel in 2015, down from $73.75.[225]
According to Bloomberg Business, the efficiency of [226] newer shale oil wells that use hydraulic fracturing in the United States, combined with the US$12 million upfront well drilling and construction costs, provide incentives to oil producers to continue to flood the already glutted market with under-priced oil in spite of crude oil storage limitations.[226] Many less efficient and less productive older wells were shut down but these shale oil wells continue to increase production while making a profit in a market where crude oil is priced as low as US$50 a barrel.[226]
In 16 April the price of WTI hit a high of $56.52 for 2015 following the publication of the monthly review by the Organization of the Petroleum Exporting Countries in which it was reported that oil production in the United States had peaked and would start to decline in the third quarter thereby easing the global glut of crude.[227]
From 6–7 December the price of WTI crude fell about five percent, closing under $40 for the second time in the year, due to OPEC refusing to scale back production. This met with negative reactions in the stock market, causing the DJIA and the S&P 500 procuring a net negative run for 2015.
In late 2015, an Organization of Petroleum Exporting Countries (OPEC) member Venezuela's Oil Minister Eulogio del Pino and a Goldman Sachs analyst Michele Della Vigna suggested that oil may go as low as $20-per-barrel mark, although with a 15% probability, and that it would only be temporary.[228][229] Lord Browne, the former chief executive of BP, did not rule out the possibility when asked if oil could hit $20 a barrel. He added: “In the long run, $20 is probably wrong, but that’s as far as I’d go.”[230]
On December 11, the price of WTI crude hit a seven-year low, settling around $35 for the day. Once again various stocks slid as this unfolded, erasing the previous day's rally.
On December 21, the price of WTI crude hit an eleven-year low, as it dropped below $34 a barrel for the first time since 2009.[231]
2016
On January 6, 2016, the price of WTI crude hit another eleven-year low, as it dropped to 32.53 a barrel for the first time since 2009.[232] On January 12, in its seventh losing day, crude oil dropped below $30 for the first time since December 2003, ending the day at $30.44, as gas fell below $1.97.[233] Brent crude hit $27.10 on January 20, the lowest since November 2003.[234] Oil rose again before falling January 25, Brent crude reaching $30.86 and U.S. oil $30.68.[235] After OPEC encouraged production cuts and U.S. GDP data suggested fewer interest rate increases, U.S. oil had four days of gains to finish January at $33.62. Brent was $34.74.[234] Gas was $1.81, the lowest since January 2009.[236] A February 7 meeting between Ali al-Naimi of Saudi Arabia and Eulogio Del Pino of Venezuela failed to produce desired results, and oil fell the next day, with Brent crude at $33.53 by noon and U.S. crude at $30.27.[237]
On February 11, U.S. crude reached $26.21 after reaching $26.05, its lowest price since May 2003. The next day oil rose 12.3 percent to $29.44, the most in one day since February 2009. Investors wanted to be ready when the price started going up. Also, OPEC was "ready to cooperate" on lower production.[238][239]
On February 22, Benchmark U.S. crude rose 6.2 percent to $31.48 and Brent crude went up 5.1 percent to $34.69 after news that supplies were expected to grow more slowly.[240] By the end of the week, WTI was up 3 percent to $32.78, and Brent was up 7 percent to $35.12 after rising as high as $37, the most since January 5. Pipeline outages in Nigeria and Iraq, a lower number of active U.S. rigs, and lower gasoline inventories for the first time since November were reasons.[241] Gas was $1.73, down 10 cents from the previous month, but with the switch to summer blend in California, gas was $2.34 and on its way back up.[242]
After inventories fell faster than expected, U.S. crude was $37.94 on March 9, while Brent crude was up again to $40.84 after six straight up days and its highest level in three months the previous day then a 3 percent drop due to concerns about too much oil. Prices were up 25 percent after major oil producers said they would keep supplies at January levels.[243]
After reducing the number of rigs for 12 weeks, U.S. producers added one rig with oil up 50 percent. With gasoline demand up, Brent crude reached its highest level of the year at $42.54 before falling to $41.20 March 18 in its fourth straight week of gains. U.S. crude also reached a high at $41.20 before falling to $39.44, ending its fifth straight week higher.[244] Gas was $2.02, up 17 cents in 2 weeks.[245]
On March 31, U.S. crude reached $37.57, the lowest since March 31, as the country's supply hit a record for the seventh week. Brent crude was $38.81.[246]
In the first week of April with a weak dollar, oil jumped 7 percent, with Benchmark crude reaching $39.72 and Brent at $41.94.[247] The next Tuesday, Brent hit $43.58, the highest of the year.[248]
With a planned meeting of oil producers to discuss keeping output where it was, on April 15 oil fell over 3 percent, with U.S. crude reaching $40.33 by midday and Brent at $42.82.[249]
With high demand in the U.S., lower production worldwide and problems in oil fields, oil rose for the third straight week, with Brent crude rising 4.5 percent for the week to $45.11 and West Texas Intermediate up more than 8 percent at $43.73.[250]
On April 26, U.S. inventories were down after analysts had expected a supply increase, and the dollar was weak. U.S. crude was up 3 percent to $44.04 while Brent crude was up to $45.74.[251]
The fire in Canada, attacks in Nigeria, and economic problems and the Zika virus in Venezuela led to supply problems and the highest prices in seven months on May 16.[252] With U.S. supplies down more than predicted, WTI reached $49.56 on May 25, the highest since October. Brent crude was $49.74.[253]
On June 7, with the dollar lower and interest rates not expected to rise after U.S. economic news, Benchmark crude closed over $50 for the first time since July 21. Brent crude was $51.44.[254]
With the June 23 United Kingdom vote to leave the European Union, U.S. oil fell $2.05 to $48.06 and Brent crude fell $2.13 to $48.78.[255]
Gas was $2.29 on June 30, the lowest for the July 4 holiday in 13 years.[256]
On July 7, although supplies were down, they were not as low as forecast, and U.S. crude reached $47.20, down 4.7 percent. Brent crude reached $46.27, the lowest since May 11.[257]
For the week ending July 15, crude supplies fell, but gasoline supplies rose. After gains on July 20, WTI fell to $44.75 and Brent crude went down to $46.20.[258] Gas was $2.19, the lowest since 2004 at that time of year.[259]
On August 5, WTI fell to $41.52 as the dollar rose as a result of better U.S. job news than expected, while Brent crude fell to $43.95. Oil prices had fallen more than 20 percent since June and were rising earlier in the week.[260] On the week ending August 12, Benchmark crude rose 6.4 percent, and it went over $45 on August 15. Brent crude was $47.59.[261] Gas was $2.12.[262]
On August 31, U.S. government data showed a higher than expected increase in oil supplies, and the prediction that supplies would stay high. If the Fed raised interest rates, a higher dollar and lower oil prices would result. U.S. crude fell to $43.16 on September 1, its lowest level in 3 weeks. Brent reached $45.52. Oil had gone up 11 percent for the month with the expectation that OPEC would limit production.[263]
Colonial Pipeline lost a major pipeline September 9 after a leak. As of September 19, the national average was up 2 cents to $2.20, though some areas, especially in the Southeast, saw increases of 20 to 30 cents.[264] The pipeline returned to service after completion of a bypass on September 21.[265]
On September 23, Brent crude fell slightly to $45.89 in anticipation of a September 26 OPEC meeting.[266] On September 29, WTI rose to $47.83 and Brent crude hit $49.24 after OPEC's decision to decrease production resulted in the biggest gains since April.[267]
Oil ended September higher for the second month. With the dollar strong after improvement in the U.S. economy, and stock markets weak, West Texas Intermediate fell October 3 after reaching $48.87, the highest point since July 5. Brent crude fell after hitting $50.90, its highest in six weeks.[268]
On October 10, with Russia planning to join OPEC and Algeria saying others should, Brent crude reached its highest point in a year at $53.73, while WTI hit $51.60, the highest since June 9.[269] A week later, with supplies high and added U.S. production capacity, WTI fell just below $50 and Brent crude ended the day at $51.16.[270] With lower inventories, on October 19 WTI reached $51.93, the highest since July 2015, while Brent crude reached $53.14.[271]
After an October 29 meeting by both OPEC members and nonmembers on the agreement to limit output resulted only in an agreement to meet again on November 30, and with high inventories at Cushing, Brent crude reached $48.17, the lowest since September 29, and WTI was down to $46.86, its lowest since September 27.[272]
A strong dollar and higher than expected U.S. and world supplies led to an end to rising prices on November 17, with U.S. crude reaching $45.52 and Brent crude $46.26.[273] Then oil reached its highest point in 3 weeks on November 21, with Brent crude up 11 percent in a week, reaching $49, after Saudi Arabia began attempting to persuade other OPEC countries to participate in its plan, while WTI reached $47.80. OPEC countries met November 30 and agreed to limit output for the first time since 2008. As a result, Brent crude went over $50, the highest in a month, while West Texas intermediate stopped just short of $50.[274][275]
Brent reached $57.89 and U.S. crude reached $54.51 on December 12, both the highest since July 2015, after Russia and other countries not part of OPEC also agreed to limit production.[276] For the week ending December 16, U.S. oil supplies, expected to fall, actually rose. WTI fell to $52.49 and Brent crude ended December 21 at $54.46.[277]
On December 27, the first day of trading after Christmas, with the output reduction to start January 1, Brent crude hit $56.09 and U.S. crude CLc1 reached $53.90.[278] With a continued increase in U.S. supplies and nine weeks of increases in oil rigs, oil fell slightly at the end of the week, with WTI ending the year at $53.72 for a 45 percent gain, and Brent at $56.82, up 52 percent. Both gains were the most since 2009.[279][280]
2017
Despite the promises of lower output from other countries, no evidence of changes was seen. U.S. output was higher. Also, China's economic problems caused concern. Brent crude fell 3 percent in the second week of the year to $55.45. WTI fell to $52.37 for a nearly 3 percent loss.[281] On January 18, with a strong dollar and expectations of higher U.S. production, Brent crude fell to $53.92 and WTI to $51.08.[282] With U.S. production and inventories up, even a lower dollar and decreased production by OPEC nations did not cause oil prices to rise as much as they could have. WTI reached $53.07 and Brent crude $55.44 on January 26.[283][284]
On February 8, the U.S. Energy Information Administration reported the second-largest increase in oil supplies, the day after WTI reached $52.17 and Brent reached $55.05, the lowest in three weeks for both, thanks to a strong dollar. Still, prices moved higher on February 8.[285][286] With the increase in U.S. supplies and OPEC's plan to keep cutting production, oil ended the next week down, with WTI at $53.40 and Brent crude at $55.81.[287]
On February 22, Qatar oil minister Mohammed Saleh Al Sada said countries not in OPEC were not cutting production as much as expected, and oil fell as a result.[288] Continued increases in U.S. crude inventories also contributed to a decline, with WTI at $53.59 and Brent at $55.76.[289]
After U.S. inventories reached a record at the end of February, oil fell for three straight days and closed at its lowest level in nearly a month, with WTI at $52.61 and Brent at $55.08.[290] Oil continued to fall, with Brent crude reaching $51.50, the lowest since November 30, on March 9, a day after a 5 percent drop, the most it had moved in a day all year. WTI fell more than 5 percent March 8 and closed at $49.28 the next day, the lowest since November.[291] WTI fell to $47.36 on March 14, while Brent crude reached $50.25, before lower inventories resulted in higher prices. [292][293] Crude inventories set a record but gasoline inventories went down more than expected and summer gasoline demand was expected to increase, so while WTI fell to just over $47 on March 22, it finished the day at $48.04. Brent crude fell below $50 but recovered to $50.64.[294] On March 30 with Kuwait's support for continuing OPEC production cuts, U.S. crude rose above $50 for the first time in three weeks, with Brent crude reached $52.92.[295] Despite high U.S. crude inventories while gasoline inventories moved lower, prices continued to rise, reaching their highest point since March 8 on April 6, with WTI reaching $51.70 and Brent crude $54.89.[296] After Saudi Arabia announced plans to continue lower production beyond the first half of 2017, on April 12, WTI reached $53.36 and Brent crude reached $56.40.[297] On April 14, gas was $2.41, up 33 cents from a year earlier.[298]
On April 19, oil fell 3.8 percent with the news of an unexpected increase in U.S. gasoline supplies and the news that U.S. crude supplies fell less than they should have with production at its highest since August 2015.[299] WTI still remained above $50 while Brent crude closed just under $53.[300] On April 24, WTI fell below $50 and Brent crude closed at $51.60 due to doubts about OPEC extending production cuts and a statement by Russia that it would increase production.[301]
Despite plans to extend production cuts, on May 4, oil fell to its lowest level since November, with WTI falling to $45.52 and Brent crude reaching $48.26.[302] But with the news that Saudi supplies to Asia were less than expected, and with U.S. inventories down the most since December, and despite higher production from non-OPEC nations reducing demand for OPEC oil, Brent crude finished at $50.72 on May 11 and U.S. light crude rose more than 1 percent to $47.83.[303]
With expectations production cuts would continue, Brent crude was up for the second week and WTI finished May 18 at $49.35, its highest close since April 26.[304] On May 25, all countries agreed to continue cuts but Brent crude still fell 4 percent.[305] And despite a sharp drop in U.S. inventories, oil fell another 1 percent on June 2, with Brent crude reaching $50.25 and WTI down to $47.91.[306]
By June 9, Brent crude was at $47.67, down 12 percent from May 25, and WTI was at $45.44, down 11 percent, with limits on production not having the expected effect as supplies continued to rise.[307] OPEC actually increased production and on June 14, Brent crude fell to $48.25 and WTI to $45.94.[308] Excessive worldwide supplies and high U.S. production led to the fourth straight down week as Brent crude finished June 16 at $47.37 and WTI rose to $44.74, a day after oil reached its lowest level in six months. Prices rose slightly with news that although American producers added rigs for a record 22 weeks, the rate of increase was slowing, and that some countries were starting to export less.[309]
With production increasing in Nigeria and Libya, even though U.S. supplies of oil and gasoline were down, Brent crude rose slightly to $44.91 after reaching its lowest point since November, and WTI reached $42.53, its lowest since August, on June 21.[310] With U.S. inventories again continuing to increase and gasoline supplies up despite increased demand, Brent crude fell to $46.32 and WTI reached $43.86 on June 28.[311]
After eight days of gains due to an expected end in a rise in U.S. production, Brent crude fell to $49.43 and WTI to $46.85 on July 4.[312] On July 7, even though U.S. oil and gasoline inventories fell late in June, with both OPEC and U.S. production up, Brent crude fell to $47.53 and WTI to $44.95.[313] The next week, Brent crude rose 3.5 percent to $48.24 and WTI 4 percent to $45.98 as U.S. inventories continued to fall and U.S. production forecasts were cut, though oil inventories were still high, reducing gains from earlier in the week; Sanford C. Bernstein speculated OPEC nations may not have made the cuts intended.[314][315] On July 31, Brent crude reached $52.93, its highest point since May.[316] With record demand reported in the United States and lower inventories along with good news on U.S. jobs but continued high production from OPEC nations, on August 4, WTI ended the week at $49.58 and Brent crude reached $52.42 after almost reaching a 10-week high earlier in the week. Both were down less than 1 percent for the week.[317][318]
Oil reached its highest level in two and a half months on August 9 but OPEC and exempt nations Nigeria and Libya reported increased output, and oil fell 1.5 percent, with WTI back below $50 at $48.62 and Brent crude at $51.91 early the next day.[319]
Oil fell 2.5 percent, more than expected, on August 14. Early the next day WTI was $47.65 and Brent crude was $50.79, both up slightly. Lower production by Libya and China were reported, and a stronger dollar resulted from North Korea delaying a decision to fire a missile toward Guam.[320]
On August 23, oil fell slightly due to higher Libya output, while U.S. gasoline supplies higher than expected even though crude inventories fell, with WTI at $47.63 and Brent crude at $51.61.[321] However, Hurricane Harvey led to higher gas prices[322] and to a reduction of nearly 25 percent in refinery capacity and 15 percent in U.S. production. Brent crude fell slightly to $50.93 on August 29, but the difference between Brent and U.S. CLc1 reached the highest level in over two years before declining to $4.92.[323] While Harvey has had little effect on crude prices,[324] the price of gas reached $2.59 on September 2, up 17.5 cents since August 23 and 16.7 percent higher than 2016,[325] with more dramatic increases in states dependent on the Colonial Pipeline, which closed until inspection was complete.[326] As of September 11, the price of gas was $2.67.[327]
Brent crude rose 40 percent from June to October as oil producers were expected to continue lower production, with an increase of 20 percent in the third quarter, the most for the quarter since 2004, and reaching $59.49 during the final week of September. The increase that week resulted from a threat by Turkey to close a pipeline as a result of the Kurdistan vote for independence. Turkey did not act and oil fell 6 percent to $56.00 (including a 2.5 percent drop on October 1) as a result of investors taking advantage of higher prices and forecasts for increased U.S. shale oil production. U.S. CLc1 fell only slightly to $50.42.[328]
On October 12, with U.S. supplies up, WTI was $51.01 and Brent crude $56.65.[329] After four days of higher prices, oil dropped significantly October 19 and rose slightly the next day, with WTI reaching $51.41 and Brent at $57.31. U.S. oil inventories were down 15 percent since March and lower than in 2016 due to higher exports resulting from WTI being significantly lower than Brent. However, threats to oil supplies due to fighting in Kurdistan were less than feared.[330]
On November 1, WTI reached the highest level since 2015 before settling at $54.30.[331] The next week, WTI reached $57.92, highest since July 2015, and Brent crude $64.65, highest since June 2015. Demand was high, and OPEC cuts and "rising political tensions" were other reasons.[332]
On November 24, WTI reached $59.05, the highest in two years, due to the Keystone Pipeline closing, and optimism about the OPEC deal extension.[333] On November 27, U.S. CLc1 fell 1.4 percent, finishing the next day at $57.99, with Brent crude at $63.61. Crude supplies had risen the previous week after forecasts for an increase. There was concern about a November 30 meeting to extend OPEC production cuts, while Russia was expected to increase production.[334]
A strong dollar caused prices to fall slightly December 8, with WTI at $56.64 and Brent crude at $62.09.[335] With an outage on the Forties crude pipeline in Great Britain, prices were staying high.[336] Oil fell slightly on December 11 with WTI at $57.10 and Brent crude $63.08 as U.S. production reached levels not seen since the 1970s and the number of rigs continued to increase.[337]
During the last week of 2017, WTI went over $60 for the first time since June 2015 before falling back to $59.69, while Brent crude passed $67 for the first time since May 2015 before falling to $66.50. Pipeline problems in Libya and the North Sea added to production cuts by OPEC and Russia.[338]
2018
Both WTI and Brent crude began the year above $60 for the first time since 2014.[339] Later in the week WTI reached $62.21 and Brent crude $68.27, both the highest since May 2015. Protests in Iran added to other factors that were keeping prices high.[340] With U.S. inventories the lowest in three years, and cold weather decreasing U.S. production, oil reached its highest price since December 2014 in mid-January. On January 15, Brent crude reached $70.37, and the next day, WTI hit $64.89. U.S. production increased and demand was predicted to go down when winter was over, so prices went down.[341] With U.S. crude supplies up for the first time in 11 weeks, WTI ended January at $64.73 after falling for two straight days for the second time in the month. [342]
In February, with U.S. crude supplies up, WTI fell to $61.79, the lowest level in a month, and Brent crude fell below $66 for the first time in 2018.[343]
With both crude oil stocks and gasoline inventories up, and U.S. production at a high, WTI finished February down 4.8 percent, the first loss for a month since August, and Brent crude finished down 4.7 percent.[344] With reports of higher U.S. crude inventories, a stronger dollar and the stock market down (partly the result of the resignation of Gary Cohn), oil fell 2 percent March 7, with WTI reaching $61.21 and Brent crude $64.34.[345] Crude oil supplies continued to rise and oil fell 1.2 percent early in the week of March 12, with WTI reaching $61.14 and Brent crude reaching $64.97 early March 15.[346] Then crude supplies fell and WTI ended March 21 at $65.41 while Brent reached $69.47, both the highest since early February.[347] WTI ended March at $64.94, up 5.6 percent for the month and 7.7 percent for the first quarter. Brent finished at $70.27 for an increase of 8.6 percent for the month and 6.3 percent for the quarter. One reason was concern over the United States putting sanctions on Iran once again. Also, OPEC wanted prices higher and intended to set targets for crude stocks accordingly. Production in Venezuela was down as well.[348]
On April 11, with the United States planning a response to the Douma chemical attack in the Syrian Civil War, WTI ended the day at $66.82, with Brent at $72.04, both the highest since December 2014.[349]
WTI fell from $69.56 and Brent from $74.74, both the highest since November 2014, on a week when U.S. inventories were lower and gasoline demand was higher.[350]
WTI ended May 18 down slightly at $71.28 but still higher for the third week after reaching its highest level in three and half years twice. Brent rose for the sixth week in a row, the most since 2011, finishing at $78.51 after going over $80 for the first time since November 2014 the previous day. The threat of more sanctions on Iran, the lowest OPEC petroleum stocks in three years, and supply problems in Venezuela were reasons.[351]
Prior to Memorial Day, the number of active U.S. oil rigs increased and WTI fell 4 percent to $67.88, while Brent crude fell 3 percent to $76.44, the lowest since May 8. Media reports indicate OPEC will increase production.[352] Gas was $2.97,[353] the highest of the year.[354]
With OPEC's announcement that it would keep production low through the rest of 2018, WTI rose from its lowest close since April 17 to finish May 30 at $68.21 after five straight days of decline, the longest streak since February. Brent finished at $77.50. The difference between WTI and Brent was increasing, possibly due to shale oil.[355]
On June 14, WTI reached $66.89, its highest settlement in two weeks as a result of the largest U.S. supply drop since March, though not as high as it could have been due to record U.S. production for the week. Brent crude fell to $75.94 due to expectations of higher production from OPEC.[356]
On June 22, WTI finished at $68.58, up 4.6 percent, and Brent crude was up 3.4 percent to $75.55, after OPEC said it would cut production, and U.S. supplies fell with the first reduction in the number of rigs in three months.[357]
WTI ended the first half of 2018 up about 23 percent to $74.15, the highest since November 2014, up 14 percent for the second quarter and 11 percent for the month. Brent crude was $79.44, the highest since May. Factors included threats to supplies from Libya and proposed sanctions on countries importing oil from Iran.[358] With expectations of increased production worldwide, Brent crude dropped more than 2 percent on July 2 to $77.30, while WTI fell slightly to $73.94 due to lower U.S. supplies and Libya exports.[359] For the week ending July 13, WTI fell 3.8 percent to $71.01 after falling below $70 on July 12. Brent crude fell 2.3 percent to $75.33 after reaching $73.40 on July 11, a day when the return of oil from Libya and a change in attitudes toward Iran sanctions led to a nearly 7 percent drop. Lower U.S. supplies were less of a factor.[360]
WTI rose to $69.46 on July 19 with the announcement that Saudi Arabia exports were expected to fall to prevent oversupply and news of lower than expected U.S. gasoline supplies, but Brent crude fell to $72.58 with the end of a strike by Norwegian oil workers.[361]
The biggest one-day decline in oil prices in three weeks happened August 8 as crude supplies fell less than expected and demand in China also fell. WTI fell 3.2 percent from $69.17, the highest since July 30, to $66.91, the lowest since June 21. Brent crude also fell by 3.2 percent, to $72.28, the lowest since July 17.[362] WTI fell 3 percent on August 15 to $65.01 for its lowest close since June 6, while Brent crude fell 2.4 percent to $70.76, the lowest since April 9. Crude inventories were rising despite a forecast they would fall.[363] Then oil rose for five straight days, with WTI reaching $67.86, the highest in two weeks, and Brent crude reached $74.78, the highest since July 30, as U.S. crude supplies fell more than expected. Possible sanctions on Iran have also contributed.[364] On August 28, WTI fell slightly to $68.53 from its highest finish since August 7; there had been increases seven of the previous nine days. Brent crude was also down a few cents to $75.95 after the highest finish since July 10. sanctions on Iran and problems in Libya and Venezuela kept prices high.[365] Gas was $2.24.[354]
Despite lower U.S. crude supplies, a number of factors including lower expected demand, problems between the U.S. and China, higher U.S. gasoline and distillate supplies, and economic problems in emerging markets contributed to the lowest finish since August 21 for WTI at $67.77 on September 6. Brent crude was $76.55.[366] With Hurricane Florence weakening, higher OPEC output and record supplies worldwide, on September 13, WTI fell 2.5 percent from $70.37, the highest since July 20, while Brent crude fell 2 percent to $78.17 from the highest since May.[367]
WTI rose nearly 3 percent October 1 to finish at $75.30, the highest since November 2014, while Brent crude reached $84.98, the most since October 2014, with the agreement to replace NAFTA and lower Iranian production given as reasons. WTI finished the third quarter down 1.2 percent but rose 3.5 percent in its last week, while Brent crude was up 4.1 percent for the quarter and 5 percent for the week.[368] With OPEC production up, on October 4, WTI fell by the largest percentage in a day since August but still ended higher for the fourth week in a row, at $74.90. Brent crude was $84.72 after falling 2 percent.[369] WTI finished at $71.34, down 4 percent for the week ending October 12, because of higher output and concerns about an economic slowdown. Brent crude was $80.34.[370]
References
- ↑ "Oil reaches new record above $99". BBC. November 21, 2007. Retrieved 2007-11-29.
- ↑ "Oil prices pushed to fresh high". BBC News. 2008-02-29. Retrieved 2009-12-31.
- ↑ David Goldman (March 12, 2008). "Oil crosses record $110, despite supply rise". CNN Money. Retrieved 2008-03-12.
- ↑ John Wilen (March 10, 2008). "Gas Prices Near Records, Following Oil". Associated Press. Archived from the original on 2008-03-13. Retrieved 2008-03-10.
- ↑ "Oil sets fresh record above $109". BBC News. March 11, 2008. Retrieved 2008-03-11.
- ↑ "Oil Is Little Changed After Falling as Investors Sell Contracts". Bloomberg.com. June 27, 2008.
- ↑ "Oil Rises to Record Above $141 as Investors Buy Commodities". Bloomberg.com. June 27, 2008.
- ↑ "Oil hits new high on Iran fears". BBC.com. 2008-07-11. Retrieved 2009-12-31.
- ↑ Oil spikes $25 a barrel on anxiety over US bailout
- 1 2 Rooney, Ben (November 7, 2008). "Oil holds slim gains". CNN. Retrieved April 21, 2010.
- ↑ Global 500, Fortune website, accessed August 2008.
- ↑ Oil prices in 2003 averaged highest in 20 years, USA Today
- ↑ Iraq: Oil and Economy
- ↑ Collier, Robert (2005-03-20). "Iraq invasion may be remembered as the start of the age of oil scarcity". San Francisco Chronicle. Retrieved 2008-03-20.
- 1 2 Simmons, Matthew (2007-11-16). "Another Nail in the Coffin of the Case Against Peak Oil" (PDF). Archived from the original (PDF) on 2008-04-11. Retrieved 2008-04-05.
- ↑ Youssef M. Ibrahim (2004-05-10). "The world has lost Iraq's oil". USA Today. Retrieved 2008-03-20.
- ↑ "James Murray, David King: Oil's tipping point has passed, Nature, Vol 481, 2012, p. 433-435" (PDF). Retrieved 2015-03-08.
- ↑ "Weekly U.S. Retail Gasoline Prices, Regular Grade". Retrieved 2006-09-26.
- ↑ "Free UK Petrol Prices". Retrieved 2007-11-29.
- ↑ Krane, Jim (2006-04-28). "Iraq Oil Output Lowest Since Invasion". Washington Post. Retrieved 2008-03-20.
- ↑ "My Stocks & Funds". CNN. Retrieved April 21, 2010.
- ↑ Oil demand falls in developed world for first time in 20 years
- ↑ Oil prices touch above $90 level, BBC News
- ↑ Supply fears push oil above $92
- ↑ Single trader behind oil record – http://news.bbc.co.uk/1/hi/business/7169543.stm
- ↑ Shenk, Mark (January 4, 2008). "Oil Falls More Than $1 as U.S. Jobs Data Signal Lower Fuel Use". Bloomberg L.P.
- ↑ "OPEC accuses U.S. on oil prices". CNN. March 5, 2008. Archived from the original on May 26, 2008.
- ↑ "Oil Rises Above $110 to Record as the Dollar Falls Against Euro". Bloomberg. March 12, 2008.
- ↑ BBC News: Oil prices continue upward march
- ↑ "Oil nears $120". CNN Money. April 22, 2008. Archived from the original on April 23, 2008. Retrieved 2008-04-22.
- ↑ Oil jumps over $3 after report on U.S. shot toward Iran boat
- ↑ Oil Prices Take a Nerve-Rattling Jump Past $138, New York Times, June 7, 2008
- ↑ Iran: World oil market saturated
- ↑ Oil output increase will not affect price
- ↑ Asia says no to extra Saudi crude
- ↑ Oil prices hit new peak above US$145
- ↑ bloomberg.com, Crude Oil Rises to Record Above $144 After U.S. Stockpile Drop
- ↑ uk.reuters.com, Oil hits new peak
- ↑ ap.google.com, Oil prices near $146 Archived August 1, 2008, at the Wayback Machine.
- ↑ washingtontimes.com, Oil prices near $146
- ↑ "Bush lifts executive ban on offshore oil drilling". CNN. July 14, 2008.
- ↑ The Age, Oil sags to 6-week low as war worries ebb
- ↑
- ↑ http://www.marketwatch.com/news/story/oil-futures-tumble-5-trade/story.aspx?guid={4EADE8D4-45B2-4C67-829F-5A6C71B52F17}
- ↑ Crude Oil Drops Below $92 as Lehman Adds to Demand Concern
- ↑ Rooney, Ben (October 6, 2008). "Oil tumbles to 8-month low below $88". CNN. Retrieved April 21, 2010.
- ↑ "Crude oil prices skid despite OPEC output cut". Archived from the original on 2008-10-27.
- ↑ "Oil price rises on Gaza conflict". BBC. November 5, 2009. Retrieved 2011-03-12.
- ↑ "Oil languishes near $35 on weak US economy". Associated Press. January 16, 2009. Retrieved 2011-03-12.
- ↑ Joseph Lazzaro (May 21, 2010). "Gas Prices Headed Lower as Summer Driving Season Heats Up". Daily Finance.
- ↑ Andrew Maykuth (May 27, 2010). "Summer shocker: Gasoline prices going down". Philadelphia Inquirer.
- ↑ Riley, Charles (December 23, 2010). "Gas prices top $3 a gallon". CNN. Retrieved December 23, 2010.
- ↑ Rooney, Ben (February 24, 2011). "Oil prices spike to $103, then drop back". CNN. Retrieved February 24, 2011.
- ↑ Clifford Krauss and Christine Hauser (February 22, 2011). "Oil Soars as Libyan Furor Shakes Markets". The New York Times.
- ↑ Clifford Krauss and Jad Mouawad (March 1, 2011). "Uncertainty Drives Up Oil Prices". The New York Times.
- ↑ Jad Mouawad and Nick Bunkley (March 8, 2011). "U.S. Economy Is Better Prepared for Rising Gas Costs". The New York Times.
- ↑ "Oil settles above $112 as dollar falls". Washington Times. Retrieved April 20, 2016.
- ↑ "Gasoline rises to $3.87 per gallon". Yahoo!. Retrieved April 26, 2011.
- ↑ Chris Kahn (May 6, 2011). "Oil drops below $100 per barrel". The Sun News. Associated Press.
- ↑ Margot Habiby (May 2, 2011). "Oil Jumps to 31-Month High on Concern About Al-Qaeda Reprisals". Bloomberg Businessweek.
- ↑ Jonathan Fahey and Chris Kahn (May 7, 2011). "Gas price to drop as oil joins plunge". The Sun News. Associated Press.
- ↑ Blake Ellis (May 6, 2011). "Oil settles down 2.6%". CNNMoney.
- ↑ Chris Kahn (June 18, 2011). "Oil falls 2 percent, to $93 a barrel". The Sun News. Associated Press.
- ↑ "Price of gas drops 11 cents in the last two weeks". MSNBC. June 26, 2011.
- ↑ Steve Hargreaves (June 30, 2011). "Oil prices rising a week after SPR release". CNNMoney.
- ↑ "Oil wavers below $91 on Greece debt". The Charleston Gazette. Associated Press. June 29, 2011.
- ↑ Sandy Shore (July 7, 2011). "Oil and gasoline prices on the rise again". Yahoo Finance. Associated Press.
- ↑ Agustino Fontevecchia (July 8, 2011). "Oil Prices: Brent-WTI Spread Above $22 And Here To Stay". Forbes.
- ↑ Chris Kahn (August 6, 2011). "Gas prices expected to fall". The Sun News. Associated Press.
- ↑ Robert Dominguez (August 9, 2011). "Gas prices fall to lowest price all year after stock values plummet". New York Daily News.
- ↑ Jonathan Fahey (September 26, 2011). "Gas prices dip". The Sun News. Associated Press.
- ↑ Chris Kahn (November 9, 2011). "Oil soars, but don't worry yet at the pump". The News & Observer. Associated Press.
- ↑ "Retail gasoline prices stay high on concerns about the Middle East and Europe". Washington Post. Associated Press. January 20, 2012.
- ↑ "Iran: EU oil sanctions 'unfair' and 'doomed to fail'". BBC News. January 23, 2012.
- ↑ "AAA reports Oklahoma gas prices rising". Bloomberg Businessweek. February 1, 2012.
- ↑ Gary Strauss (February 6, 2012). "Gas prices to jump". USA Today.
- ↑ Pablo Gorondi (February 20, 2012). "Oil jumps to 9-month high after Iran cuts supply". The Sun News. Associated Press.
- ↑ Chris Kahn (February 20, 2012). "Gas prices are highest ever for this time of year". News & Record. Associated Press.
- ↑ Matthew Craft and Christopher S. Rugaber (February 29, 2012). "Will higher gas prices derail the economy?". The Sun News. Associated Press.
- ↑ Zunaira Zaki (April 2, 2012). "Highest Weekly Gas Price For April". ABC News.
- ↑ Zunaira Zaki (April 9, 2012). "Gas Price Average $3.94; Stocks Close Lower". ABC News.
- ↑ Zunaira Zaki (April 16, 2012). "Gas Prices Down to $3.92". ABC News.
- ↑ Chris Kahn and Sandy Shore (April 20, 2012). "Gas prices actually start falling around the US". MSNBC. Associated Press.
- 1 2 Chris Kahn (April 24, 2012). "US gasoline prices now cheaper than a year ago". Yahoo News. Associated Press.
- ↑ "2012 West Texas Intermediate Crude Oil (WTI) Prices". Union Pacific. Retrieved 2012-04-26.
- ↑ Robert Gibbons (April 17, 2012). "UPDATE 9-US crude jumps, Brent lags, spread narrows". Reuters.
- ↑ Chris Kahn (May 7, 2012). "Oil price plunges to lowest point of 2012". The Sun News. Associated Press.
- ↑ Sandy Shore (June 5, 2012). "Oil price rises again as investors track Europe". MSNBC.
- ↑ Chris Kahn (June 29, 2012). "Oil soars as Europe moves to bolster banks". Boston Globe. Associated Press.
- ↑ Chris Kahn (July 17, 2012). "Oil price rises on housing outlook". Beaumont Enterprise. Associated Press.
- ↑ Steve Hargreaves (August 7, 2012). "Gas prices climb 30 cents a gallon". CNNMoney.
- ↑ Samantha Bomkamp (August 7, 2012). "Oil rises; U.S. considers release from reserves". The Sun News. Associated Press.
- ↑ Jonathan Fahey (September 4, 2012). "Oil slides on economic concerns". Boston Globe. Associated Press.
- ↑ Jonathan Fahey (September 4, 2012). "U.S. gas prices at highest ever for Labor Day weekend". Fox News. Associated Press.
- ↑ Chris Isidore (September 12, 2012). "Gas spike hits drivers". CNNMoney.
- ↑ "Oil climbs above $99; gasoline at avg. $3.86". St. Louis Post-Dispatch. Associated Press. September 17, 2012.
- ↑ "Oil rises after Fed takes steps to boost economy". U.S. News & World Report. Associated Press. September 13, 2012.
- ↑ Jason Dearen (October 4, 2012). "Calif gas prices spike 8 cents a gallon overnight". Seattle Post-Intelligencer. Associated Press.
- ↑ Steve Everly and The Associated Press (October 26, 2012). "Gasoline prices dive toward $3 a gallon". The Kansas City Star.
- ↑ "Gas prices plunge, partly due to Sandy". NBC News. Reuters. November 2, 2015.
- ↑ Jerry A. Dicolo (November 7, 2012). "Oil Prices Slump". Wall Street Journal.
- ↑ Pablo Gorondi (November 27, 2012). "Oil prices up on brisk US retail sales, Greek deal". WCBD. Associated Press.
- ↑ Pablo Gorondi (November 27, 2012). "'Fiscal cliff' worries pressure oil prices". The Kansas City Star. Associated Press.
- ↑ Pablo Gorondi (December 13, 2012). "Oil slips on US talks impasse, weak demand outlook". Miami Herald. Associated Press.
- ↑ "Oil rises on new hope of 'fiscal cliff' resolution; pump prices hit $3.25 a gallon, 2012 low". The Washington Post. Associated Press. December 17, 2012. Archived from the original on December 18, 2012.
- ↑ "Oil Prices Lifted by Progress on Fiscal Cliff Talks". Fox Business. Dow Jones Newswires. December 17, 2012.
- ↑ "Oil prices rise above $95 on strong US housing data and encouraging signs for job market". The Washington Post. Associated Press. January 17, 2013.
- ↑ Jonathan Fahey (February 21, 2013). "Oil prices down sharply for a 2nd day". News & Observer. Associated Press.
- ↑ Pablo Gorondi (February 22, 2013). "Oil levels off after 2 days of steep losses". News & Observer. Associated Press.
- ↑ Pablo Gorondi (February 25, 2013). "Oil price gains to above $94 on weaker dollar". News & Observer. Associated Press.
- ↑ Jonathan Fahey (April 13, 2013). "Oil Falls 2 Percent, Gas Prices to Keep Dropping". ABC News. Associated Press.
- ↑ Javier David (April 30, 2013). "Gas Prices See Cheapest April in Three Years: AAA". CNBC.
- 1 2 Jonathan Fahey (May 24, 2014). "Gasoline Prices Have Familiar Look as Summer Nears". ABC News. Associated Press.
- ↑ "Oil rises on signs US economy still needs stimulus". Seattle Post-Intelligencer. Associated Press. May 30, 2013. Archived from the original on May 31, 2013.
- ↑ "Oil rises as US supplies of oil, gasoline drop". Houston Chronicle. Associated Press. June 5, 2013.
- ↑ "Oil price down slightly on lower demand forecast". St. Louis Post-Dispatch. Associated Press. June 12, 2013.
- ↑ Pablo Gorondi (June 20, 2013). "Price of oil down below $97 a barrel after Federal Reserve says stimulus pullback likely". Star Tribune. Associated Press.
- ↑ Steve Hargreaves (July 10, 2013). "Oil prices surge above $105, gasoline tops $3.50". CNNMoney.
- ↑ Anna Louie Sussman (July 10, 2013). "Update 9-U.S. crude soars to 16-mth high; discount to Brent under $2". Reuters.
- ↑ Grant Smith and Ben Sharples (July 9, 2013). "WTI Crude Trades Near 14-Month High Before U.S. Inventory Data". Bloomberg Businessweek. Reuters.
- ↑ "Oil little changed near $108; pump price at $3.67". Seattle Post-Intelligencer. Associated Press. July 19, 2013. Archived from the original on July 20, 2013.
- ↑ "Oil rises nearly 3 pct. on global manufacturing strength and US jobs data". Washington Post. Associated Press. August 1, 2013.
- ↑ "Oil price falls as stock markets stall". CBS News. August 19, 2013.
- ↑ Grant Smith (August 29, 2013). "WTI Oil Falls From 2-Year High as Syria Strike Debated". Bloomberg News.
- ↑ "Oil posts slight gain as market watches Syria". Washington Post. Associated Press. September 11, 2013. Archived from the original on September 13, 2013.
- ↑ Jonathan Fahey (September 27, 2013). "Gas Prices Fall as Weather, Output Calm Markets". ABC News. Associated Press.
- ↑ "Gas prices have fallen 29 days in a row". WRBL. Associated Press. October 1, 2013.
- ↑ "Crude oil slips below $104 a barrel as US government shutdown continues". Washington Post. Associated Press. October 3, 2013. Archived from the original on October 3, 2013.
- ↑ "Oil: Price drops below $100 for 1st time since July". Tulsa World. Associated Press. October 21, 2013.
- ↑ Mark Shenk (November 13, 2013). "Crude Rises as Fuel-Price Gain Spurs Demand for Oil". Bloomberg News.
- ↑ "Oil prices drop after Iran nuclear deal". News 12 Long Island. Associated Press. November 25, 2013.
- ↑ "Oil Above $97 on Europe Hopes, Libyan Disruption". ABC News. Associated Press. December 16, 2013.
- 1 2 Pablo Gorondi (January 2, 2014). "Oil price falls below $96". News & Observer. Associated Press.
- ↑ "Oil Prices Remain Near $92 on Iran, Libya Outlook". ABC News. Associated Press. January 13, 2014.
- ↑ Pablo Gorondi (January 31, 2014). "Oil slips below $98 after climbing to 2014 high". Yahoo News. Associated Press.
- 1 2 "Scant relief: Summer gas prices expected to dip just a penny". The Dallas Morning News. April 8, 2014.
- ↑ Pablo Gorondi (February 27, 2014). "Oil Down Ahead of Expected Trimming in US Growth". ABC News. Associated Press.
- ↑ Pablo Gorondi (March 24, 2014). "Crude oil rises to above $100 a barrel amid Russia, Libya supply risks and Texas oil spill". U.S. News. Associated Press.
- ↑ Pablo Gorondi (March 28, 2014). "Oil Price Rises on Nigeria Supply Woes, US Growth". ABC News. Associated Press.
- ↑ Pablo Gorondi (April 7, 2014). "Oil Prices Slip Below $101 After Libyan Deal". ABC News. Associated Press.
- ↑ Pablo Gorondi (April 8, 2014). "Oil up Above $101 on Renewed Unrest in Ukraine". ABC News. Associated Press.
- ↑ "Oil Near $102 on Ukraine Crisis; US Gas Prices Up". ABC News. Associated Press. April 24, 2014.
- ↑ "Oil below $100; gas prices near peak, AAA says". Washington Post. Associated Press. April 30, 2014. Archived from the original on May 11, 2014.
- ↑ Pablo Gorondi (May 12, 2014). "Ukraine Jitters Push Crude Oil Above $100". ABC News. Associated Press.
- ↑ "Oil below $102 on weak US economic data". The Montana Standard. Associated Press. May 15, 2014.
- ↑ Pablo Gorondi (May 20, 2014). "Oil Steady Above $102 as Libya Tensions Flare". ABC News. Associated Press.
- ↑ Pablo Gorondi (May 28, 2014). "Oil higher above $104 on crises in Ukraine, Libya". Associated Press.
- 1 2 Gary Strauss (August 27, 2014). "Labor Day gas prices cheapest since 2010". USA Today.
- ↑ "Oil price weakens ahead of China data". CBS News. Associated Press. June 30, 2014.
- ↑ "Highest gas prices since 2008 expected for July 4th weekend". Baltimore Sun. July 1, 2014.
- ↑ Jonathan Fahey (July 18, 2014). "Oil Price Remains High on Global Turmoil". ABC News. Associated Press.
- ↑ Anna Louie Sussman (July 24, 2014). "UPDATE 7-Brent oil dips below $107, market well-supplied". Reuters.
- ↑ "Gas prices down thanks to refinery competition". WLWT. July 28, 2014.
- ↑ Jesse Solomon (August 12, 2014). "Iraq crisis: Why aren't gas prices spiking?". CNNMoney.
- ↑ Nicole Friedman (August 14, 2014). "Oil Prices Keep Tumbling to Multi-Month Lows". The Wall Street Journal.
- ↑ Grant Smith (October 16, 2014). "WTI Crude Falls Below $80 for First Time Since June 2012". Bloomberg Businessweek.
- ↑ Jonathan Fahey (October 31, 2014). "Gas almost under $3 nationwide: What to know". News & Observer. Associated Press.
- ↑ Michelle Conlin (December 7, 2014). "U.S. gasoline prices fall to four-year low: Lundberg survey". Reuters.
- ↑ Anjli Raval (December 8, 2014). "Oil prices slide to five-year low". Financial Times.
- ↑ "Naimi: OPEC needs more support for output cutdown". CNBC. Reuters. December 18, 2014.
- ↑ Christian Berthelsen (December 18, 2014). "Oil Prices Resume Slide". The Wall Street Journal.
- ↑ Steve Benen (December 18, 2014). "Gas prices drop below key threshold". MSNBC.
- ↑ Chris Isidore (December 23, 2014). "89 straight days of lower gas prices". CNNMoney.
- ↑ WTI Oil extends drop below $60 as IEA cuts forecast; Brent falls, Bloomberg News, 12 December 2014, retrieved 12 December 2014
- ↑ "Why price discounts for Canadian crude are here to stay", Alberta Oil, 1 September 2012, retrieved 8 December 2014
- ↑ Lawler, Alex; Sheppard, David; El Gamal, Rania (27 November 2014), Saudis block OPEC output cut, sending oil price plunging, Vienna: Reuters, retrieved 10 December 2014
- ↑ Krishnan, Barani (10 December 2014), Oil crashes 5%, nears $60 on weak U.S. demand, Saudi inaction, London: Globe and Mail via Reuters, retrieved 10 December 2014
- ↑ Mohr, Patricia (28 November 2014), Scotiabank Commodity Price Index (PDF), retrieved 8 December 2014
- ↑ Christopher Johnson (January 16, 2015). "Oil up $2 as IEA sees signs 'tide will turn'". Reuters.
- ↑ Grant Smith (January 14, 2015). "Wall Street Now Sees Oil Around $40". Bloomberg.
- ↑ Gary Strauss (January 13, 2015). "National gas prices to soon fall below $2". USA Today.
- ↑ Ben Sharples and Sharon Cho (January 23, 2015). "Oil Climbs as Saudi King's Death Spurs Policy Speculation". Bloomberg.
- ↑ "US oil ends at $48.45 a barrel; Largest 1-day percentage drop since Nov". CNBC. Reuters. February 4, 2015.
- ↑ Barani Krishnan and Robert Gibbons (February 17, 2015). "Oil up from early sell-off as Brent sets 2015 high". Reuters.
- 1 2 Ben Tracy (February 27, 2015). "Why are gas prices going up again?". CBS News.
- 1 2 3 Jonathan Fahey (March 14, 2015). "Oil is on its way down again; will gasoline prices follow?". News & Observer. Associated Press.
- ↑ David Carrig (March 13, 2015). "Stocks tumble as Dow drops 200 points". USA Today.
- ↑ "Stocks drop as oil prices decline, rate worries persist". The Washington Post. Associated Press. March 13, 2015. Archived from the original on March 13, 2015.
- ↑ Barani Krishnan (March 18, 2015). "Oil up over 6 percent as dollar falls on worry of slow U.S. rate hike". Reuters.
- ↑ Himanshu Ojha (April 17, 2015). "Brent rises above $64 after Yemen oilfield retreat". Reuters.
- ↑ "AAA Says Gas Price Average Moves Up, Remains Less than Last Year". KXAS-TV. April 17, 2015.
- ↑ Jacob Pramuk (May 5, 2015). "Rising gas prices will 'cool off': Expert". CNBC.
- ↑ Barani Krishnan (May 5, 2015). "UPDATE 13-Oil hits 2015 highs as Saudis raise prices, Libya output slows". Reuters.
- ↑ Mark Shenk (May 20, 2015). "Oil Rises After U.S. Crude Supply Drops Amid Refining Boost". Bloomberg Business.
- ↑ Daniel J. Graeber (May 26, 2015). "U.S. gas prices dip after long holiday". UPI.
- ↑ Myra P. Saefong and Georgi Kantchev (June 11, 2015). "Oil retreats from year's high, settles 1% lower". MarketWatch.
- ↑ "Oil Prices Rise on Inventory Data". Fox Business. Dow Jones Newswires. June 10, 2015.
- ↑ Martin Crutsinger (June 12, 2015). "US wholesale prices jump in May, led by eggs, gasoline". Houston Chronicle. Associated Press.
- ↑ Nicole Friedman (July 1, 2015). "Oil Prices Hit Two-Month Low on U.S. Inventory Data". The Wall Street Journal.
- ↑ "GasBuddy: Greece to blame for higher gas prices". WOOD-TV. July 1, 2015.
- ↑ Barani Krishnan (July 30, 2015). "Oil dips as robust dollar offsets stock drawdown". Reuters.
- ↑ Donnelle Eller (July 31, 2015). "$2 a gallon gasoline may be back by New Year". USA Today.
- ↑ Nicole Friedman (August 6, 2015). "Oil Prices Near Six-Year Lows on Oversupply Fears". The Wall Street Journal.
- ↑ Alex Lawler (August 6, 2015). "Brent oil prices fall after supertanker heading to Asia turns back". Reuters.
- ↑ Russell Hubbard (August 6, 2015). "$2-a-gallon gas ahead? Commodity prices are falling, but that's not always a good thing". Omaha World-Herald.
- ↑ "US oil settles at a six-year low of $43.08 a barrel". CNBC. Reuters. August 11, 2015.
- ↑ Chris Isidore (August 10, 2015). "Gas prices poised for a steep drop". CNNMoney.
- ↑ "US oil settles down 71 cents, or 1.81%, at $38.60 a barrel". CNBC. Reuters. August 26, 2015.
- ↑ "Oil surges 10.3% to $42.56 a barrel; best day since March 2009". CNBC. Reuters. August 27, 2015.
- ↑ Myra P. Saefong (August 26, 2015). "Retail gas prices are set to drop below $2 for first time since 2009". MarketWatch.
- 1 2 Christopher S. Rugaber (September 16, 2015). "US oil surges 5.7% to settle at $47.15 a barrel". CNBC. Reuters.
- ↑ "Global Oil Prices Jump as Equitiy Markets Rally". Fox Business. Reuters. September 3, 2015.
- ↑ "Oil falls more than 2 percent after Goldman cuts forecasts". CNBC. Reuters. September 11, 2015.
- ↑ Christopher S. Rugaber (September 11, 2015). "US producer prices unchanged last month as cheaper gas offset pricier food". U.S. News & World Report. Associated Press.
- ↑ Brad Tuttle (September 25, 2015). "Gas Prices Are Under $3 in Every State Except One". Time.
- ↑ Barani Krishnan (September 29, 2015). "Oil up, then pares gains after U.S. inventory build data". Reuters.
- ↑ Koustav Samanta (October 16, 2015). "Oil inches higher in volatile trade after week's sharp losses". Reuters.
- ↑ Christopher Johnson (October 20, 2015). "Oil steadies under $50 but outlook uncertain". Reuters.
- ↑ Daniel J. Graeber (October 20, 2015). "U.S. gas prices drifting lower". UPI.
- ↑ Georgi Kantchev (November 5, 2015). "Oil Prices Bounce Back as Investors Hunt Bargains". Wall Street Journal.
- ↑ Myra P. Saefong (November 4, 2015). "Get ready for the lowest holiday-gas prices in 7 years". MarketWatch.
- ↑ Barani Krishnan (November 19, 2015). "Brent steady, U.S. crude down ahead of contract expiry". Reuters.
- ↑ Frank Witsil (November 18, 2015). "Expect gas prices to keep falling through holidays". Detroit Free Press.
- ↑ Barani Krishnan (November 23, 2015). "Oil up 1 percent after Saudis say ready to cooperate on prices". Reuters.
- ↑ "Oil below $40 a barrel as OPEC rolls over policy". CNBC. Reuters. December 4, 2015.
- ↑ David Koenig (December 12, 2015). "Average gas price soon under $2, lowest since recession". News & Observer. Associated Press.
- ↑ Benoit Faucon (December 23, 2015). "OPEC Report Suggests Oil-Price Rebound, Supply Cut". The Wall Street Journal.
- ↑ "Stocks close higher as the price of crude oil stabilizes". Los Angeles Times. Associated Press. December 22, 2015.
- ↑ "Average Gas Price Falls Beneath $2 a Gallon for First Time Since 2009". CNBC. Associated Press. December 21, 2015.
- ↑ Nicole Friedman (December 30, 2015). "Oil Prices Fall on Oversupply Anxiety". The Wall Street Journal.
- ↑ US oil price falls below $50 on supply glut fears
- ↑ Gene Epstein (29 March 2014). "Here Comes $75 Oil". Retrieved 17 October 2015.
- ↑ "The Case for $35 a Barrel Oil". 6 December 2014. Retrieved 17 October 2015.
- ↑ "Renowned Trader Hall Sees $40 Oil 'Absolute Price Floor'". Bloomberg.com. 7 January 2015. Retrieved 17 October 2015.
- ↑ Friedman, Nicole (12 January 2015), "Oil Prices Fall to Fresh Lows", Wall Street Journal, New York
- 1 2 3 "Why Cheap Oil Doesn't Stop the Drilling", Bloomberg, 5 March 2015, retrieved 6 March 2015
- ↑ Friedman, Nicole (16 April 2015), "Oil Prices Hit a 2015 High on Hopes U.S. Production Will EaseLight, sweet crude for May delivery settled up 32 cents to $56.71 a barrel on the New York Mercantile Exchange", Wall Street Journal, New York, retrieved 16 April 2015
- ↑ Oil Prices Could Drop to $20 a Barrel Next Year, Jonathan Chew, Fortune, NOVEMBER 23, 2015
- ↑ How Low Can Oil Go? Goldman Says $20 a Barrel Is a Possibility, Ben Sharples, Grant Smith, Bloomberg Business September 10, 2015
- ↑ Oil producers prepare for prices to halve to $20 a barrel, Larry Elliott, The Guardian, Dec 8, 2015
- ↑ https://www.wsj.com/articles/brent-oil-prices-fall-to-levels-not-seen-since-2004-1450678344
- ↑ Oil price crashes to $33 – and could go as low as $18, TheWeek 07 January
- ↑ Christopher Johnson (January 12, 2016). "Oil crashes to $30 a barrel". CNNMoney.
- 1 2 "Oil rises, pares losses in January on hopes for production deal". CNBC. Reuters. January 29, 2016.
- ↑ "Oil prices in reverse amid Opec call". BBC. January 25, 2016.
- ↑ Tanja Babich (February 1, 2016). "Gas Prices Fall to Lowest Level Since 2009, AAA Says". WLS-TV.
- ↑ Devika Krishna Kumar (February 8, 2016). "Oil falls with glut in focus after hopes for producer deal fade". Reuters.
- ↑ Charles Riley (February 11, 2016). "Oil crash taking stocks down ... again". CNNMoney.
- ↑ Matt Egan (February 12, 2016). "Crazily volatile oil spikes 12% in biggest gain since 2009". CNNMoney.
- ↑ Marley Jay (February 23, 2016). "Oil prices lift market as energy stocks rally". Salisbury Post. Associated Press. p. 2A.
- ↑ "US oil erases gains, closes at $32.78 a barrel". CNBC. Reuters. February 26, 2016.
- ↑ Kerry Close (February 26, 2016). "Here's Where Gas Prices Are Expected to Skyrocket This Weekend". Time.
- ↑ "Oil rises on bullish US gasoline draw, OPEC speculation". CNBC. Reuters. March 9, 2016.
- ↑ "Crude Prices Fall From 2016 Highs as U.S. Oil Rig Count Rises". Fortune. Reuters. March 20, 2016.
- ↑ "Gas Prices Jump by 17 Cents Over Past 2 Weeks, to $2.02". ABC News. Associated Press. March 20, 2016.
- ↑ Libby George (March 31, 2016). "Oil prices slide as U.S. crude stocks hit record". Reuters.
- ↑ "Stocks inch higher as oil prices jump, but retailers skid". Los Angeles Times. Associated Press. April 8, 2016.
- ↑ David Sheppard (April 12, 2016). "Oil traders say worst of price crash over". Financial Times.
- ↑ Devika Krishna Kumar (April 15, 2016). "Oil falls as investors expect little from Doha meeting". Reuters.
- ↑ Devika Krishna Kumar (April 22, 2016). "Oil up, marking third week of gains as market sentiment improves". Reuters.
- ↑ Barani Krishnan (April 26, 2016). "Oil hits 2016 high after U.S. crude draw report, gasoline rally". Reuters.
- ↑ Alanna Petroff (May 17, 2016). "Oil prices hit highest level in 7 months". CNN.
- ↑ Myra P. Saefong (May 25, 2016). "Oil ends at highest since October as U.S. supplies drop". Market Watch.
- ↑ Marley Jay (June 8, 2016). "Late sell-off leaves stocks barely higher/oil rises". Salisbury Post. Associated Press. p. 2A.
- ↑ Nicole Friedman (June 24, 2016). "Oil Prices Hammered by U.K. Vote to Leave EU". The Wall Street Journal.
- ↑ Rachel Premack (June 30, 2016). "Gas prices dip to a 13-year low ahead of July 4 holiday weekend". Washington Post.
- ↑ Barani Krishnan (July 7, 2016). "Oil tumbles 5 percent after U.S. crude draw disappoints market bulls". Reuters.
- ↑ Myra P. Saefong, Jenny W. Hsu, and Sarah McFarlane (July 21, 2016). "Oil loses over 2% on high U.S. fuel stocks, slower fall in crude output". MarketWatch.
- ↑ Eli Blumenthal (July 21, 2016). "As summer heats up, gas prices stay cool". USA Today.
- ↑ "Oil prices fall as dollar jumps on US jobs data". CNBC. Reuters. August 5, 2016.
- ↑ "Stocks rise, lifted by oil prices". Los Angeles Times. Associated Press. August 15, 2016.
- ↑ "Gas prices going up, but still well below 5-year average". The Sun News. August 15, 2016.
- ↑ "US crude closes 3.45 pct lower, at $43.16, marking a 3-week low". CNBC. Reuters. September 1, 2016.
- ↑ Patti Domm (September 19, 2016). "Gasoline price pinch could get worse before gets better". CNBC.
- ↑ "Company Restarts Gasoline Pipeline After Leak in Alabama". ABC News. Associated Press. September 21, 2016.
- ↑ Debbie Carlson (September 24, 2016). "Third time's the charm? Opec members meet again to tackle low oil prices". The Guardian.
- ↑ Alison Sider and Sarah McFarlane (September 29, 2016). "Oil Prices Climb After OPEC Deal". The Wall Street Journal.
- ↑ "Oil drifts after Brent breaks $50 a barrel, US crude touches 3-month high". CNBC. Reuters. October 3, 2016.
- ↑ Barani Krishnan (October 10, 2016). "Oil hits one-year high as Russia ready to join output caps". Reuters.
- ↑ Ethan Lou (October 17, 2016). "Oil ends lower on U.S. trade spike; shale decline limits losses". Reuters.
- ↑ "US crude surges 2.6% on EIA data to settle at $51.60, best close since July 2015". CNBC. Reuters. October 19, 2016.
- ↑ Akin Oyedele (October 31, 2016). "Crude oil is getting slammed after another OPEC meeting flop". Business Insider. Reuters.
- ↑ "US crude loses steam after rising on OPEC deal hope, settles down 15 cents at $45.42". CNBC. Reuters. November 17, 2016.
- ↑ David Gaffen (November 21, 2016). "Oil jumps, at three-week high ahead of OPEC output decision". Reuters.
- ↑ Devika Krishna Kumar and Jessica Resnick-Ault (December 1, 2016). "After OPEC deal, oil expected to rally – for the moment". Reuters.
- ↑ "US crude posts best settle since July 2015, up 2.6% at $52.83 on oil producer output cuts". CNBC. Reuters. December 12, 2016.
- ↑ Mark Decambre and Jenny W. Hsu (December 21, 2016). "Oil settles sharply lower as U.S. crude inventories climb; natural-gas futures surge". MarketWatch.
- ↑ David Gaffen (December 27, 2016). "Oil rallies in thin trade, adds to year's gains". Reuters.
- ↑ Mark Tay (December 30, 2016). "Oil prices edge up despite unexpected U.S. crude inventory build". Reuters.
- ↑ Ethan Lou (December 30, 2016). "Oil down, but ends year with biggest gain since 2009". Reuters.
- ↑ Devika Krishna Kumar (January 13, 2017). "Oil falls on China concerns, down 3 percent for the week on China doubts". Reuters.
- ↑ Scott DiSavino (January 18, 2017). "Oil prices fall on strong dollar, U.S. output rise expectations". Reuters.
- ↑ Naveen Thukral (January 24, 2017). "U.S. oil prices rise on weaker dollar, U.S. drilling in focus". Reuters.
- ↑ Henning Gloystein (January 26, 2017). "Oil prices rise on weakening dollar, but plentiful supplies cap gains". Reuters.
- ↑ Myra P. Saefong (February 8, 2017). "Oil turns higher despite second-largest weekly climb on record for U.S. crude supply". MarketWatch.
- ↑ Myra P. Saefong (February 7, 2017). "Oil finishes at lowest level in almost 3 weeks". MarketWatch.
- ↑ Myra P. Saefong (February 17, 2017). "Oil logs weekly drop on concerns over rise in U.S. crude supply and output". MarketWatch.
- ↑ Tina Wadhwa (February 22, 2017). "Oil slides on word non-OPEC members aren't cutting production as much as promised". Business Insider.
- ↑ "US crude settles at $53.59, down 1.4%, on worries of swelling US stockpiles". CNBC. Reuters. February 22, 2017.
- ↑ Myra P. Saefong (March 2, 2017). "Oil prices drop to lowest finish in 3 weeks". MarketWatch.
- ↑ "US crude tumbles again, settling at $49.28, lowest close since November". CNBC. Reuters. March 9, 2017.
- ↑ Aparna Narayanan (March 14, 2017). "ETF Investors Short Energy Stocks As Oil Slides To A Fresh 3-Month Low". Investor's Business Daily.
- ↑ Devika Krishna Kumar (March 16, 2017). "Oil edges lower despite weak dollar as U.S. stockpiles remain high". Reuters.
- ↑ Myra Saefong and Victor Reklaitis (March 22, 2017). "Oil ends lower, as drop in gasoline stocks softens blow of record U.S. supplies". MarketWatch.
- ↑ Rodrigo Campos (March 30, 2017). "Equity markets gain with oil price, U.S. GDP revision". Reuters.
- ↑ David Gaffen (April 6, 2017). "Oil prices hit one-month highs as buyers stay upbeat". Reuters.
- ↑ Henning Gloystein (April 12, 2017). "Oil prices rise on prospect that Saudi Arabia seeking output cut extension". Reuters.
- ↑ Fran Daniel (April 14, 2017). "Higher gas prices expected over the Easter weekend". Winston-Salem Journal.
- ↑ Patti Domm (April 20, 2017). "Oil could be a big factor Thursday after price slump". CNBC.
- ↑ Henning Gloystein (April 20, 2017). "Oil prices claw back ground after sharp drop, buoyed by US crude stock dip". Reuters.
- ↑ Devika Krishna Kumar (April 24, 2017). "Oil slips on OPEC cut extension doubts, Russia output worries". Reuters.
- ↑ "US crude plunges 4.8% to $45.52, posting worst close in more than five months". CNBC. Reuters. May 4, 2017.
- ↑ "US crude settles at $47.83, up 1.1%, continuing rally on signs market is tightening". CNBC. Reuters. May 11, 2017.
- ↑ "Oil prices climb on hopes output cuts will be extended". Reuters. May 19, 2017.
- ↑ John Kemp (May 26, 2017). "Oil prices tumble after OPEC rollover". Reuters.
- ↑ Jane Chung (June 2, 2017). "Oil prices slide nearly 1 pct on persistent glut concerns". Reuters.
- ↑ Henning Gloystein (June 9, 2017). "Oil prices continue to slide as supply overhang prevails". Reuters.
- ↑ Henning Gloystein (June 14, 2017). "Oil prices fall on OPEC output increase, rising U.S. crude stocks". Reuters.
- ↑ Julia Simon (June 16, 2017). "Oil prices edge up; still near 2017 lows on stubborn glut". Reuters.
- ↑ "Oil prices climb off 10-month lows as U.S. stockpiles drop". Reuters. June 22, 2017.
- ↑ Henning Gloystein (June 28, 2017). "Oil prices drop as rising U.S. fuel stocks revive glut concerns". Reuters.
- ↑ Henning Gloystein (July 4, 2017). "Oil prices dip ahead of U.S. holiday after 8 days of gains". Reuters.
- ↑ Henning Gloystein (July 7, 2017). "Oil prices slump over 1 pct on rise in U.S. output". Reuters.
- ↑ Henning Gloystein (July 12, 2017). "Oil prices rise on falling U.S. fuel inventories, lower production outlook". Reuters.
- ↑ Henning Gloystein (July 14, 2017). "Oil prices dip on high supplies, improving industry efficiency". Reuters.
- ↑ Amanda Cooper (August 2, 2017). "UPDATE 6-Oil dodges bears, climbs back towards $52 per barrel". CNBC. Reuters.
- ↑ "US crude falls 1.1%, settling at $49.03, amid concerns about oil cartel's growing output". CNBC. Reuters. August 3, 2017.
- ↑ Scott DiSavino (August 4, 2017). "US crude falls 1.1%, settling at $49.03, amid concerns about oil cartel's growing output". Reuters.
- ↑ Jane Chung (August 11, 2017). "Oil prices flat as oversupply concerns linger". Reuters.
- ↑ Fergus Jensen (August 15, 2017). "Oil prices steady after overnight tumble". Reuters.
- ↑ "Oil prices steady after overnight tumble". Reuters. August 23, 2017.
- ↑ "Gas prices rise as Harvey takes aim at Gulf Coast". CNBC. August 24, 2017.
- ↑ Julia Simon (August 29, 2017). "Gasoline jumps, crude down; Harvey shuts 24 percent of U.S. refining". Reuters.
- ↑ Ahmad Ghaddar and Dmitry Zhdannikov (August 29, 2017). "As oil prices weather storm, OPEC looks for long-term boost from Harvey". Reuters.
- ↑ Julia Simon (September 2, 2017). "Retail U.S. gasoline prices surge as refineries warn of shortages after Harvey". Reuters.
- ↑ Claudia Lauer and Jeff Martin (September 1, 2017). "Gas prices surge higher as drivers rush to fill their tanks". News & Record. Associated Press.
- ↑ John Boyle (September 17, 2017). "Answer Man: Why haven't gas prices come back down? Why no E85 fuel around?". Asheville Citizen-Times.
- ↑ Julia Simon (October 3, 2017). "Oil prices dip on profit-taking and U.S. production fears". Reuters.
- ↑ "Oil prices drop on rising U.S. crude inventories". Reuters. October 12, 2017.
- ↑ "Oil prices edge up on signs of tightening market". Reuters. October 20, 2017.
- ↑ Lynn Adler (November 1, 2017). "LPC: More competitive U.S. oil and gas lending drives down pricing". Reuters.
- ↑ Scott DiSavino (November 10, 2017). "Oil prices slide after U.S. drillers add rigs". Reuters.
- ↑ "U.S. oil prices near 2-year highs as key pipeline stays closed". Reuters. November 26, 2017.
- ↑ Devika Krishna Kumar (November 28, 2017). "Oil prices slip on OPEC deal extension jitters". Reuters.
- ↑ "Oil prices dip on stronger dollar". Reuters. December 8, 2017.
- ↑ Julia Simon (December 14, 2017). "Oil prices up on pipeline outage support". Reuters.
- ↑ Henning Gloystein (December 11, 2017). "Oil prices drop on increased U.S. rig drilling". Reuters.
- ↑ Henning Gloystein (December 28, 2017). "Oil prices near 2015 highs on tight market". Reuters.
- ↑ "Oil marks highest January opening price since 2014". Reuters. January 1, 2018.
- ↑ "Oil prices hold near 2015 highs, but doubts over rally emerge". Reuters. January 5, 2018.
- ↑ Henning Gloystein (January 19, 2018). "Oil prices drop on uptick in U.S. production". Reuters.
- ↑ Myra P. Saefong and Barbara Kollmeyer (January 31, 2018). "Oil prices end higher as U.S. crude supplies surge, but product stocks decline". Market Watch.
- ↑ Tom DiChristopher (February 7, 2018). "Oil prices tank 2.5 percent, settling at one-month low of $61.79, after US crude and fuel stockpiles jump". CNBC.
- ↑ Myra P. Saefong and Sarah McFarlane (March 1, 2018). "Oil prices slip on fresh evidence of rising U.S. stocks and output". Market Watch.
- ↑ Myra P. Saefong and Barbara Kollmeyer (March 7, 2018). "Oil prices drop over 2% as trade-war concerns sink in and U.S. output climbs". Market Watch.
- ↑ Myra P. Saefong and Christopher Alessi (March 15, 2018). "Oil prices edge higher, helped by signs of growing demand". Market Watch.
- ↑ Myra P. Saefong and Christopher Alessi (March 21, 2018). "Oil prices end near 7-week high on surprise declines in U.S. crude supplies". Market Watch.
- ↑ Myra P. Saefong and Sarah McFarlane (March 29, 2018). "Oil ends higher, notches third straight quarterly rise". Market Watch.
- ↑ Myra P. Saefong, Mark Decambre and Sarah McFarlane (April 11, 2018). "Oil settles at a more than 3-year high on Middle East tensions". Market Watch.
- ↑ Tom DiChristopher (April 19, 2018). "US oil closes 0.3% lower, falls from more than 3-year high". CNBC.
- ↑ Myra P. Saefong and Christopher Alessi (May 18, 2018). "Oil falls for the session, but U.S. benchmark logs 3rd weekly gain in a row". Market Watch.
- ↑ Myra P. Saefong and Sara Sjong (May 25, 2018). "Oil posts hefty loss for the week as OPEC, Russia talk output increase". Market Watch.
- ↑ "Gas prices hold steady through holiday weekend as crude price plunges". Salisbury Post. May 29, 2018.
- 1 2 Myra P. Saefong (August 29, 2018). "Gas prices are set to drop as summer driving season ends". Market Watch.
- ↑ Myra P. Saefong and Mark DeCambre (May 30, 2018). "Oil prices rally, with U.S. crude notching the first gain in 6 sessions". Market Watch.
- ↑ Myra P. Saefong, Mark DeCambre and Christopher Alessi (June 14, 2018). "U.S. oil prices end at 2-week high; Brent falls on bets for higher OPEC output". Market Watch.
- ↑ "US crude surges 4.6%, settling at $68.58, after OPEC agrees to moderate oil output hike". CNBC. Reuters. June 22, 2018.
- ↑ Myra P. Saefong and Mark DeCambre (June 29, 2018). "Oil marks a fourth climb, with U.S. prices tallying a year-to-date gain of more than 20%". Market Watch.
- ↑ Myra P. Saefong and Barbara Kollmeyer (July 2, 2018). "U.S. oil prices slip, but global prices sink as traders fret over potential for higher output". Market Watch.
- ↑ Myra P. Saefong and David Hodari (July 13, 2018). "Oil prices rise, but post sharp weekly loss amid expectations for rising Libyan output". Market Watch.
- ↑ Myra P. Saefong and William Watts (July 19, 2018). "U.S. oil ends higher with Saudis set to lower exports in bid to avoid oversupply". Market Watch.
- ↑ Mark DeCambre and Rachel Koning Beals (August 8, 2018). "U.S. oil ends at nearly 7-week low as EIA report fuels downbeat mood". Market Watch.
- ↑ William Watts (August 15, 2018). "Oil falls sharply, ends at 10-week low after unexpected rise in U.S. crude inventories". Market Watch.
- ↑ Myra P. Saefong and Mark DeCambre (August 22, 2018). "Oil prices tally a fifth straight session climb as U.S. crude supply drops". Market Watch.
- ↑ Myra P. Saefong and Mark DeCambre (August 28, 2018). "U.S. oil slips back after 2-session climb ahead of domestic inventory data". Market Watch.
- ↑ Myra P. Saefong and Christopher Alessi (September 6, 2018). "Oil ends lower as demand concerns persist, despite drop in U.S. crude supplies". Market Watch.
- ↑ Myra P. Saefong and Mark DeCambre (September 13, 2018). "Oil prices fall as IEA pegs global supplies at a record and Hurricane Florence weakens". Market Watch.
- ↑ Myra P. Saefong and Mark DeCambre (October 1, 2018). "U.S. and Brent crude reach highest settlements in nearly 4 years". Market Watch.
- ↑ Myra P. Saefong and Mark DeCambre (October 5, 2018). "Oil prices gain, look set to tally a fourth weekly climb in a row". Market Watch.
- ↑ Myra P. Saefong and Rachel Koning Beals (October 12, 2018). "U.S. oil benchmark gains for the session, but weekly loss is first in five weeks". Market Watch.