Nagios
 Nagios Core 4.0.8 web interface dashboard | |
| Original author(s) | Ethan Galstad and others |
|---|---|
| Initial release | March 1, 2002[1] |
| Stable release |
4.4.2
/ August 16, 2018[2] |
| Repository |
github |
| Written in | C |
| Operating system | Cross-platform |
| Type | Network monitoring |
| License | GPLv2 |
| Website |
www |
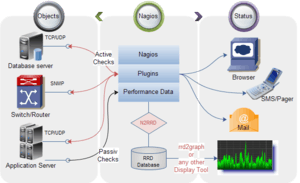
Nagios /ˈnɑːɡiːoʊs/, now known as Nagios Core, is a free and open source computer-software application that monitors systems, networks and infrastructure. Nagios offers monitoring and alerting services for servers, switches, applications and services. It alerts users when things go wrong and alerts them a second time when the problem has been resolved.
Ethan Galstad and a group of developers originally wrote Nagios as NetSaint. As of 2015 they actively maintain both the official and unofficial plugins. Nagios is a recursive acronym: "Nagios Ain't Gonna Insist On Sainthood"[3] – "sainthood" makes reference to the original name NetSaint, which changed in response to a legal challenge by owners of a similar trademark.[4] "Agios" (or "hagios") also transliterates the Greek word άγιος, which means "saint".
Nagios was originally designed to run under Linux, but it also runs well on other Unix variants. It is free software licensed under the terms of the GNU General Public License version 2 as published by the Free Software Foundation.
Overview

Nagios Core is open source software licensed under the GNU GPL V2.
Currently it provides:
- Monitoring of network services (SMTP, POP3, HTTP, NNTP, ICMP, SNMP, FTP, SSH)
- Monitoring of host resources (processor load, disk usage, system logs) on a majority of network operating systems, including Microsoft Windows, using monitoring agents.
- Monitoring of any hardware (like probes for temperature, alarms, etc.) which have the ability to send collected data via a network to specifically written plugins
- Monitoring via remotely run scripts via Nagios Remote Plugin Executor
- Remote monitoring supported through SSH or SSL encrypted tunnels.
- A simple plugin design that allows users to easily develop their own service checks depending on needs, by using their tools of choice (shell scripts, C++, Perl, Ruby, Python, PHP, C#, etc.)
- Available data graphing plugins
- Parallelized service checks
- Flat-text formatted configuration files (integrates with many config editors)
- The ability to define network host using 'parent' hosts, allowing the detection of and distinction between hosts that are down or unreachable
- Contact notifications when service or host problems occur and get resolved (via e-mail, pager, SMS, or any user-defined method through plugin system)
- The ability to define event handlers to be run during service or host events for proactive problem resolution
- Automatic log file rotation
- Support for implementing redundant monitoring hosts
- Support for implementing performance data graphing
- Support for database backend (such as NDOUtils)
- An web-interface for viewing current network status, notifications, problem history, log files, etc.
Nagios agents
NRPE
Nagios Remote Plugin Executor (NRPE) is a Nagios agent that allows remote system monitoring using scripts that are hosted on the remote systems.[5] It allows for monitoring of resources such as disk usage, system load or the number of users currently logged in. Nagios periodically polls the agent on remote system using the check_nrpe plugin.
NRPE allows you to remotely execute Nagios plugins on other Linux/Unix machines. This allows you to monitor remote machine metrics (disk usage, CPU load, etc.). NRPE can also communicate with some of the Windows agent add-ons, so you can execute scripts and check metrics on remote Windows machines, as well..
NRDP
Nagios Remote Data Processor (NRDP) is a Nagios agent with a flexible data transport mechanism and processor.[6] It is designed with an architecture that allows it to be easily extended and customized. NRDP uses standard ports and protocols (HTTP and XML) and can be implemented as a replacement for Nagios Service Check Acceptor (NSCA).
NSClient++
This program is mainly used to monitor Windows machines. Being installed on a remote system NSClient++ listens to port TCP 12489. The Nagios plugin that is used to collect information from this addon is called check_nt. As NRPE, NSClient++ allows to monitor the so-called 'private services' (memory usage, CPU load, disk usage, running processes, etc.) Nagios is a host and service monitor which is designed to inform you of network problems.
NCPA
The Nagios Cross Platform Agent is an open source project maintained by Nagios Enterprises.[7] NCPA installs on Windows, Linux, and Mac OS X. Created as a scale-able API that allows flexibility and simplicity in monitoring hosts. NCPA allows multiple checks such as memory usage, CPU usage, disk usage, processes, services, and network usage. Active checks are queried through the API of the "NCPA Listener" service while passive checks are sent via the "NCPA Passive" service.
Nagios XI
Nagios XI is an extended interface, config manager, and toolkit using Nagios Core as the back-end, written and maintained by the original author, Ethan Galstad, and Nagios Enterprises. It is an enterprise-class application that monitors systems, networks and infrastructure. It offers an extensive user interface, configuration editor, advanced reporting, monitoring wizards, an extensible front-end and back-end, along with many other additions over Nagios Core.[8] CentOS and RHEL are the currently supported operating systems. It combines Nagios Core with other technologies. Its main database and the ndoutils module that is used alongside Nagios Core use MySQL. Prior to XI 5, PostgreSQL was used for one of the three databases it uses, and is no longer used on new installs of Nagios XI. While the front-end of Nagios Core is mainly CGI with some PHP,[9] most of the Nagios XI front-end and back-end are written in PHP including the subsystem, event handlers, and notifications, and Python is used to create capacity planning reports and other reports. RRDtool and Highcharts are included to create customizable graphs that can be displayed in dashboards.
2014 controversy over plugins website
On 16 January 2014, Nagios Enterprises redirected the nagios-plugins.org domain to a web server controlled by Nagios Enterprises without explicitly notifying the Nagios Plugins community team the consequences of their actions.[10][11] Nagios Enterprises replaced the nagios-plugins team with a group of new, different members.[12] The community team members who were replaced continued their work under the name Monitoring Plugins along with a new website with the new domain of monitoring-plugins.org. [13]
See also
| Wikimedia Commons has media related to Nagios. |
- Check MK – An extension that offloads work from Nagios Core and allows distributed monitoring
- Comparison of network monitoring systems
- Icinga – A fork of Nagios Core
- Naemon – A fork of Nagios Core
- NConf – A tool for configuring Nagios Core
- Shinken – A fork of Nagios Core
- Vigilo NMS - A tool built on top of Nagios that provides new web interfaces
References
- ↑ "NetSaint Change Log". 2002-03-01. Archived from the original on 2006-05-01.
- ↑ "Releases - NagiosEnterprises/nagioscore". 16 August 2018. Retrieved 23 August 2018.
- ↑ Galstad, Ethan (2009-08-24). "FAQ Database: Miscellaneous: What does Nagios mean?". Nagios: Frequently Asked Questions. Nagios Enterprises, LLC. Retrieved 2014-06-02.
The official meaning is that N.A.G.I.O.S. is a recursive acronym which stands for "Nagios Ain't Gonna Insist On Sainthood".
- ↑ "2005-02-22 - Ethan Galstad". FOSDEM 2005. 2005-02-22. Retrieved 2014-06-02.
Although we were able to eventually reach an amicable agreement on my future use of the name "NetSaint", I felt it was prudent to change the name in order to prevent any future mishaps.
- ↑ "NagiosEnterprises/nrpe". github.com.
- ↑ "NagiosEnterprises/nrdp". github.com.
- ↑ "NCPA". GitHub.
- ↑ "Nagios XI - Easy Network, Server Monitoring and Alerting".
- ↑ "ageric/nagios". github.com.
- ↑ "Bug 1054340: Update upstream URL to https://www.monitoring-plugins.org". Red Hat. 2014-01-16. Retrieved 2014-06-02.
- ↑ "Nagios-Plugins Web Site Taken Over By Nagios". Slashdot.
- ↑ "Uncomfortable Info On The Plugin Team Changes". nagios-plugins.org. Retrieved 29 June 2016.
- ↑ Holger Weiß (2014-01-16). "HEADS UP New project name: Monitoring Plugins". Retrieved 2014-06-02.
Further reading
- Barth, Wolfgang; (2006) Nagios: System And Network Monitoring - No Starch Press ISBN 1-59327-070-4
- Barth, Wolfgang; (2008) Nagios: System And Network Monitoring, 2nd edition - No Starch Press ISBN 1-59327-179-4
- Turnbull, James; (2006) Pro Nagios 2.0 - San Francisco: Apress ISBN 1-59059-609-9
- Josephsen, David; (2007) Building a Monitoring Infrastructure with Nagios - Prentice Hall ISBN 0-13-223693-1
- Dondich, Taylor; (2006) Network Monitoring with Nagios - O'Reilly ISBN 0-596-52819-1
External links
- Official Nagios Website
- Official Nagios Core Website
- nagioscore on GitHub
- Official Nagios Plugin Exchange
- Official Nagios Plugins
- Monitoring Plugins Project