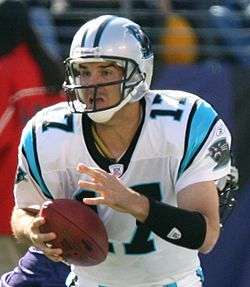
Jake Delhomme is the Ragin' Cajuns' all-time leader in passing yards and passing touchdowns.
The Louisiana Ragin' Cajuns football statistical leaders are individual statistical leaders of the Louisiana Ragin' Cajuns football program in various categories,[1] including passing, rushing, receiving, total offense, defensive stats, and kicking. Within those areas, the lists identify single-game, single-season, and career leaders. The Ragin' Cajuns represent the University of Louisiana at Lafayette in the NCAA's Sun Belt Conference.
Although Louisiana–Lafayette began competing in intercollegiate football in 1902,[1] the school's official record book considers the "modern era" to have begun in 1949. Records from before this year are often incomplete and inconsistent, and they are generally not included in these lists.
These lists are dominated by more recent players for several reasons:
- Since 1949, seasons have increased from 10 games to 11 and then 12 games in length.
- The NCAA didn't allow freshmen to play varsity football until 1972 (with the exception of the World War II years), allowing players to have four-year careers.
- Bowl games only began counting toward single-season and career statistics in 2002.[2] The Ragin' Cajuns have played in five bowl games since this decision (all since 2011), giving many recent players an extra game to accumulate statistics.
These lists are updated through the end of the 2016 season.
Passing
Passing yards
Career
| Rk |
Player |
Yards |
Years |
| 1 | Jake Delhomme | 9,216 | 1993 1994 1995 1996 |
| 2 | Terrance Broadway | 7,556 | 2012 2013 2014 |
| 3 | Jerry Babb | 6,241 | 2003 2004 2005 2006 |
| 4 | Brian Mitchell | 5,447 | 1986 1987 1988 1989 |
| 5 | Jon Van Cleave | 5,267 | 2001 2002 2003 2004 |
| 6 | Chris Masson | 4,757 | 2008 2009 2010 2011 |
| 7 | Roy Henry | 4,656 | 1975 1976 1977 |
| 8 | Blaine Gautier | 4,159 | 2009 2010 2011 2012 |
| 9 | Michael Desormeaux | 3,893 | 2005 2006 2007 2008 |
| 10 | Don Wallace | 2,701 | 1981 1982 1983 1984 |
|
Single season
| Rk |
Player |
Yards |
Year |
| 1 | Blaine Gautier | 2,958 | 2011 |
| 2 | Jake Delhomme | 2,901 | 1996 |
| 3 | Terrance Broadway | 2,842 | 2012 |
| 4 | Jake Delhomme | 2,761 | 1995 |
| 5 | Jon Van Cleave | 2,499 | 2001 |
| 6 | Terrance Broadway | 2,419 | 2013 |
| 7 | Chris Masson | 2,406 | 2009 |
| 8 | Jerry Babb | 2,345 | 2004 |
| 9 | Terrance Broadway | 2,295 | 2014 |
| 10 | Anthony Jennings | 2,169[3] | 2016 |
|
Single game
| Rk |
Player |
Yards |
Year |
Opponent |
| 1 | Eric Rekieta | 473 | 2003 | Louisiana-Monroe |
| 2 | Blaine Gautier | 470[4] | 2011 | San Diego State |
| 3 | Jerry Babb | 435 | 2003 | Middle Tennessee |
| 4 | Blaine Gautier | 419[5] | 2011 | Western Kentucky |
| 5 | Jon Van Cleave | 407 | 2001 | Idaho |
|
Passing touchdowns
|
|
|
Single game
| Rk |
Player |
TDs |
Year |
Opponent |
| 1 | Jake Delhomme | 5 | 1996 | Northern Illinois |
|
Rushing
Rushing yards
Career
| Rk |
Player |
Yards |
Years |
| 1 | Tyrell Fenroy | 4,646 | 2005 2006 2007 2008 |
| 2 | Elijah McGuire | 4,312[6] | 2013 2014 2015 2016 |
| 3 | Brian Mitchell | 3,335 | 1986 1987 1988 1989 |
| 4 | Alonzo Harris | 3,330 | 2011 2012 2013 2014 |
| 5 | Michael Desormeaux | 2,843 | 2005 2006 2007 2008 |
| 6 | Darren Brister | 2,432 | 1996 1998 1999 2000 |
| 7 | Kenyon Cotton | 2,311 | 1993 1994 1995 1996 |
| 8 | Thomas Jackson | 1,979 | 1982 1983 1984 1985 |
| 9 | F. G. Mixon | 1,908 | 1949 1950 1951 1952 |
| 10 | Steve Mocek | 1,781 | 1991 1992 1993 1994 |
|
|
Single game
| Rk |
Player |
Yards |
Year |
Opponent |
| 1 | Tyrell Fenroy | 297 | 2008 | Louisiana-Monroe |
| 2 | Brian Mitchell | 271 | 1987 | Colorado State |
| 3 | Elijah McGuire | 265[7] | 2014 | Arkansas State |
| 4 | F. G. Mixon | 261 | 1951 | Stephen F. Austin |
| 5 | Brian Mitchell | 232 | 1989 | Arkansas State |
|
Rushing touchdowns
|
|
|
Single game
| Rk |
Player |
TDs |
Year |
Opponent |
| 1 | Brian Mitchell | 5 | 1989 | Lamar |
| Alonzo Harris | 5[8] | 2014 | South Alabama |
| Elijah McGuire | 5[9] | 2015 | Northwestern State |
|
Total offense
Total offense is the sum of passing and rushing statistics. It does not include receiving or returns.[15]
Total offense yards
Career
| Rk |
Player |
Yards |
Years |
| 1 | Terrance Broadway | 9,420 | 2012 2013 2014 |
| 2 | Jake Delhomme | 8,876 | 1993 1994 1995 1996 |
| 3 | Brian Mitchell | 8,782 | 1986 1987 1988 1989 |
| 4 | Jerry Babb | 7,730 | 2003 2004 2005 2006 |
| 5 | Michael Desormeaux | 6,736 | 2005 2006 2007 2008 |
| 6 | Jon Van Cleave | 5,269 | 2002 2003 2004 |
| 7 | Blaine Gautier | 5,042 | 2009 2010 2011 2012 |
| 8 | Chris Masson | 4,975 | 2008 2009 2010 2011 |
| 9 | Roy Henry | 4,793 | 1975 1976 1977 |
| 10 | Tyrell Fenroy | 4,646 | 2005 2006 2007 2008 |
|
Single season
| Rk |
Player |
Yards |
Year |
| 1 | Terrance Broadway | 3,611 | 2012 |
| 2 | Blaine Gautier | 3,444 | 2011 |
| 3 | Brian Mitchell | 3,277 | 1989 |
| 4 | Terrance Broadway | 2,948 | 2014 |
| 5 | Michael Desormeaux | 2,911 | 2008 |
| 6 | Terrance Broadway | 2,861 | 2013 |
| 7 | Jake Delhomme | 2,822 | 1996 |
| 8 | Jake Delhomme | 2,769 | 1995 |
| 9 | Brian Mitchell | 2,550 | 1988 |
| 10 | Michael Desormeaux | 2,546 | 2007 |
|
Single game
| Rk |
Player |
Yards |
Year |
Opponent |
| 1 | Blaine Gautier | 492[4] | 2011 | San Diego State |
| 2 | Brian Mitchell | 476 | 1987 | Colorado State |
| Eric Rekieta | 476 | 2003 | Louisiana-Monroe |
| 4 | Jerry Babb | 474 | 2003 | Middle Tennessee |
| 5 | Terrance Broadway | 460[16] | 2012 | Louisiana-Monroe |
|
Defense
Interceptions
Career
| Rk |
Player |
Ints |
Years |
| 1 | Mike McDonald | 21 | 1968 1969 1970 1971 |
| 2 | Ron Irving | 19 | 1976 1977 1978 |
| 3 | Orlando Thomas | 18 | 1991 1992 1993 1994 |
| 4 | Ed Pratt | 17 | 1964 1965 1966 1967 |
| 5 | Charles Tillman | 12 | 1999 2000 2001 2002 |
|
Single season
| Rk |
Player |
Ints |
Year |
| 1 | Ed Pratt | 9 | 1965 |
| Mike McDonald | 9 | 1970 |
| Orlando Thomas | 9 | 1993 |
| 4 | Mike McDonald | 8 | 1968 |
| Ron Irving | 8 | 1976 |
|
Single game
| Rk |
Player |
Ints |
Year |
Opponent |
| 1 | Mike McDonald | 4 | 1970 | Northeast Louisiana |
|
Tackles
Career
| Rk |
Player |
Tackles |
Years |
| 1 | Steve Spinella | 386 | 1982 1983 1984 1985 |
| 2 | Orlando Thomas | 347 | 1991 1992 1993 1994 |
| 3 | Chris Jacobs | 326 | 1982 1983 1984 1985 |
| 4 | Dale Thomas | 311 | 1977 1978 1979 1980 |
| 5 | Antwyne Zanders | 308 | 2006 2007 2008 2009 |
| 6 | Charles Tillman | 284 | 1999 2000 2001 2002 |
| 7 | Frank Bartley | 278 | 1976 1977 1978 |
| 8 | Randy Thomas | 272 | 1977 1978 1979 1980 |
| 9 | Charles Pool | 270 | 1991 1992 1993 |
| Kyries Hebert | 270 | 1999 2000 2001 |
|
Single season
| Rk |
Player |
Tackles |
Year |
| 1 | Frank Bartley | 208 | 1978 |
| 2 | Steve Spinella | 144 | 1985 |
| 3 | Damon Mason | 135 | 1996 |
| 4 | Steve Spinella | 131 | 1984 |
| Justin Anderson | 131 | 2013 |
| 6 | Chris Jacobs | 120 | 1985 |
|
Single game
| Rk |
Player |
Tackles |
Year |
Opponent |
| 1 | Frank Bartley | 30 | 1978 | Southern Illinois |
|
Sacks
Career
| Rk |
Player |
Sacks |
Years |
| 1 | Jeff Mitchell | 21.0 | 1992 1993 1994 1995 |
| Christian Ringo | 21.0 | 2011 2012 2013 2014 |
| 3 | Paul Cabbie | 19.0 | 1993 1994 1995 1996 |
| 4 | Chris Gannon | 18.0 | 1985 1986 1987 1988 |
| 5 | Walter Sampson | 16.5 | 1999 2000 2001 2002 |
|
Single season
| Rk |
Player |
Sacks |
Year |
| 1 | Christian Ringo | 11.5 | 2014 |
| 2 | Conrad Lewis | 11.0 | 1993 |
| Jeff Mitchell | 11.0 | 1993 |
| 4 | Paul Cabbie | 9.0 | 1996 |
| 5 | Danny Scott | 8.0 | 1998 |
|
|
Kicking
Field goals made
Career
| Rk |
Player |
FGs |
Years |
| 1 | John Roveto | 45 | 1977 1978 1979 |
| Brett Baer | 45 | 2010 2011 2012 |
| 3 | Patrick Broussard | 44 | 1984 1985 1986 1987 |
| 4 | Sean Comiskey | 42 | 2002 2003 2004 2005 |
| 5 | Mike Lemoine | 38 | 1988 1989 1990 |
|
Single season
| Rk |
Player |
FGs |
Year |
| 1 | Brett Baer | 20 | 2012 |
| 2 | John Roveto | 19 | 1977 |
| Steven Artigue | 19[17] | 2016 |
| 4 | Brett Baer | 18 | 2011 |
| Hunter Stover | 18 | 2014 |
| 6 | Rafael Septién | 15 | 1974 |
| 7 | John Roveto | 14 | 1978 |
| Mike Shafer | 14 | 1994 |
| Sean Comiskey | 14 | 2004 |
|
Single game
| Rk |
Player |
FGs |
Year |
Opponent |
| 1 | Rafael Septién | 6 | 1974 | San Jose State |
| Mike Lemoine | 6 | 1989 | Central Michigan |
|
Field goal percentage
|
|
Single season
| Rk |
Player |
FG% |
Year |
| 1 | Mike Shafer | 100.0% | 1994 |
| Brett Baer | 100.0% | 2010 |
| 3 | Brett Baer | 90.0% | 2011 |
|
References
- 1 2 "2016 Louisiana–Lafayette Ragin' Cajuns Media Guide". issuu.com. Retrieved August 20, 2016.
- ↑ "NCAA changes policy on football stats". ESPN.com. AP. August 28, 2002. Retrieved August 20, 2016.
- 1 2 "Anthony Jennings". ESPN.com. Retrieved December 18, 2016.
- 1 2 3 "Brett Baer's 50-yard FG lifts La.-Lafayette vs. SDSU". ESPN.com. December 17, 2011.
- ↑ "W. Kentucky 42, Louisiana-Lafayette 23". ESPN.com. October 22, 2011.
- 1 2 3 4 "Elijah McGuire". ESPN.com. Retrieved December 18, 2016.
- ↑ "Louisiana-Lafayette beats Arkansas State 55-40". ESPN.com. October 21, 2014.
- ↑ "Louisiana-Lafayette 19, South Alabama 9". ESPN.com. November 1, 2014.
- ↑ "Louisiana-Lafayette 44, Northwestern State 17". ESPN.com. September 12, 2015.
- 1 2 "Al Riles". ESPN.com. Retrieved December 18, 2016.
- ↑ "Louisiana-Lafayette 36, Louisiana-Monroe 35". ESPN.com. November 5, 2011.
- ↑ "Louisiana-Lafayette 31, W. Kentucky 27". ESPN.com. November 17, 2012.
- ↑ "Louisiana-Lafayette 37, FAU 34". ESPN.com. October 1, 2011.
- ↑ "New Mexico State edges Louisiana-Lafayette 37-34". ESPN.com. November 21, 2015.
- ↑ "Official 2007 NCAA Division I Football Record Book" (PDF). National Collegiate Athletic Association. August 2007. Archived from the original (PDF) on December 1, 2007. Retrieved January 3, 2008.
- ↑ "Louisiana-Lafayette 40, Louisiana-Monroe 24". ESPN.com. November 3, 2012.
- ↑ "Steven Artigue". ESPN.com. Retrieved December 18, 2016.
|
|---|
| Venues | |
|---|
| Bowls & rivalries | |
|---|
| Culture & lore | |
|---|
| People | |
|---|
| Seasons | |
|---|