List of most valuable crops and livestock products
The following list, derived from the statistics of the Food and Agriculture Organization (FAO) unless otherwise noted, lists the most important agricultural products produced by the countries of the world.[1]
The value and production of individual crops varies substantially from year to year as prices fluctuate on the world and country markets and weather and other factors influence production.
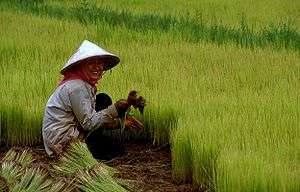
Rice in 2012 was the most valuable agricultural crop in the world. It was second to maize (corn) in the quantity produced of cereal products. This rice field is in Cambodia.
| Crop | Type | value in billion US dollars (2012) | production in metric tons (2011) | Top producing country and value billion US dollars (2012) |
|---|---|---|---|---|
| Rice, paddy | Cereals | $337 | 740,961,445 | $117 (Mainland China 2016 data |
| Cattle, meat | Livestock | $336 | 65,973,820 | $53 (United States)2016 data |
| Cow's milk, whole, fresh | Livestock Primary | $286 | 659,150,049 | $35 (United States) 2016 data |
| Pig, meat | Livestock | $167 | 108,641,257 | $77.9 (Mainland China) |
| Chicken, meat | Livestock | $128 | 90,001,779 | $24.4 (United States) |
| Wheat | Cereals | $84 | 701,395,334 | $13.7 (Mainland China) |
| Soybeans | $65 | 262,037,569 | $21.8 (United States) | |
| Tomatoes | $58 | 159,347,031 | $17.9 (Mainland China) | |
| Sugarcane | $57 | 1,800,377,642 | $23.9 (Brazil) | |
| Maize (Corn) | Cereals | $55 | 885,289,935 | $26.4 (United States) |
| Eggs, in shell | Livestock Primary | $54 | 65,181,280 | $19.8 (Mainland China) |
| Potatoes | $50 | 373,158,351 | $12.6 (Mainland China) | |
| Vegetables, not elsewhere specified | $46 | 268,833,780 | $25.3 (Mainland China) | |
| Grapes | Fruit | $39 | 69,093,293 | $5.2 (Mainland China) |
| Water Buffalo milk | Livestock | $38 | 95,888,113 | $26.0 (India) |
| Cotton, lint | $37 | 26,143,049 | $9.4 (Mainland China) | |
| Apples | Fruit | $32 | 75,484,671 | $15.2 (Mainland China) |
| Bananas | Fruit | $29 | 107,142,187 | $8.4 (India) |
| Cassava (yuca) | $25 | 256,404,044 | $5.5 (Nigeria) | |
| Mangos, Mangosteens, Guavas | Fruit | $23 | 38,953,166 | $9.1 (India) |
| Sheep, meat | Livestock | $22 | 8,229,068 | $5.6 (Mainland China) |
| Coffee | $22 | 8,034,000 | $10.0 (est)[2] (Brazil) | |
| Palm oil | $20 | 47,703,805 | $9.3 (Indonesia) | |
| Onions, dry | $18 | 86,343,822 | $5.2 (Mainland China) | |
| Beans, dry and green | Pulses | $17 | $6.2 (Mainland China) | |
| Peanuts, in shell | $17 | 40,016,584 | $7.0 (Mainland China) | |
| Olives | $16 | 20,545,421 | $6.3 (Spain) | |
| Rapeseed | $15 | $3.9 (Canada) | ||
| Almonds, in shell | Treenuts | $15 | 3,214,303 | $12.3 (United States) 2016 data |
| Walnuts, with shell | Treenuts | $14 | 3,747,549 | $7.7 (Mainland China) 2016 data |
| Chilis and peppers, green and dry | $13 | $7.5 (Mainland China) | ||
| Rubber | $13 | $3.8 (Thailand) | ||
| Tea | $12 | 4,520,000 | $4.1 (Mainland China) | |
| Oranges | Fruit | $12 | $3.8 (Brazil) | |
| Cucumbers | $12 | $9.1 (Mainland China) | ||
| Yams | $12 | $7.6 (Nigeria) | ||
| Peaches, nectarines | Fruit | $11 | $6.3 (Mainland China) | |
| Lettuce, Chicory | $11 | $6.3 (Mainland China) | ||
| Cacao (Chocolate) | $10 | 4,082,000 | $3.1 [3] (Republic of Côte d'Ivoire (Ivory Coast)) | |
| Goat, meat | Livestock | $10 | $4.5 (Mainland China) | |
| Sunflower seed | $10 | $2.5 (Russia) | ||
| Sugar beets | $10 | $1.6 (France) | ||
| Watermelons | Fruit | $10 | $7.4 (Mainland China) | |
| Buffalo, meat | Livestock | $9 | $4.0 (India) | |
| Asparagus | $7 | $6.6 (Mainland China) | ||
| Turkey, meat | Livestock | $7 | $3.4 (United States) | |
| Carrots, Turnips | $7 | $3.9 (Mainland China) | ||
| Duck, meat | Livestock | $7 | $4.6 (Mainland China) | |
| Coconuts | Treenuts | $6 | $1.9 (India) | |
| Tangerines | Citrus Fruit | $6 | $3.1 (Mainland China) | |
| Lemons, Limes | Citrus Fruit | $5 | $0.9 (Mainland China) | |
| Strawberries | Fruit | $5 | $1.8 (United States) | |
| Chestnut | Treenuts | $5 | 2,261,589 | $4,5 (Mainland China) 2016 data |
| Hazelnut, with shell | Treenuts | $2 | 743,455 | $1.5 (Turkey) 2016 data |
Source: Food and Agricultural Organization. https://web.archive.org/web/20110713020710/http://faostat.fao.org/site/339/default.aspx, accessed 2013, 2018, http://www.fao.org/faostat/en/#data/QV
References
- ↑ Source: Food and Agricultural Organization. "Archived copy". Archived from the original on 2011-07-13. Retrieved 2013-12-20. , accessed 13 Aug 2013
- ↑ International Coffee Organization http://www.ico.org/trade_e.asp, accessed 14 Aug 2013
- ↑ International Cacao Organization. http://www.icco.org/statistics/cocoa-prices/daily-prices.html, accessed 16 Aug 2013
| Gardening |  | |
|---|---|---|
| Types of gardens |
| |
| Horticulture | ||
| Organic | ||
| Plant protection | ||
| ||
This article is issued from
Wikipedia.
The text is licensed under Creative Commons - Attribution - Sharealike.
Additional terms may apply for the media files.