List of metropolitan areas in Asia
The Asian continent is one of the fastest-growing continents in the World, with increasing urbanisation and a high growth rate for cities. Tokyo in Japan is the world's largest metropolitan area by population.
The population of the given cities are obtained from five different sources:
- City Population
- Demographia (urban areas)
- United Nations World’s Cities in 2016 Booklet, whose data source is: “United Nations, Department of Economic and Social Affairs, Population Division (2014), World Urbanization Prospects: The 2014 Revision.”
- World Atlas
- National Official Estimate (NOE)
Out of these five sources, the highest estimate is shown in bold. The cities are ranked on the basis of their highest estimate of population. Some remarks:
- The official statistics for Chinese cities are for municipalities which usually extend well beyond the urban areas and comprise a substantial rural population. When such statistics exceed the estimated figures, as in the case if Chongqing, Wuhan and Shenyang, they are not taken into account.
- The figure for Shanghai from City Population includes the city of Suzhou (some 100 km or 62 miles northwest of Shanghai), which is not included in other estimates or in the official statistics and therefore is not taken into account.
- The figure for Guangzhou from City Population is for the urban population of the Guangdong province, also which includes the cities Shenzhen, Dongguan, Zhongshan, Jiangmen and Huizhou. The area has not yet been developed into a single metropolitan area and therefore this figure is not taken into account. Shenzhen and Dongguan are listed separately in this table.
- Demographia and world Atlas give figures for the contiguous cities of Quanzhou, Jinjiang and Shishi. City Population includes these three cities in its figures for Xiamen (population 4-4.8 million), giving a total population of 10,000,000. However, Xiamen is not actually contiguous with the three other cities and this statistic is not taken into account.
The table is color-coded to show which region of Asia each city is in. The color-code key is as follows:
With twenty cities, East Asia accounts for half of cities under this list, with China having the lion's share with fifteen cities, South Asia comes second with ten cities, seven of which are in India. Southeast Asia accounts for seven cities and West Asia with just three cities.
List
| Rank | Area | Image | Country | Metro Population (2017 est.)[1] |
Demographia (2017 est.)[2] |
UN WC (2016 est.)[3] |
World Atlas (2017 est.)[4] |
Official or Other |
Est. Year |
|---|---|---|---|---|---|---|---|---|---|
| 1 | Tokyo | 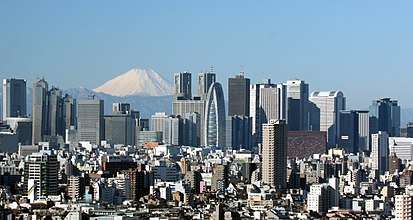 |
39,800,000 | 37,900,000 | 38,140,000[5] | 37,843,000 | 31,714,000[6] | 2005 | |
| 2 | Jakarta | 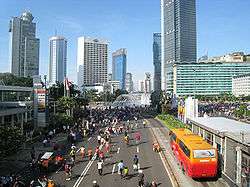 |
28,900,000 | 31,760,000 | 10,483,000[7] | 30,539,000 | 15,519,545 [8] | 2010 Census Final | |
| 3 | Delhi |  |
27,200,000 | 26,495,000 | 26, 454,000[9] | 24,998,000 | 11,034,555 [7][10] | 2011 | |
| 4 | Karachi |  |
25,100,000 | 23,545,000 | 17,121,000[7] | 22,123,000 | - | - | |
| 5 | Seoul | 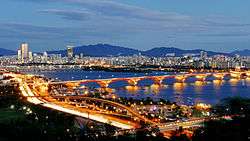 |
24,800,000 | 24,105,000 | Seoul 9,979,000[7] Incheon 2,711,000[7] | 23,480,000 | 24,272,000 [11] | 2007 | |
| 6 | Shanghai | 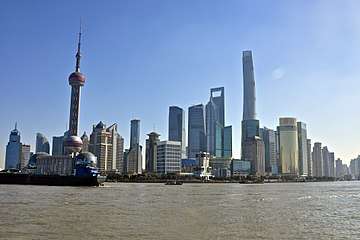 |
31,100,000[12] | 23,390,000 | 24,484,000[7] | 23,416,000 | 23,019,148[13] | 2010 | |
| 7 | Manila | 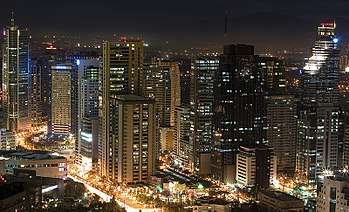 |
24,100,000 | 24,245,000 | 13,131,000[9] | 24,123,000 | 11,553,427[14] | 2007 | |
| 8 | Mumbai | 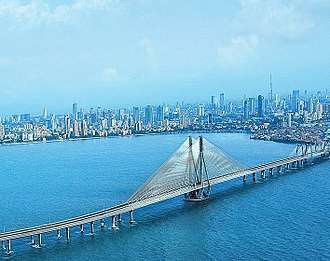 |
23,600,000 | 22,885,000 | 21,357,000[9] | 17,712,000 | 17,800,000[15] | 2001 | |
| 9 | Beijing | .jpg) |
20,700,000 | 20,415,000 | 21,240,000[9] | 21,009,000 | 19,612,368[16] | 2010 | |
| 10 | Guangzhou-Foshan |  |
48,600,000[17] | 19,075,000 | Guanzhou 13,070,000[9] Foshan 7,089,000[9] | 20,597,000 | 12,700,800[18] | - | |
| 11 | Osaka-Kobe-Kyoto | 17,800,000 | 17,075,000 | 20,337,000[5] | 17,440,000 | 16,663,000[6] | 2005 | ||
| 12 | Dhaka | 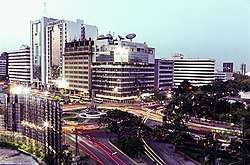 |
17,190,000 | 16,820,000 | 18,237,000[5] | 15,669,000 | 12,797,394[19] | 2008 | |
| 13 | Bangkok | 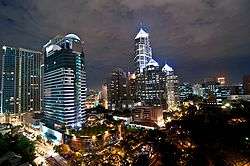 | 17,400,000 | 15,645,000 | 9,440,000[5] | 14,998,000 | 8,249,117 [20] | 2010 | |
| 14 | Kolkata | 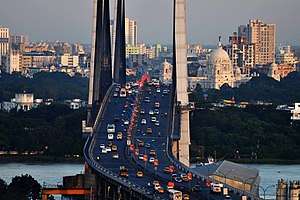 |
16,200,000 | 14,950,000 | 14,980,000[9] | 14,667,000 | - | - | |
| 15 | Tehran | 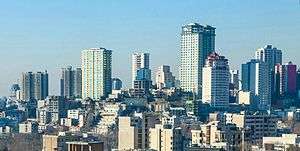 |
14,000,000 | 13,805,000 | 8,516,000[7] | 13,532,000 | 13,422,366[21] | 2006 | |
| 16 | Chongqing | 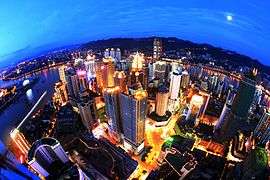 | 7,200,000 | 7,990,000 | 13,744,000[9] | 7,217,000 | 28,846,170[22][23] | 2010 | |
| 17 | Tianjin | 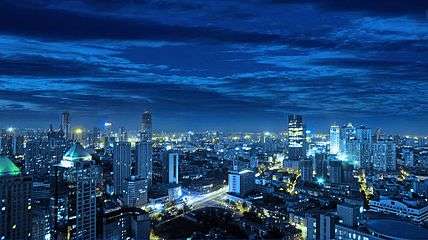 | 11,800,000 | 13,245,000 | 11,558,000[9] | 10,920,000 | 12,938,224[24] | - | |
| 18 | Shenzhen | 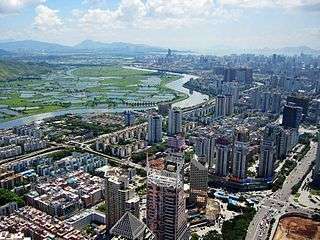 |
included in Guangzhou | 12,775,000 | 10,828,000 | 12,084,000[9] | 10,357,938[25] | - | |
| 19 | Chengdu | 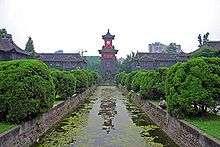 |
9,750,000 | 11,050,000 | 7,820,000[9] | 10,376,000 | - | - | |
| 20 | Bangalore | 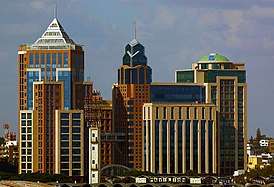 | 10,800,000 | 10,535,000 | 10,456,000[9] | 8,728,906 | 8,499,399 | 2011[26] | |
| 21 | Lahore | 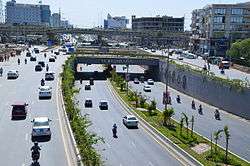 | 10,500,000 | 10,666,000 | 8,990,000[9] | 10,052,000 | - | - | |
| 22 | Nagoya | 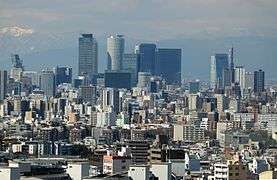 | 10,500,000 | 10,070,000 | 9,434,000[5] | 10,177,000 | 9,046,000[6] | 2005 | |
| 23 | Ho Chi Minh City | 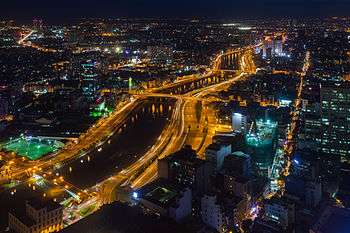 | 8,310,000 | 10,380,000 | 7,498,000[9] | 8,957,000 | 7,955,000 | 2014 | |
| 24 | Chennai | 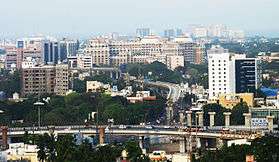 |
10,300,000 | 10,265,000 | 10,163,000[9] | 9,714,000 | 8,696,010 | 2011[26] | |
| 25 | Hyderabad | 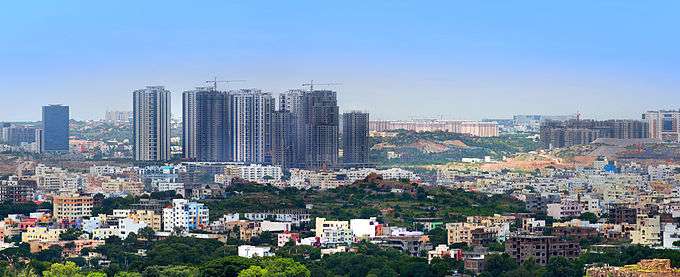 | 9,200,000 | 9,305,000 | 9,218,000[9] | 8,754,000 | - | - | |
| 26 | Taipei | 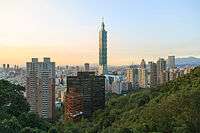 | 9,050,000 | 8,550,000 | 2,669,000[9] | 7,438,000 | 8,916,653 [21] | 2010 | |
| 27 | Hangzhou |  |
8,450,000 | 6,820,000 | - | 7,275,000 | - | - | |
| 28 | Dongguan | 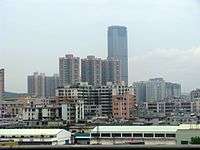 |
Included in Guangzhou | 8,310,000 | 7,469,000[9] | 8,442,000 | - | - | |
| 29 | Wuhan | 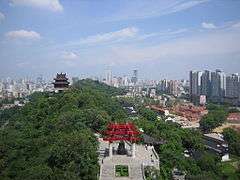 | 8,100,000 | 7,895,000 | 7,979,000[9] | 7,509,000 | 9,785,392[27][28] | - | |
| 30 | Shenyang | .jpg) | 7,800,000 | 7,935,000 | 6,438,000[9] | 6,078,000 | 8,106,171[29] | - | |
| 31 | Hanoi |  |
3,450,000 | 7,785,000 | 3,790,000[9] | 3,715,000 | - | - | |
| 32 | Ahmedabad | 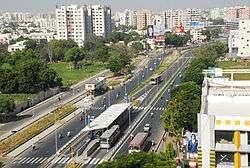 | 7,650,000 | 7,645,000 | 7,571,000[9] | 7,186,000 | - | - | |
| 33 | Kuala Lumpur | 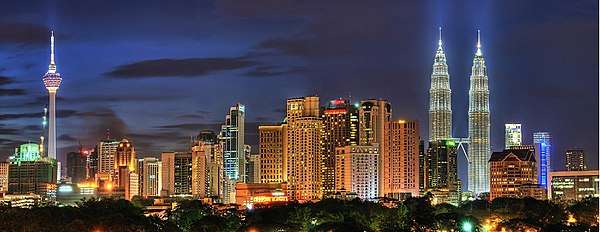 | 6,800,000 | 7,590,000 | 7,047,000[9] | 7,088,000 | 1,768.00 [30][31] | 2015 | |
| 34 | Hong Kong | 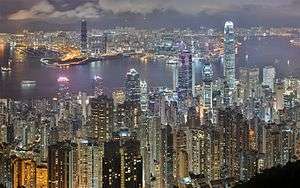 | 7,300,000 | 7,330,000 | - | 7,246,000[9] | 7,246,000 | - | |
| 35 | Nanjing | 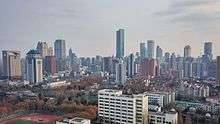 |
7,050,000 | 6,320,000 | - | 6,155,000 | - | - | |
| 36 | Zhengzhou-Xingyang | 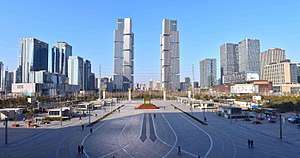 |
4,800,000 | 7,005,000 | 4,539,000[9] | 4,942,000 | - | - | |
| 37 | Baghdad | 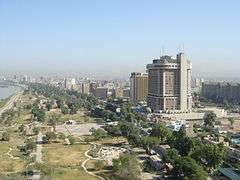 |
Iraq | 7,000,000 | 6,960,000 | 6,811,000[9] | 6,625,000 | - | - |
| 38 | Singapore |  |
Singapore | 6,950,000 | 5,825,000 | 5,717,000[9] | 5,624,000 | 5,607,300 [32] | 2017 |
| 39 | Riyadh | _and_the_famous_Kingdom_Tower_.jpg) |
Saudi Arabia | 6,900,000 | 6,030,000 | 6,540,000[7] | 5,666,000 | 6,506,000 | 2014 |
| 40 | Quanzhou-Shishi-Jinjiang | 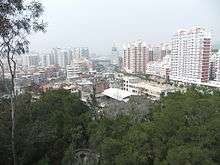 |
Included in Xiamen [33] | 6,480,000 | 1,469,000[9] | 6,710,000 | - | - |
See also
References
- ↑ Brinkhoff, Thomas. "The Principal Agglomerations of the World". CityPopulation. Retrieved 2017-08-02.
- ↑ "Demographia World Urban Areas 13 Th Annual Edition: 2017:04" (PDF). Retrieved 2017-08-02.
- ↑ "World cities in 2016: Data Booklet" (PDF). The United Nations: Population Division. Retrieved 2017-08-02.
- ↑ "World's Largest Cities". Archived from the original on 28 August 2017. Retrieved 2017-08-02.
- 1 2 3 4 5 Metropolitan Area
- 1 2 3 "Table 2.10 Population of Three Major Metropolitan Areas" (PDF). Ministry of Internal Affairs and Communications (Japan). Archived from the original (PDF) on 2009-11-13. Retrieved 2009-11-07.
- 1 2 3 4 5 6 7 8 City proper
- ↑ "Archived copy". Archived from the original on 2010-10-13. Retrieved 2010-10-13. BPS:Hari Statistik Nasional Sensus Penduduk 2010 (Official 2010 Census Figures), Summed from definition
- 1 2 3 4 5 6 7 8 9 10 11 12 13 14 15 16 17 18 19 20 21 22 23 24 25 26 27 28 Urban Agglomeration
- ↑ Delhi census
- ↑ "Seoul National Capital Area Statistics" (in Korean). Korean National Statistical Office. Retrieved 2009-11-06.
- ↑ Figure includes the city of Suzhou, which is not included in other estimates or in the official statistics
- ↑ "Shanghai sixth national census in 2010 Communiqué on Major Data, Chinese: 上海市2010年第六次全国人口普查主要数据公报". Shanghai Municipal Statistics Bureau. 3 May 2011. Archived from the original on 26 November 2011. Retrieved 16 August 2011.
- ↑ "Metro Manila at a glance". Metropolitan Manila Development Authority. Retrieved 2009-08-25.
- ↑ "Basic Statistics for Mumbai". MMRDA: Mumbai Metropolitan Region Development Authority. Retrieved 2009-11-07.
- ↑ "Communiqué of the National Bureau of Statistics of People's Republic of China on Major Figures of the 2010 Population Census". National Bureau of Statistics of China. Archived from the original on 2013-07-27.
- ↑ This figure is for the urban population of the Guangdong province, which includes Shenzhen, Dongguan, Zhongshan, Jiangmen, and Huizhou, which has not yet been developed into a single metropolitan area
- ↑ 广州市2010年第六次全国人口普查主要数据公报 (in Chinese). Statistics Bureau of Guangzhou. 2011-05-16. Archived from the original on 2011-07-20. Retrieved 2011-05-25.
- ↑ "Statistical Pocket Book, 2008" (PDF). Bangladesh Bureau of Statistics. Archived from the original (pdf) on 2009-04-19. Retrieved 2009-08-28.
- ↑ National Statistical Office of Thailand
- 1 2 "Monthly Bulletin of Interior Statistics 2011.4". Department of Statistics, Ministry of the Interior, Taiwan/R.O.C. Archived from the original on 2014-03-29.
- ↑ 2010 Census
- ↑ Figure for the municipality which extend well beyond the urban area (31,816 sq mi)
- ↑ "Communiqué of the National Bureau of Statistics of People's Republic of China on Major Figures of the 2010 Population Census[1] (No. 2)". National Bureau of Statistics of China. 29 April 2011. Archived from the original on 27 July 2013. Retrieved 18 November 2011.
- ↑ 深圳市2010年第六次全国人口普查主要数据公报[1] (in Chinese). Shenzhen Municipal Statistic Bureau. 2014-05-12. Archived from the original on 2011-08-04. Retrieved 2011-07-28.
- 1 2 http://www.censusindia.gov.in/2011-prov-results/paper2/data_files/India2/Table_3_PR_UA_Citiees_1Lakh_and_Above.pdf
- ↑ "武汉市2010年第六次全国人口普查主要数据公报". Wuhan Statistics Bureau. 10 May 2011. Archived from the original on 25 October 2011. Retrieved 31 July 2011.
- ↑ Figure for the municipality which extend well beyond the urban area (3,279.71 sq mi)
- ↑ "武汉市2010年第六次全国人口普查主要数据公报". Shenyang Statistics Bureau. 20 May 2011. Retrieved 18 November 2011.
- ↑ Federal Territory of Kuala Lumpur
- ↑ Population projections for 2015
- ↑ Statistic Singapore retrieved 2014/08/02
- ↑ City Population includes these three cities in its figures for Xiamen (population 4-4.8 million), giving a total population of 10,000,000. However Xiamen is not actually contiguous