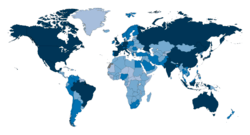
List of continents by GDP (nominal)
Legend: (in billions of U.S. dollars)
This article includes a list of continents of the world sorted by their gross domestic product (GDP), the market value of all final goods and services from a continent in a given year. The GDP dollar estimates presented here are calculated at market or government official exchange rates.
The figures presented here do not take into account differences in the cost of living in different countries, and the results can vary greatly from one year to another based on fluctuations in the exchange rates of the country's currency. Such fluctuations may change a continents ranking from one year to the next, even though they often make little or no difference to the standard of living of its population. Therefore, these figures should be used with caution.
Comparisons of national wealth are also frequently made on the basis of purchasing power parity (PPP), to adjust for differences in the cost of living in different countries. (See List of countries by GDP (PPP).) PPP largely removes the exchange rate problem, but has its own drawbacks; it does not reflect the value of economic output in international trade, and it also requires more estimation than GDP per capita. On the whole, PPP per capita figures are more narrowly spread than nominal GDP per capita figures.
GDP (nominal) by continents
The following lists summarise the GDP (nominal) of each continent by adding GDP (nominal) of each nations within the seven continent model, sorted by USD. The first list includes 2016 data estimatesn1 for members of the International Monetary Fund. The second list shows the World Bank's mostly 2010 estimates, and the third list includes mostly 2010 estimates from the CIA World Factbook.
In these lists, the sovereign states and dependent territories are classified according to the geoscheme created by the United Nations Statistics Division.[1] According to the UN, the assignment of countries or areas to specific groupings is for statistical convenience and does not imply any assumption regarding political or other affiliation of countries or territories.[2]
For more information please see List of sovereign states and dependent territories by continent.
| List by the International Monetary Fund (2018)[3] | List by the World Bank (1990-2010)[4] | List by the CIA World Factbook (2000-2010)[5] | ||||||||||||||||||||||||||||||||||||||||||||||||||||||||||||||||||||||||||||||||||||||||||||||||||||||||||||
|
|
| ||||||||||||||||||||||||||||||||||||||||||||||||||||||||||||||||||||||||||||||||||||||||||||||||||||||||||||
GDP per capita (nominal) by continents
| List by the International Monetary Fund (2018)[6][7] | List by the World Bank (1990-2010)[4] | List by the CIA World Factbook (2000-2010)[5] | ||||||||||||||||||||||||||||||||||||||||||||||||||||||||||||||||||||||||||||||||||||||||||||||||||||||||||||
|
|
| ||||||||||||||||||||||||||||||||||||||||||||||||||||||||||||||||||||||||||||||||||||||||||||||||||||||||||||
Notes
- 1. ^ Estimated by IMF staff.
- 2. ^ Figures exclude Taiwan, and special administrative regions of Hong Kong and Macau.
- 3. ^ The Eurozone in 2010 was 16 of 27 European Union countries: Austria, Belgium, Cyprus, Finland, France, Germany, Greece, Ireland, Italy, Luxembourg, Malta, Netherlands, Portugal, Slovakia, Slovenia and Spain.
- 4. ^ Data include the French overseas departments of French Guiana, Guadeloupe, Martinique, and Réunion.
- 5. ^ Excludes Kosovo.
- 6. ^ Hyperinflation and the plunging value of the Zimbabwean dollar makes Zimbabwe's nominal GDP a highly inaccurate statistic.
- 7. ^ Excludes data for Transnistria.
- 8. ^ Includes Former Spanish Sahara.
- 9. ^ Data are for the area controlled by the Government of the Republic of Cyprus.
- 10. ^ Covers mainland Tanzania only.
- 11. ^ Excludes Abkhazia and South Ossetia.
References
- ↑ "Composition of macro geographical (continental) regions, geographical sub-regions, and selected economic and other groupings". United Nations Statistics Division.
- ↑ "Standard country or area codes and geographical regions for statistical use". United Nations Statistics Division.
- ↑ "IMF DataMapper". International Monetary Fund. International Monetary Fund. Retrieved 9 October 2018.
- 1 2 Data refer mostly to the year 2010. World Development Indicators database, World Bank. Accessed on 29 September 2011.
- 1 2 Field listing - GDP (official exchange rate), CIA World Factbook. Accessed on 26 September 2011.
- ↑ International Monetary Fund (2018). "Nominal GDP per capita". IMF Data Mapper. International Monetary Fund. Retrieved 9 October 2018.
- ↑ International Monetary Fund (October 2016). "World Economic Outlook". International Monetary Fund. Retrieved February 22, 2017.