Ionogram
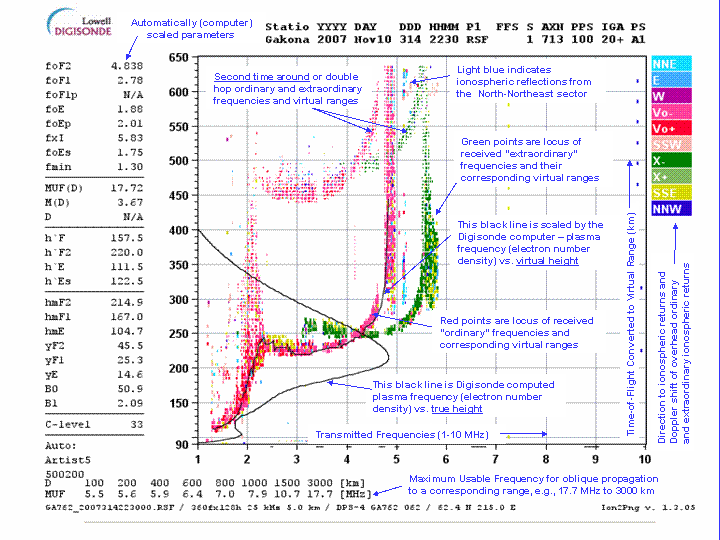
An ionogram is a display of the data produced by an ionosonde. It is a graph of the virtual height of the ionosphere plotted against frequency. Ionograms are often converted into electron density profiles. Data from ionograms may be used to measure changes in the Earth's ionosphere due to space weather events.
Description
See also
Further reading
- http://www.ngdc.noaa.gov/stp/IONO/ionogram.html National Geophysical Data Center
- F.C. Judd, G2BCX (1987). Radio Wave Propagation (HF Bands). London: Heinemann. pp. 27–37. ISBN 978-0-434-90926-1.
- Gwyn Williams, G4FKH (May 2009). "Interpreting Digital Ionograms". RadCom. 85 (5): 44–46.
This article is issued from
Wikipedia.
The text is licensed under Creative Commons - Attribution - Sharealike.
Additional terms may apply for the media files.