Intermittent energy source
.jpg)
An intermittent energy source is any source of energy that is not continuously available for conversion into electricity and outside direct control because the used primary energy cannot be stored. Intermittent energy sources may be predictable but cannot be dispatched to meet the demand of an electric power system.
The use of intermittent sources in an electric power system usually displaces storable primary energy that would otherwise be consumed by other power stations. Another option is to store electricity generated by non-dispatchable energy sources for later use when needed, e.g. in the form of pumped storage, compressed air or in batteries. A third option is the sector coupling e.g. by electric heating for district heating schemes.
The use of small amounts of intermittent power has little effect on grid operations. Using larger amounts of intermittent power may require upgrades or even a redesign of the grid infrastructure.[5][6]
Terminology
Several key terms are useful for understanding the issue of intermittent power sources. These terms are not standardized, and variations may be used. Most of these terms also apply to traditional power plants.
- Intermittency can mean the extent to which a power source is unintentionally stopped or unavailable, but intermittency is frequently used as synonym of variability,[7][8] which is the extent to which a power source may exhibit changes in output.[7]
- Dispatchability or maneuverability is the ability of a given power source to increase and decrease output quickly on demand. The concept is distinct from intermittency; dispatchability is one of several ways system operators match supply (generator's output) to system demand (technical loads).[8]
- Penetration in this context is generally used to refer to the amount of energy generated as a percentage of annual consumption.[9]
- Nominal power or nameplate capacity refers to the maximum output of a generating plant in normal operating conditions. This is the most common number used and typically expressed in multiplies of Watt.
- Capacity factor, average capacity factor, or load factor is the average expected output of a generator, usually over an annual period. Expressed as a percentage of the nameplate capacity or in decimal form (e.g. 30% or 0.30).
- Capacity credit: generally the amount of output from a power source that may be statistically relied upon, practically the minimum power within a longer period, usually expressed as a percentage of the nominal power.[10]
- Firm capacity the amount of power that can be guaranteed to be provided as base power
- Non-firm capacity the amount of power above the firm capacity that is usually to be sold at higher price on the spot market
Intermittency of various power sources
Solar energy
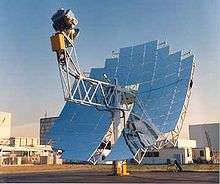
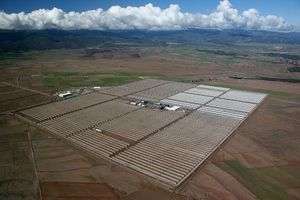
Intermittency inherently affects solar energy, as the production of renewable electricity from solar sources depends on the amount of sunlight at a given place and time. Solar output varies throughout the day and through the seasons, and is affected by dust, fog, cloud cover, frost or snow. Many of the seasonal factors are fairly predictable, and some solar thermal systems make use of heat storage to produce grid power for a full day.[11]
- Intermittency: In the absence of an energy storage system, solar does not produce power at night or in bad weather and varies between summer and winter. When intended to produce electricity only for peak air conditioning loads in the summer, there is no intermittency; in the winter can be complemented with wind power for peak loads.
- Capacity factor Photovoltaic solar in Massachusetts 12–15%.[12] Photovoltaic solar in Arizona 19%.[13] Thermal solar parabolic trough with storage 56%.[14] Thermal solar power tower with storage 73%.[14]
The impact of intermittency of solar-generated electricity will depend on the correlation of generation with demand. For example, solar thermal power plants such as Nevada Solar One are somewhat matched to summer peak loads in areas with significant cooling demands, such as the south-western United States. Thermal energy storage systems like the small Spanish Gemasolar Thermosolar Plant can improve the match between solar supply and local consumption. The improved capacity factor using thermal storage represents a decrease in maximum capacity, and extends the total time the system generates power.[15][16][17]
Wind energy
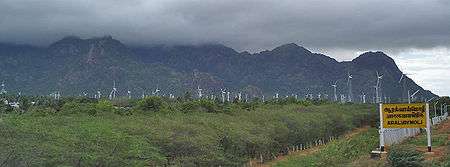
Wind-generated power is a variable resource, and the amount of electricity produced at any given point in time by a given plant will depend on wind speeds, air density, and turbine characteristics (among other factors). If wind speed is too low (less than about 2.5 m/s) then the wind turbines will not be able to make electricity, and if it is too high (more than about 25 m/s) the turbines will have to be shut down to avoid damage. While the output from a single turbine can vary greatly and rapidly as local wind speeds vary, as more turbines are connected over larger and larger areas the average power output becomes less variable.[18][19][20][21]
- Intermittence: Regions smaller than synoptic scale (the size of an average country) have mostly the same weather and thus around the same wind power, unless local conditions favor special winds. Some studies show that wind farms spread over a geographically diverse area will as a whole rarely stop producing power altogether.[19][20] However this is rarely the case for smaller areas with uniform geography such as Ireland,[22][23][24] Scotland[25] and Denmark which have several days per year with little wind power.[26]
- Capacity Factor: Wind power typically has a capacity factor of 20-40%.[12][27]
- Dispatchability: Wind power is "highly non-dispatchable".[28] MISO, which operates a large section of the U.S. grid, has over 13,000 MW of wind power under its control and is able to manage this large amount of wind power by operating it as dispatchable intermittent resources.[29]
- Capacity Credit: At low levels of penetration, the capacity credit of wind is about the same as the capacity factor. As the concentration of wind power on the grid rises, the capacity credit percentage drops.[27][30]
- Variability: Site dependent.[31] Sea breezes are much more constant than land breezes.[18] Seasonal variability may reduce output by 50%.[32]
- Reliability: A wind farm has high technical reliability when the wind blows. That is, the output at any given time will only vary gradually due to falling wind speeds or storms (the latter necessitating shut downs). A typical wind farm is unlikely to have to shut down in less than half an hour at the extreme, whereas an equivalent sized power station can fail totally instantaneously and without warning. The total shut down of wind turbines is predictable via weather forecasting. The average availability of a wind turbine is 98%, and when a turbine fails or is shutdown for maintenance it only affects a small percentage of the output of a large wind farm.[33]
- Predictability: Although wind is variable, it is also predictable in the short term. There is an 80% chance that wind output will change less than 10% in an hour and a 40% chance that it will change 10% or more in 5 hours. Predictability increases as weather forecasts become better.[34]
According to a 2007 study of wind in the United States, ten or more widely separated wind farms connected through the grid could be relied upon for from 33 to 47% of their average output (15–20% of nominal capacity) as reliable, baseload power, as long as minimum criteria are met for wind speed and turbine height.[19][20] When calculating the generating capacity available to meet summer peak demand, ERCOT (manages Texas grid) counts wind generation at 8.7% of nameplate capacity.[35]
Wind generates about 16% (EWEA – 2011 European Statistics, February 2012) of electric energy in Spain and Portugal,[36] 9% in Ireland,[36] and 7% in Germany.[37] Wind provides around 40% of the annual electricity generated in Denmark[38] (up from 20% in 2005);[39][40] to meet this percentage Denmark exports surpluses and imports during shortfalls to and from the EU grid, particularly Norwegian Hydro, to balance supply with demand.[41]
Because wind power is generated by large numbers of small generators, individual failures do not have large impacts on power grids. This feature of wind has been referred to as resiliency.[42]
Wind power is affected by air temperature because colder air is more dense and therefore more effective at producing wind power. As a result, wind power is affected seasonally (more output in winter than summer) and by daily temperature variations. During the 2006 California heat wave output from wind power in California significantly decreased to an average of 4% of capacity for seven days.[43] A similar result was seen during the 2003 European heat wave, when the output of wind power in France, Germany, and Spain fell below 10% during peak demand times.[44] Heat waves are partially caused by large amounts of solar radiation.
According to an article in EnergyPulse, "the development and expansion of well-functioning day-ahead and real time markets will provide an effective means of dealing with the variability of wind generation."[45]
Nuclear power
Several authors have said that no energy resource is totally reliable. Amory Lovins says that nuclear power plants are intermittent in that they will sometimes fail unexpectedly, often for long periods of time.[46] For example, in the United States, 132 nuclear plants were built, and 21% were permanently and prematurely closed due to reliability or cost problems, while another 27% have at least once completely failed for a year or more. The remaining U.S. nuclear plants produce approximately 90% of their full-time full-load potential, but even they must shut down (on average) for 39 days every 17 months for scheduled refueling and maintenance.[46] To cope with such intermittence by nuclear (and centralized fossil-fuelled) power plants, utilities install a "reserve margin" of roughly 15% extra capacity spinning ready for instant use.[46]
Solving intermittency
The penetration of intermittent renewables in most power grids is low, global electricity production in 2014 was supplied by 3.1% wind, and 1% solar.[47] Wind generates roughly 16% of electric energy in Spain and Portugal,[36] 15.3% in Ireland,[48] and 7% in Germany.[37] As of 2014, wind provides 39% of the electricity generated in Denmark.[49][50][51] To operate with this level of penetration, Denmark exports surpluses and imports during shortfalls to and from neighbouring countries, particularly hydroelectric power from Norway, to balance supply with demand.[41] It also uses large numbers of combined heat and power (CHP) stations which can rapidly adjust output.[52]
The intermittency and variability of renewable energy sources can be reduced and accommodated by diversifying their technology type and geographical location, forecasting their variation, and integrating them with dispatchable renewables (such as hydropower, geothermal, and biomass). Combining this with energy storage and demand response can create a power system that can reliably match real-time energy demand.[53] The integration of ever-higher levels of renewables has already been successfully demonstrated:[54][55]
In 2009, eight American and three European authorities, writing in the leading electrical engineers' professional journal, didn't find "a credible and firm technical limit to the amount of wind energy that can be accommodated by electricity grids". In Fact, not one of more than 200 international studies, nor official studies for the eastern and western U.S. regions, nor the International Energy Agency, has found major costs or technical barriers to reliably integrating up to 30% variable renewable supplies into the grid, and in some studies much more.[55]
A research group at Harvard University quantified the meteorologically defined limits to reduction in the variability of outputs from a coupled wind farm system in the Central US:
The problem with the output from a single wind farm located in any particular region is that it is variable on time scales ranging from minutes to days posing difficulties for incorporating relevant outputs into an integrated power system. The high frequency (shorter than once per day) variability of contributions from individual wind farms is determined mainly by locally generated small scale boundary layer. The low frequency variability (longer than once per day) is associated with the passage of transient waves in the atmosphere with a characteristic time scale of several days. The high frequency variability of wind-generated power can be significantly reduced by coupling outputs from 5 to 10 wind farms distributed uniformly over a ten state region of the Central US. More than 95% of the remaining variability of the coupled system is concentrated at time scales longer than a day, allowing operators to take advantage of multi-day weather forecasts in scheduling projected contributions from wind.[56]
Mark Z. Jacobson has studied how wind, water and solar technologies can be integrated to provide the majority of the world's energy needs.[57] He advocates a "smart mix" of renewable energy sources to reliably meet electricity demand:
Because the wind blows during stormy conditions when the sun does not shine and the sun often shines on calm days with little wind, combining wind and solar can go a long way toward meeting demand, especially when geothermal provides a steady base and hydroelectric can be called on to fill in the gaps.[58]
Mark A. Delucchi and Mark Z. Jacobson argue that there are at least seven ways to design and operate renewable energy systems so that they will reliably satisfy electricity demand:[59]
- Interconnect geographically dispersed, technologically diverse renewable generation types (such as wind, solar, and tidal) to smooth out daily supply variability. For example, solar power generation is highest at midday, and wind is often strongest at night and early morning. The combined solar-wind resource has lower variance than either individual source.
- Use dispatchable renewable energy generators (such as hydroelectric, geothermal, and biomass) to fill energy deficits between demand and intermittent resource generation.
- Use demand response (or demand-side management) to shift flexible loads to a time when more renewable energy is available, and away from times when renewable generation is low. This requires that loads be capable of receiving and responding to price or control signals from the local utility or grid operator.
- Store excess renewable power, which would otherwise be curtailed, for later use at times when generation is not sufficient to meet load. Some energy storage technology types include pumped hydro, electrochemical batteries, flywheels, compressed air, and hydrogen. These energy storage resources can be located near intermittent generation, “behind the meter” at homes and business, or at any other point on the electric grid. Customer-sited storage is typically used to increase self-consumption of distributed energy resources such as photovoltaic panels, to shift grid power consumption towards off-peak hours, and to reduce demand charges. Grid-scale storage is typically used to provide ancillary services to the grid, such as frequency regulation, synchronous “spinning” reserve capacity, and load-following.
- Over-size renewable peak generation capacity to minimize the times when available renewable power is less than demand, and to provide spare power to produce hydrogen for flexible transportation and heat uses.
- Use electric vehicles as an additional storage resource. The first generation of this technology, known as V1G (unidirectional managed charging), involves “smart charging” at times when the grid can accommodate additional load, with power only flowing into the vehicle. A further development, known as V2B (vehicle-to-building), sees bidirectional power flow into the vehicle at optimal times, and out of the vehicle to meet building demand. The most advanced form, known as V2G (Vehicle-to-grid), sees power exported from the EV back on to the grid when needed.
- Forecast the weather (winds, sunlight, waves, tides and precipitation) to better plan for energy supply needs.[59]
Technological solutions to mitigate large-scale wind energy type intermittency exist such as increased interconnection (the European super grid), Demand response, load management, diesel generators (in the British National Grid, Frequency Response / National Grid Reserve Service type schemes, and use of existing power stations on standby. Studies by academics and grid operators indicate that the cost of compensating for intermittency is expected to be high at levels of penetration above the low levels currently in use today[60][61][62] Large, distributed power grids are better able to deal with high levels of penetration than small, isolated grids. For a hypothetical European-wide power grid, analysis has shown that wind energy penetration levels as high as 70% are viable,[63] and that the cost of the extra transmission lines would be only around 10% of the turbine cost, yielding power at around present day prices.[64] Smaller grids may be less tolerant to high levels of penetration.[5][65]
Matching power demand to supply is not a problem specific to intermittent power sources. Existing power grids already contain elements of uncertainty including sudden and large changes in demand and unforeseen power plant failures. Though power grids are already designed to have some capacity in excess of projected peak demand to deal with these problems, significant upgrades may be required to accommodate large amounts of intermittent power. The International Energy Agency (IEA) states: "In the case of wind power, operational reserve is the additional generating reserve needed to ensure that differences between forecast and actual volumes of generation and demand can be met. Again, it has to be noted that already significant amounts of this reserve are operating on the grid due to the general safety and quality demands of the grid. Wind imposes additional demands only inasmuch as it increases variability and unpredictability. However, these factors are nothing completely new to system operators. By adding another variable, wind power changes the degree of uncertainty, but not the kind..."[18]
With sufficient energy storage, highly variable and intermittent sources can supply all of a regions electrical power. For solar to provide half of all electricity and using a solar capacity factor of 20%, the total capacity for solar would be 250% of the grids average daily load. For wind to provide half of all electricity and using a wind capacity factor of 30% the total capacity for wind would be 160% of the grids average daily load.
A pumped storage facility would then store enough water for the grids weekly load, with a capacity for peak demand i.e.:200% of the grid average. This would allow for one week of overcast and windless conditions. There are unusual costs associated with building storage and total generating capacity being six times the grid average.
Compensating for variability
All sources of electrical power have some degree of variability, as do demand patterns which routinely drive large swings in the amount of electricity that suppliers feed into the grid. Wherever possible, grid operations procedures are designed to match supply with demand at high levels of reliability, and the tools to influence supply and demand are well-developed. The introduction of large amounts of highly variable power generation may require changes to existing procedures and additional investments.
The capacity of a reliable renewable power supply, can be fulfilled by the use of backup or extra infrastructure and technology, using mixed renewables to produce electricity above the intermittent average, which may be used to meet regular and unanticipated supply demands.[66] Additionally, the storage of energy to fill the shortfall intermittency or for emergencies can be part of a reliable power supply.
Operational reserve
All managed grids already have existing operational and "spinning" reserve to compensate for existing uncertainties in the power grid. The addition of intermittent resources such as wind does not require 100% "back-up" because operating reserves and balancing requirements are calculated on a system-wide basis, and not dedicated to a specific generating plant.
- Some coal, gas, or hydro power plants are partially loaded and then controlled to change as demand changes or to replace rapidly lost generation. The ability to change as demand changes is termed "response." The ability to quickly replace lost generation, typically within timescales of 30 seconds to 30 minutes, is termed "spinning reserve."
- Generally thermal plants running as peaking plants will be less efficient than if they were running as base load.
- Hydroelectric facilities with storage capacity (such as the traditional dam configuration) may be operated as base load or peaking plants.
- In practice, as the power output from wind varies, partially loaded conventional plants, which are already present to provide response and reserve, adjust their output to compensate.
- While low penetrations of intermittent power may use existing levels of response and spinning reserve, the larger overall variations at higher penetrations levels will require additional reserves or other means of compensation.
Demand reduction or increase
- Demand response refers to the use of communication and switching devices which can release deferrable loads quickly, or absorb additional energy to correct supply/demand imbalances. Incentives have been widely created in the American, British and French systems for the use of these systems, such as favorable rates or capital cost assistance, encouraging consumers with large loads to take them off line or to start diesels whenever there is a shortage of capacity, or conversely to increase load when there is a surplus.
- Certain types of load control allow the power company to turn loads off remotely if insufficient power is available. In France large users such as CERN cut power usage as required by the System Operator - EDF under the encouragement of the EJP tariff.[67][68]
- Energy demand management refers to incentives to adjust use of electricity, such as higher rates during peak hours.
- Real-time variable electricity pricing can encourage users to adjust usage to take advantage of periods when power is cheaply available and avoid periods when it is more scarce and expensive.[69]
- Instantaneous demand reduction. Most large systems also have a category of loads which instantly disconnect when there is a generation shortage, under some mutually beneficial contract. This can give instant load reductions (or increases). See National Grid Reserve Service
- Diesel generators, originally or primarily installed for emergency power supply are often also connected to the National Grid in the UK to help deal with short term demand supply mismatches.[70]
Storage and demand loading
At times of low load where non-dispatchable output from wind and solar may be high, grid stability requires lowering the output of various dispatchable generating sources or even increasing controllable loads, possibly by using energy storage to time-shift output to times of higher demand. Such mechanisms can include:
- Pumped storage hydropower is the most prevalent existing technology used, and can substantially improve the economics of wind power. The availability of hydropower sites suitable for storage will vary from grid to grid. Typical round trip efficiency is 80%.[18][71]
- Thermal energy storage stores heat. Stored heat can be used directly for heating needs or converted into electricity. In the context of a CHP plant a heat storage can serve as a functional electricity storage at comparably low costs.
- Ice storage air conditioning Ice can be stored inter seasonally and can be used as a source of air-conditioning during periods of high demand. Present systems only need to store ice for a few hours but are well developed.
- Hydrogen can be created through electrolysis and stored for later use. NREL found that a kilogram of hydrogen (roughly equivalent to a gallon of gasoline) could be produced for between US$5.55 in the near term and $2.27 in the long term.[72]
- Rechargeable flow batteries can serve as a large capacity, rapid-response storage medium.[8]
- Traditional lithium-ion batteries have a large environmental footprint, but new technologies such as air-breathing batteries could provide an enviro-friendly solution to renewable energy storage.[73]
- Some loads such as desalination plants, electric boilers and industrial refrigeration units, are able to store their output (water and heat). These "opportunistic loads" are able to take advantage of "burst electricity" when it is available.
- Various other potential applications are being considered, such as charging plug-in electric vehicles during periods of low demand and high production; such technologies are not widely used at this time.
Storage of electrical energy results in some lost energy because storage and retrieval are not perfectly efficient. Storage may also require substantial capital investment and space for storage facilities.
Geographic diversity
The variability of production from a single wind turbine can be high. Combining any additional number of turbines (for example, in a wind farm) results in lower statistical variation, as long as the correlation between the output of each turbine is imperfect, and the correlations are always imperfect due to the distance between each turbine. Similarly, geographically distant wind turbines or wind farms have lower correlations, reducing overall variability. Since wind power is dependent on weather systems, there is a limit to the benefit of this geographic diversity for any power system.[74]
Multiple wind farms spread over a wide geographic area and gridded together produce power more constantly and with less variability than smaller installations. Wind output can be predicted with some degree of confidence using weather forecasts, especially from large numbers of turbines/farms. The ability to predict wind output is expected to increase over time as data is collected, especially from newer facilities.[74]
Complementary power sources and matching demand
In the past electrical generation was mostly dispatchable and consumer demand led how much and when to dispatch power. The trend in adding intermittent sources such as wind, solar, and run-of-river hydro means the grid is beginning to be led by the intermittent supply. The use of intermittent sources relies on electric power grids that are carefully managed, for instance using highly dispatchable generation that is able to shut itself down whenever an intermittent source starts to generate power, and to successfully startup without warning when the intermittents stop generating.[75] Ideally the capacity of the intermittents would grow to be larger than consumer demand for periods of time, creating excess low price electricity to displace heating fuels or be converted to mechanical or chemical storage for later use.
The displaced dispatchable generation could be coal, natural gas, biomass, nuclear, geothermal or storage hydro. Rather than starting and stopping nuclear or geothermal it is cheaper to use them as constant base load power. Any power generated in excess of demand can displace heating fuels, be converted to storage or sold to another grid. Biofuels and conventional hydro can be saved for later when intermittents are not generating power. Alternatives to burning coal and natural gas which produce fewer greenhouse gases may eventually make fossil fuels a stranded asset that is left in the ground. Highly integrated grids favor flexibility and performance over cost, resulting in more plants that operate for fewer hours and lower capacity factors.[76]
- Electricity produced from solar energy tends to counterbalance the fluctuating supplies generated from wind. Normally it is windiest at night and during cloudy or stormy weather, and there is more sunshine on clear days with less wind.[77] Besides, wind energy has often a peak in the winter season, whereas solar energy has a peak in the summer season; the combination of wind and solar reduces the need for dispatchable backup power.
- In some locations, electricity demand may have a high correlation with wind output, particularly in locations where cold temperatures drive electric consumption (as cold air is denser and carries more energy).
- Intermittent solar electricity generation has a direct correlation where hot sunny weather drives high cooling demands. This is an ideal relationship between intermittent energy and demand.
- The allowable penetration may be increased with further investment in standby generation. For instance some days could produce 80% intermittent wind and on the many windless days substitute 80% dispatchable power like natural gas, biomass and Hydro.
- Areas with existing high levels of hydroelectric generation may ramp up or down to incorporate substantial amounts of wind. Norway, Brazil, and Manitoba all have high levels of hydroelectric generation, Quebec produces over 90% of its electricity from hydropower, and Hydro-Québec is the largest hydropower producer in the world. The U.S. Pacific Northwest has been identified as another region where wind energy is complemented well by existing hydropower, and there were "no fundamental technical barriers" to integrating up to 6,000 MW of wind capacity.[78] Storage capacity in hydropower facilities will be limited by size of reservoir, and environmental and other considerations.
- The Institute for Solar Energy Supply Technology of the University of Kassel, Germany pilot-tested a combined power plant linking solar, wind, biogas and hydrostorage to provide load-following power around the clock, entirely from renewable sources.[79]
Export & import arrangements with neighboring systems
- It is often feasible to export energy to neighboring grids at times of surplus, and import energy when needed. This practice is common in Western Europe and North America.
- Integration with other grids can lower the effective concentration of variable power. Denmark's 44% penetration, in the context of the German/Dutch/Scandinavian grids with which it has interconnections, is considerably lower as a proportion of the total system.
- Integration of grids may decrease the overall variability of both supply and demand by increasing geographical diversity.
- Methods of compensating for power variability in one grid, such as peaking-plants or pumped-storage hydro-electricity, may be taken advantage of by importing variable power from another grid that is short on such capabilities.
- The capacity of power transmission infrastructure may have to be substantially upgraded to support export/import plans.
- Some energy is lost in transmission.
- The economic value of exporting variable power depends in part on the ability of the exporting grid to provide the importing grid with useful power at useful times for an attractive price.
Penetration
Penetration refers to the proportion of a primary energy (PE) source in an electric power system, expressed as a percentage.[9] There are several methods of calculation yielding different penetrations. The penetration can be calculated either as:[80]
- the nominal capacity (installed power) of a PE source divided by the peak load within an electric power system; or
- the nominal capacity (installed power) of a PE source divided by the total capacity of the electric power system; or
- the electrical energy generated by a PE source in a given period, divided by the demand of the electric power system in this period.
The level of penetration of intermittent variable sources is significant for the following reasons:
- Power grids with significant amounts of dispatchable pumped storage, hydropower with reservoir or pondage or other peaking power plants such as natural gas-fired power plants are capable of accommodating fluctuations from intermittent power more easily.[81]
- Relatively small electric power systems without strong interconnection may only be stable and economic with a lower fraction of wind energy (e.g. Ireland), although hybrid wind/diesel and solar/diesel systems have been used in isolated communities with success at relatively high penetration levels.[82][83]
Renewable electricity supply in the 20-50+% penetration range has already been implemented in several European systems, albeit in the context of an integrated European grid system:[55]
In 2010, four German states, totaling 10 million people, relied on wind power for 43-52% of their annual electricity needs. Denmark isn't far behind, supplying 22% of its power from wind in 2010 (26% in an average wind year). The Extremadura region of Spain is getting up to 25% of its electricity from solar, while the whole country meets 16% of its demand from wind. Just during 2005-2010, Portugal vaulted from 17% to 45% renewable electricity.[55]
There is no generally accepted maximum level of penetration, as each system's capacity to compensate for intermittency differs, and the systems themselves will change over time. Discussion of acceptable or unacceptable penetration figures should be treated and used with caution, as the relevance or significance will be highly dependent on local factors, grid structure and management, and existing generation capacity.
For most systems worldwide, existing penetration levels are significantly lower than practical or theoretical maximums; for example, a UK study found that "it is clear that intermittent generation need not compromise electricity system reliability at any level of penetration foreseeable in Britain over the next 20 years, although it may increase costs."[80]
Maximum penetration limits
There is no generally accepted maximum penetration of wind energy that would be feasible in any given grid. Rather, economic efficiency and cost considerations are more likely to dominate as critical factors; technical solutions may allow higher penetration levels to be considered in future, particularly if cost considerations are secondary.
High penetration scenarios may be feasible in certain circumstances:
- Power generation for periods of little or no wind generation can be provided by retaining the existing power stations. The cost of using existing power stations for this purpose may be low since fuel costs dominate the operating costs. The actual cost of paying to keep a power station idle, but usable at short notice, may be estimated from published spark spreads and dark spreads. As existing traditional plant ages, the cost of replacing or refurbishing these facilities will become part of the cost of high-penetration wind if they are used only to provide operational reserve.
- Automatic load shedding of large industrial loads and its subsequent automatic reconnection is established technology and used in the UK and U.S., and known as Frequency Service contractors in the UK. Several GW are switched off and on each month in the UK in this way. Reserve Service contractors offer fast response gas turbines and even faster diesels in the UK, France and U.S. to control grid stability.
- In a close-to-100% wind scenario, surplus wind power can be allowed for by increasing the levels of the existing Reserve and Frequency Service schemes and by extending the scheme to domestic-sized loads. Energy can be stored by advancing deferrable domestic loads such as storage heaters, water heaters, fridge motors, or even hydrogen production, and load can be shed by turning such equipment off.
- Alternatively or additionally, power can be exported to neighboring grids and re-imported later. HVDC cables are efficient with 3% loss per 1000 km and may be inexpensive in certain circumstances. For example, an 8 GW link from UK to France would cost about £1 billion using high-voltage direct current cables. Under such scenarios, the amount of transmission capacity required may be many times higher than currently available.
Penetration studies
Studies have been conducted to assess the viability of specific penetration levels in specific energy markets.
European super grid
A series of detailed modelling studies by Dr. Gregor Czisch, which looked at the European wide adoption of renewable energy and interlinking power grids the European super grid using HVDC cables, indicates that the entire European power usage could come from renewables, with 70% total energy from wind at the same sort of costs or lower than at present.[65] This proposed large European power grid has been called a "super grid."[84][85]
The model deals with intermittent power issues by using base-load renewables such as hydroelectric and biomass for a substantial portion of the remaining 30% and by heavy use of HVDC to shift power from windy areas to non-windy areas. The report states that "electricity transport proves to be one of the keys to an economical electricity supply" and underscores the importance of "international co-operation in the field of renewable energy use [and] transmission."[65][86][87]
Dr. Czisch described the concept in an interview, saying "For example, if we look at wind energy in Europe. We have a winter wind region where the maximum production is in winter and in the Sahara region in northern Africa the highest wind production is in the summer and if you combine both, you come quite close to the needs of the people living in the whole area - let's say from northern Russia down to the southern part of the Sahara."[88]
Grid study in Ireland
A study of the grid in Ireland indicates that it would be feasible to accommodate 42% (of demand) renewables in the electricity mix.[89] This acceptable level of renewable penetration was found in what the study called Scenario 5, provided 47% of electrical capacity (different from demand) with the following mix of renewable energies:
- 6,000 MW wind
- 360 MW base load renewables
- 285 MW additional variable renewables (other intermittent sources)
The study cautions that various assumptions were made that "may have understated dispatch restrictions, resulting in an underestimation of operational costs, required wind curtailment, and CO2 emissions" and that "The limitations of the study may overstate the technical feasibility of the portfolios analyzed..."
Scenario 6, which proposed renewables providing 59% of electrical capacity and 54% of demand had problems. Scenario 6 proposed the following mix of renewable energies:
- 8,000 MW wind
- 392 MW base load renewables
- 1,685 MW additional variable renewables (other intermittent sources)
The study found that for Scenario 6, "a significant number of hours characterized by extreme system situations occurred where load and reserve requirements could not be met. The results of the network study indicated that for such extreme renewable penetration scenarios, a system re-design is required, rather than a reinforcement exercise." The study declined to analyze the cost effectiveness of the required changes because "determination of costs and benefits had become extremely dependent on the assumptions made" and this uncertainty would have impacted the robustness of the results.[5]
Canada
A study published in October 2006, by the Ontario Independent Electric System Operator (IESO) found that "there would be minimal system operation impacts for levels of wind capacity up to 5,000 MW," which corresponds to a peak penetration of 17%[90]
Denmark
A November 2006 analysis, found that "wind power may be able to cover more than 50% of the Danish electricity consumption in 2025" under conditions of high oil prices and higher costs for CO2 allowances.[91] Denmark's two grids (covering West Denmark and East Denmark separately) each incorporate high-capacity interconnectors to neighbouring grids where some of the variations from wind are absorbed.[92] In 2012 the Danish government adopted a plan to increase the share of electricity production from wind to 50% by 2020,[93][94] and to 84% in 2035.[95]
Economic impacts of variability
Estimates of the cost of wind energy may include estimates of the "external" costs of wind variability, or be limited to the cost of production. All electrical plant has costs that are separate from the cost of production, including, for example, the cost of any necessary transmission capacity or reserve capacity in case of loss of generating capacity. Many types of generation, particularly fossil fuel derived, will also have cost externalities such as pollution, greenhouse gas emission, and habitat destruction which are generally not directly accounted for. The magnitude of the economic impacts is debated and will vary by location, but is expected to rise with higher penetration levels. At low penetration levels, costs such as operating reserve and balancing costs are believed to be insignificant.
Intermittency may introduce additional costs that are distinct from or of a different magnitude than for traditional generation types. These may include:
- Transmission capacity: transmission capacity may be more expensive than for nuclear and coal generating capacity due to lower load factors. Transmission capacity will generally be sized to projected peak output, but average capacity for wind will be significantly lower, raising cost per unit of energy actually transmitted. However transmission costs are a low fraction of total energy costs.[96]
- Additional operating reserve: if additional wind does not correspond to demand patterns, additional operating reserve may be required compared to other generating types, however this does not result in higher capital costs for additional plants since this is merely existing plants running at low output - spinning reserve. Contrary to statements that all wind must be backed by an equal amount of "back-up capacity", intermittent generators contribute to base capacity "as long as there is some probability of output during peak periods." Back-up capacity is not attributed to individual generators, as back-up or operating reserve "only have meaning at the system level."[97]
- Balancing costs: to maintain grid stability, some additional costs may be incurred for balancing of load with demand. The ability of the grid to balance supply with demand will depend on the rate of change of the amount of energy produced (by wind, for example) and the ability of other sources to ramp production up or scale production down. Balancing costs have generally been found to be low.
- Storage, export and load management: at high penetrations (more than 30%), solutions (described below) for dealing with high output of wind during periods of low demand may be required. These may require additional capital expenditures, or result in lower marginal income for wind producers.
Analyses of costs
Studies have been performed to determine the costs of variability. RenewableUK states:
| “ | A review of integration studies, worldwide, suggests that the additional costs of integrating wind are around £2/MWh with 10% wind, rising to £3/MWh with 20% wind.[98] | ” |
Colorado – separate reports by Xcel and UCS
An official at Xcel Energy claimed that at 20 percent penetration, additional standby generators to compensate for wind in Colorado would cost $8 per MWh, adding between 13% and 16% to the US$50–60 cost per MWh of wind energy.[99]
The Union of Concerned Scientists conducted a study of the costs to increase the renewable penetration in Colorado to 10% and found that for an average residential bill "customers of municipal utilities and rural electric cooperatives that opt out of the solar energy requirement" would save 4 cents per month, but that for Xcel Energy customers there would be additional cost of about 10 cents per month. Total impact on all consumers would be $4.5 million or 0.01% over two decades.[100][101]
UK studies
A detailed study for UK National Grid (a private power company) states "We have estimated that for the case with 8,000 MW of wind needed to meet the 10% renewables target for 2010, balancing costs can be expected to increase by around £2 per MWh of wind production. This would represent an additional £40million per annum, just over 10% of existing annual balancing costs."[102][103]
In evidence to the UK House of Lords Economic Affairs Select Committee, National Grid have quoted estimates of balancing costs for 40% wind and these lie in the range £500-1000M per annum. "These balancing costs represent an additional £6 to £12 per annum on average consumer electricity bill of around £390."[104]
National Grid notes that "increasing levels of such renewable generation on the system would increase the costs of balancing the system and managing system frequency."[103]
A 2003 report,[6] by Carbon Trust and the UK Department of Trade and Industry (DTI), projected costs of £1.6 to £2.4 billion for reinforcement and new build of transmission and distribution systems to support 10% renewable electricity in the UK by 2010, and £3.2bn to £4.5bn for 20% by 2020. The study classified "Intermittency" as "Not a significant issue" for the 2010 target but a "Significant Issue" for the 2020 target. See grid balancing
Minnesota
A Minnesota study on wind penetration levels and found that "total integration operating cost for up to 25% wind energy" would be less than $0.0045 per kWh (additional).[105]
Intermittency and renewable energy
There are differing views about some sources of renewable energy and intermittency. The World Nuclear Association argues that the sun, wind, tides and waves cannot be controlled to provide directly either continuous base-load power, or peak-load power when it is needed.[106] Proponents of renewable energy use argue that the issue of intermittency of renewables is over-stated, and that practical experience demonstrates this.[107] In any case, geothermal renewable energy has, like nuclear, no intermittency (but they both use the energy in radioactive materials like uranium, thorium and potassium).
Views of critics of high penetration renewable energy use
For many years there was a consensus within the electric utilities in the U.S. that renewable electricity generators such as wind and solar are so unreliable and intermittent that they will never be able to contribute significantly to electric supply or provide baseload power. Thomas Petersnik, an analyst with the U.S. Energy Information Administration put it this way: "by and large, renewable energy sources are too rare, too distant, too uncertain, and too ill-timed to provide significant supplies at times and places of need".[108]
| EROEI | Energy sources in 2013 |
|---|---|
| 3.5 | Biomass (corn) |
| 3.9 | Solar PV (Germany) |
| 16 | Wind (E-66 turbine) |
| 19 | Solar thermal CSP(desert) |
| 28 | fossil gas in a CCGT |
| 30 | Coal |
| 49 | Hydro (medium-sized dam) |
| 75 | Nuclear (in a PWR) |
According to a transatlantic collaborative research paper on Energy return on energy Invested(EROEI), conducted by 6 analysts and led by D. Weißbach, as published in the peer reviewed journal Energy in 2013. The uncorrected for their intermittency("unbuffered") EROEI for each energy source analyzed is as depicted in the attached table at right,[109][110] while the buffered(corrected for their intermittency) EROEI stated in the paper for all low carbon power sources, with the exception of nuclear and biomass, were yet lower still. As when corrected for their weather intermittency/"buffered", the EROEI figures for intermittent energy sources as stated in the paper is diminished - a reduction of EROEI dependent on how reliant they are on back up energy sources.[110][111]
Views of proponents of high penetration renewable energy use
The U.S. Federal Energy Regulatory Commission (FERC) Chairman Jon Wellinghoff has stated that "baseload capacity is going to become an anachronism" and that no new nuclear or coal plants may ever be needed in the United States.[112][113] Some renewable electricity sources have identical variability to coal-fired power stations, so they are base-load, and can be integrated into the electricity supply system without any additional back-up. Examples include:
- Bio-energy, based on the combustion of crops and crop residues, or their gasification followed by combustion of the gas.
- Hot dry rock geothermal power, which is being developed in Australia and the United States.
- Solar thermal electricity, with overnight heat storage in molten salt, water or rocks.
Grid operators in countries like Denmark and Spain now integrate large quantities of renewable energy into their electricity grids, with Denmark receiving 40% of its electricity from wind power during some months.[108]
Supporters say that the total electricity generated from a large-scale array of dispersed wind farms, located in different wind regimes, cannot be accurately described as intermittent, because it does not start up or switch off instantaneously at irregular intervals.[114] With a small amount of supplementary peak-load plant, which operates infrequently, large-scale distributed wind power can substitute for some base-load power and be equally reliable.[115]
Hydropower can be intermittent and/or dispatchable, depending on the configuration of the plant. Typical hydroelectric plants in the dam configuration may have substantial storage capacity, and be considered dispatchable. Run of the river hydroelectric generation will typically have limited or no storage capacity, and will be variable on a seasonal or annual basis (dependent on rainfall and snow melt).[18]
Amory Lovins suggests a few basic strategies to deal with these issues:
| “ | "The variability of sun, wind and so on, turns out to be a non-problem if you do several sensible things. One is to diversify your renewables by technology, so that weather conditions bad for one kind are good for another. Second, you diversify by site so they're not all subject to the same weather pattern at the same time because they're in the same place. Third, you use standard weather forecasting techniques to forecast wind, sun and rain, and of course hydro operators do this right now. Fourth, you integrate all your resources — supply side and demand side..."[116] | ” |
Moreover, efficient energy use and energy conservation measures can reliably reduce demand for base-load and peak-load electricity.[24][117]
International groups are studying much higher penetrations (30-100% renewable energy), and conclusions are that these levels are also technically feasible.[118] In the UK, one summary of other studies indicated that if assuming that wind power contributed less than 20% of UK power consumption, then the intermittency would cause only moderate cost.[119]
Methods to manage wind power integration range from those that are commonly used at present (e.g. demand management) to potential new technologies for grid energy storage. Improved forecasting can also contribute as the daily and seasonal variations in wind and solar sources are to some extent predictable. The Pembina Institute and the World Wide Fund for Nature state in the Renewable is Doable plan that resilience is a feature of renewable energy:
| “ | Diversity and dispersal also add system security. If one wind turbine fails, the lights won't flicker. If an entire windfarm gets knocked out by a storm, only 40,000 people will lose power. If a single Darlington reactor goes down, 400,000 homes, or key industries, could face instant blackouts. To hedge this extra risk, high premiums have to be paid for decades to ensure large blocks of standby generation.[42] | ” |
See also
- Brittle Power
- Control of the National Grid
- Cost per kWh of transmission in the UK
- Demand response
- Energy security and renewable technology
- Energy storage
- European super grid
- Geothermal heat pump
- High-voltage direct current (HVDC)
- List of power outages
- List of energy storage projects
- Load management
- Motor-generator
- National Grid Reserve Service
- Northeast Blackout of 2003
- Relative cost of electricity generated by different sources
- Economics of new nuclear power plants (for more cost comparisons)
- Spark spread: calculating the cost of back up
- Three-phase electric power
- Smart grid and V2G to override intermittency.
- Variable renewable energy
Further reading
These peer-reviewed papers examine the impacts of intermittency:
- Dale, L; Milborrow, D; Slark, R; & Strbac, G, 2003, A shift to wind is not unfeasible (Total Cost Estimates for Large-scale Wind Scenarios in UK), Power UK, no. 109, pp. 17–25.
- Farmer, E; Newman, V; & Ashmole, P, Economic and operational implications of a complex of wind-driven power generators on a power system, IEE Proceedings A, 5 edn. vol. 127.
- Gross, R; Heptonstall, P; Anderson, D; Green, T; Leach, M; & Skea, J, 2006, The Costs and Impacts of Intermittency. UK Energy Research Centre, London
- Gross, R; Heptonstall, P; Leach, M; Anderson, D; Green, T; & Skea, J, 2007, Renewables and the grid: understanding intermittency, Proceedings of ICE, Energy, vol. 160, no. 1, pp. 31–41.
- Grubb, M, 1991, The integration of renewable electricity sources, Energy Policy, vol. 19, no. 7, pp. 670–688.
- Halliday, J; Lipman, N; Bossanyi, E; & Musgrove, P, 1983, Studies of wind energy integration for the UK national electricity grid, American Wind Energy Association Wind Worksop VI, Minneapolis.
- Holttinen, H, 2005, Impact of hourly wind power variations on the system operation in the Nordic countries, Wind energy, vol. 8, no. 2, pp. 197–218.
- Ilex & Strbac, G, 2002, Quantifying The System Costs Of Additional Renewables in 2020, DTI, urn 02/1620
- Milligan, M, 2001, A Chronological Reliability Model to Assess Operating Reserve Allocation to Wind Power Plants, National Renewable Energy Laboratory, The 2001 European Wind Energy Conference
- Skea, J; Anderson, D; Green, T; Gross, R; Heptonstall, P; & Leach, M, 2008, Intermittent renewable generation and maintaining power system reliability, Generation, Transmission & Distribution, IET, vol. 2, no. 1, pp. 82–89.
References
- ↑ Edwin Cartlidge (18 November 2011). "Saving for a rainy day". Science (Vol 334). pp. 922–924. Missing or empty
|url=(help) - ↑ Wright, matthew; Hearps, Patrick; et al. Australian Sustainable Energy: Zero Carbon Australia Stationary Energy Plan, Energy Research Institute, University of Melbourne, October 2010, p. 33. Retrieved from BeyondZeroEmissions.org website.
- ↑ Innovation in Concentrating Thermal Solar Power (CSP), RenewableEnergyFocus.com website.
- ↑ Solana: 10 Facts You Didn't Know About the Concentrated Solar Power Plant Near Gila Bend
- 1 2 3 "All Island Grid Study" (PDF). Department of Communications, Energy and Natural Resources. January 2008. pp. 3–5, 15. Archived from the original (PDF) on 2009-03-18. Retrieved 2008-10-15.
- 1 2 "The Carbon Trust & DTI Renewables Network Impacts Study" (PDF). Carbon Trust and UK Department of Trade and Industry. January 2004 [commissioned June 2003]. Archived from the original (PDF) on 2010-09-19. Retrieved 2009-04-22.
- 1 2 Graham Sinden, "Assessing the Costs of Intermittent Power Generation Archived 2009-03-18 at the Wayback Machine.", UK Energy Research Centre, 5 July 2005
- 1 2 3 Kuntz, Mark T.; Justin Dawe (2005). "renewable. rechargeable. remarkable". VRB Power Systems. Mechanical Engineering. Archived from the original on 2009-01-15. Retrieved 2008-10-20.
- 1 2 International Energy Agency Wind Task Force, "Design and Operation of Power Systems with Large Amounts of Wind Power" Oklahoma Conference Presentation, October 2006
- ↑ Giebel, Gregor. "WIND POWER HAS A CAPACITY CREDIT" (PDF). Risø National Laboratory. Retrieved 2008-10-16.
- ↑ Gemasolar, energía non stop Spanish 26 October 2011
- 1 2 "Wind Power: Capacity Factor, Intermittency, and what happens when the wind doesn't blow?" (PDF). Renewable Energy Research Laboratory, University of Massachusetts Amherst. Archived from the original (PDF) on 2008-10-01. Retrieved 2008-10-16.
- ↑ Laumer, John (June 2008). "Solar Versus Wind Power: Which Has The Most Stable Power Output?". Treehugger. Retrieved 2008-10-16.
- 1 2 "Executive Summary: Assessment of Parabolic Trough and Power Tower Solar Technology Cost and Performance Forecasts" (PDF). National Renewable Energy Laboratory. October 2003. Retrieved 2016-11-07.
- ↑ Spain Pioneers Grid-Connected Solar-Tower Thermal Power p. 3. Retrieved December 19, 2008.
- ↑ Mills, David; Robert G. Morgan (July 2008). "A solar-powered economy: How solar thermal can replace coal, gas and oil". RenewableEnergyWorld.com. Retrieved 2008-10-17.
- ↑ "Solar Air Cooling". Integration of Renewable energy on Farms. March 2008. Retrieved 2008-10-17.
- 1 2 3 4 5 "Variability of Wind Power and other Renewables: Management Options and Strategies" (PDF). IEA. 2005. Retrieved 2008-10-15.
- 1 2 3 "The power of multiples: Connecting wind farms can make a more reliable and cheaper power source". 2007-11-21.
- 1 2 3 Archer, C. L.; Jacobson, M. Z. (2007). "Supplying Baseload Power and Reducing Transmission Requirements by Interconnecting Wind Farms" (PDF). Journal of Applied Meteorology and Climatology. American Meteorological Society. 46 (11): 1701–1717. Bibcode:2007JApMC..46.1701A. doi:10.1175/2007JAMC1538.1.
- ↑ Diesendorf, Mark (2007). "Greenhouse Solutions with Sustainable Energy": 119.
Graham Sinden analysed over 30 years of hourly wind speed data from 66 sites spread out over the United Kingdom. He found that the correlation coefficient of wind power fell from 0.6 at 200 km to 0.25 at 600 km separation (a perfect correlation would have a coefficient equal to 1.0). There were no hours in the data set where wind speed was below the cut-in wind speed of a modern wind turbine throughout the United Kingdom, and low wind speed events affecting more than 90 per cent of the United Kingdom had an average recurrent rate of only one hour per year.
- ↑ David JC MacKay. "Sustainable Energy - without the hot air. Fluctuations and storage".
- ↑ Andrzej Strupczewski. "Czy w Polsce wiatr wystarczy zamiast elektrowni atomowych?" [Can the wind suffice instead of nuclear power in Poland?] (in Polish). atom.edu.pl.
- 1 2 Diesendorf, Mark (August 2007). "The Base-Load Fallacy" (PDF). Institute of Environmental Studies. www.energyscience.org.au. Retrieved 2008-10-18.
- ↑ "Analysis of UK Wind Generation" 2011
- ↑ "Why wind power works for Denmark". Civil Engineering. May 2005. Retrieved 15 January 2008.
- 1 2 "Blowing Away the Myths" (PDF). The British Wind Energy Association. February 2005. Archived from the original (PDF) on 2007-07-10. Retrieved 2008-10-16.
- ↑ "Non-dispatchable Production in the Nordel System" (PDF). Nordel's Grid Group. May 2000. Retrieved 2008-10-18.
- ↑ "How Energy Markets Can Solve Modern Challenges". Morning Consult. Retrieved 22 May 2015.
- ↑ Nedic, Dusko; Anser Shakoor; Goran Strbac; Mary Black; Jim Watson; Catherine Mitchell (July 2005). "Security assessment of future UK electricity scenarios" (PDF). Tyndall Centre for Climate Change Research. Archived from the original (PDF) on January 11, 2007. Retrieved 2008-10-20.
- ↑ name="Junling">Junling Huang; Xi Lu; Michael B. McElroy (2014). "Meteorologically defined limits to reduction in the variability of outputs from a coupled wind farm system in the Central US" (PDF). Renewable Energy. 62: 331–340. doi:10.1016/j.renene.2013.07.022.
- ↑ https://pdfs.semanticscholar.org/1709/4a682549e8e853be7b393e916f4cab91487a.pdf Graham Sinden (1 December 2005). "Characteristics of the UK wind resource" pg4
- ↑ Reliability of Wind Turbines
- ↑ "Wind Systems Integration Basics". Archived from the original on 7 June 2012.
- ↑ ERCOT
- 1 2 3 International Energy Agency (2009). IEA Wind Energy: Annual Report 2008 Archived 2011-07-20 at the Wayback Machine. p. 9.
- 1 2 "Wind Energy in Germany". Germany WindEnergy Association. Archived from the original on 2011-03-24. Retrieved 2008-10-15.
- ↑ "New record-breaking year for Danish wind power". Energinet.dk. 15 January 2016. Archived from the original on 25 January 2016.
- ↑ "Archived copy". Archived from the original on 2012-08-02. Retrieved 2012-02-04.
- ↑ En visionr dansk energipolitik frem til 2025
- 1 2 Modern Power Systems, Sept 25, 2009, Maj. Dang Trong
- 1 2 "renewable is doable A Smarter Energy Plan for Ontario (brochure version)" (PDF). PEMBINA Institute. August 2007. Retrieved 2008-10-17.
- ↑ Dixon, David (September 2006). "Wind Generation's Performance during the July 2006 California Heat Storm". Energy Pulse. Retrieved 2008-10-18.
- ↑ (in French) Ministère de l'Écologie, du Développement et de l'Aménagement Durables. Notre système électrique à l'épreuve de la canicule.
Google translated version. - ↑ Wind Integration: An Introduction to the State of the Art
- 1 2 3 Lovins, Amory; Imran Sheikh; Alex Markevich (2009). "Nuclear Power:Climate Fix or Folly". Rocky Mountain Institute. p. 10. Archived from the original on 2011-09-27. Retrieved 20 Oct 2012.
All sources of electricity sometimes fail, differing only in how predictably, why, how often, how much, and for how long. Even the most reliable giant power plants are intermittent: they fail un-expectedly in billion-watt chunks, often for long periods.
- ↑ http://www.ren21.net/wp-content/uploads/2015/07/REN12-GSR2015_Onlinebook_low1.pdf pg31
- ↑ "Renewable Energy in Ireland 2012" (PDF). Sustainable Energy Authority in Ireland. Retrieved 19 November 2014.
- ↑ Rasmussen, Jesper Nørskov. "Vindmøller slog rekord i 2014 Archived 2015-01-06 at the Wayback Machine." (in Danish) Energinet.dk, 6 January 2015. Accessed: 6 January 2015.
- ↑ https://online.wsj.com/articles/denmarks-wind-power-output-rises-to-record-in-first-half-1409750563
- ↑ Carsten Vittrup. "2013 was a record-setting year for Danish wind power Archived 2014-10-18 at the Wayback Machine." (in Danish) Energinet.dk, 15 January 2014. Accessed: 20 January 2014.
- ↑ Bach, P.F. (2015). "Towards 50% Wind Electricity in Denmark, slide 7" (PDF).
- ↑ Saleh, M.; Esa, Y.; Mhandi, Y.; Brandauer, W.; Mohamed, A. (October 2016). "Design and implementation of CCNY DC microgrid testbed". 2016 IEEE Industry Applications Society Annual Meeting: 1–7. doi:10.1109/IAS.2016.7731870.
- ↑ Saleh, M. S.; Althaibani, A.; Esa, Y.; Mhandi, Y.; Mohamed, A. A. (October 2015). "Impact of clustering microgrids on their stability and resilience during blackouts". 2015 International Conference on Smart Grid and Clean Energy Technologies (ICSGCE): 195–200. doi:10.1109/ICSGCE.2015.7454295.
- 1 2 3 4 Amory Lovins (2011). Reinventing Fire, Chelsea Green Publishing, p. 199.
- ↑ name="Junling">Junling Huang; Michael B. McElroy (2014). "Meteorologically defined limits to reduction in the variability of outputs from a coupled wind farm system in the Central US". Renewable Energy. 62: 331–340. doi:10.1016/j.renene.2013.07.022.
- ↑ Kate Galbraith. 100 Percent Renewables by 2030? Green Inc., December 1, 2009.
- ↑ Mark Z. Jacobson and Mark A. Delucchi. A Path to Sustainable Energy by 2030, Scientific American, November 2009, p. 43.
- 1 2 Delucchi, Mark A. and Mark Z. Jacobson (2010). "Providing all Global Energy with Wind, Water, and Solar Power, Part II: Reliability, System andTransmission Costs, and Policies" (PDF). Energy policy.
- ↑ Wald, Matthew L. (2010-01-21). "Expanding Use of Wind Power Feasible, but May Be Costly". The New York Times. Retrieved 2010-05-05.
- ↑ http://dspace.mit.edu/handle/1721.1/32284
- ↑ "Archived copy" (PDF). Archived from the original (PDF) on 2008-10-01. Retrieved 2011-03-09.
- ↑ Affordable Renewable Electricity Supply for Europe and its Neighbours Dr Gregor Czisch, Kassell University, paper at Claverton Energy Conference, Bath October 24, 2008
- ↑ http://www.claverton-energy.com/green-grid-article-in-new-scientist-by-david-strahan-the-oil-drum-on-hvdc-supergrids.html
- 1 2 3 Czisch, Gregor; Gregor Giebel. "Realisable Scenarios for a Future Electricity Supply based 100% on Renewable Energies" (PDF). Institute for Electrical Engineering – Efficient Energy Conversion University of Kassel, Germany and Risø National Laboratory, Technical University of Denmark. Archived from the original (PDF) on 2014-07-01. Retrieved 2008-10-15.
- ↑ "Solar and Energy Storage: A Perfect Match - Energy Storage to the Test". RenewableEnergyWorld.com. Retrieved 2011-03-08.
- ↑ http://www.claverton-energy.com/how-cern-is-encouraged-to-not-do-atom-or-quark-smashing-during-periods-of-high-demand-and-low-power-station-availablity-by-means-of-the-ejp-tarrif.html - Extract from CERN newsletter indication when to switch of loads
- ↑ http://www.claverton-energy.com/download/42/ description of EJP tariff Archived December 8, 2008, at the Wayback Machine.
- ↑ "2005 Integrated Energy Policy Report". California Energy Commission. November 21, 2005. Retrieved 2006-04-21.
- ↑ http://www.claverton-energy.com/commercial-opportunities-for-back-up-generation-and-load-reduction-via-national-grid-the-national-electricity-transmission-system-operator-netso-for-england-scotland-wales-and-offshore.html Commercial Opportunities for Back-Up Generation and Load Reduction via National Grid, the National Electricity Transmission System Operator (NETSO) for England, Scotland, Wales and Offshore.
- ↑ Benitez, Pablo C.; Lilianna E. Dragulescu; G. Cornelis Van Kooten (February 2006). "The Economics of Wind Power with Energy Storage". Resource Economics and Policy Analysis (REPA) Research Group. Department of Economics, University of Victoria. Retrieved 2008-10-20.
- ↑ Levene, J.; B. Kroposki; G. Sverdrup (March 2006). "Wind Energy and Production of Hydrogen and Electricity - Opportunities for Renewable Hydrogen - Preprint" (PDF). National Renewable Energy Laboratory. Retrieved 2008-10-20.
- ↑ "Air-Breathing Battery Renewable Energy Storage Solution". Enviro-News.com. August 3, 2012.
- 1 2 name="Junling">Junling Huang; Michael B. McElroy (2014). "Meteorologically defined limits to reduction in the variability of outputs from a coupled wind farm system in the Central US". Renewable Energy. 62: 331–340. doi:10.1016/j.renene.2013.07.022.
- ↑ US Department of Energy: Maintaining Reliability in the Modern Power System, December 2016, p. 17
- ↑ Michael G. Richard: Death by 'capacity factor': Is this how wind and solar ultimately win the game?, 2015-10-06
- ↑ Lovins, Amory; L. Hunter Lovins (November 1983). "The Fragility of Domestic Energy" (PDF). The Atlantic. Archived from the original (PDF) on June 25, 2008. Retrieved 2008-10-20.
- ↑ https://www.washingtonpost.com/wp-dyn/content/article/2007/03/20/AR2007032001634.html "Air, Water Powerful Partners in Northwest", Washington Post, March 20, 2007
- ↑ "The Combined Power Plant: the first stage in providing 100% power from renewable energy". SolarServer. January 2008. Retrieved 2008-10-10.
- 1 2 Gross, Robert; Heptonstall, Philip; Anderson, Dennis; Green, Tim; Leach, Matthew; Skea, Jim (March 2006). The Costs and Impacts of Intermittency (PDF). UK Energy Research Council. ISBN 1-903144-04-3. Archived from the original (PDF) on 2009-03-18. Retrieved 2010-07-22.
- ↑ http://repa.econ.uvic.ca/publications/Working%20Paper%202006-02.pdf%5Bpermanent+dead+link%5D
- ↑ Characterizing the Effects of High Wind Penetration on a Small Isolated Grid in Arctic Alaska
- ↑ Photovoltaic Diesel Hybrid Project With SMA System Technology Has Gone Into Operation In India: a project with 1,25 MVA diesel genset & 1 MWp PV system, 2013-07-02
- ↑ MacDonnel, Leah. "Dr. Gregor Czisch's green European "Super Grid"". DW-World.de. Retrieved 2008-10-16.
- ↑ Rodgers, Paul (2007-11-25). "Wind-fuelled 'supergrid' offers clean power to Europe". The Independent. London. Retrieved 2008-10-16.
- ↑ EFFECTS OF LARGE-SCALE DISTRIBUTION OF WIND ENERGY IN AND AROUND EUROPE Dr. Gregor Giebel Niels Gylling Mortensen Risø National Laboratory DK-4000 Roskilde Gregor Czisch ISET Universität-Gesamthochschule Kassel "Archived copy". Archived from the original on 2007-12-31. Retrieved 2008-09-02.
- ↑ (German)Gregor Czisch: Szenarien zur zukünftigen Stromversorgung, kostenoptimierte Variationen zur Versorgung Europas und seiner Nachbarn mit Strom aus erneuerbaren Energien. https://kobra.bibliothek.uni-kassel.de/handle/urn:nbn:de:hebis:34-200604119596
- ↑ DeLisle, Heather. "Interview with Dr Gregor Czisch, a physicist and energy expert at the University of Kassel". DW-World.de. Retrieved 2008-10-16.
- ↑ "Study shows Ireland can be world leader in renewable energy". Department of Communications, Energy and National Resources. January 2008. Archived from the original on March 21, 2012. Retrieved 2008-10-20.
- ↑ "Ontario Wind Integration Study" (PDF). Ontario Independent Electric System Operator. 2006. Retrieved 2006-10-30.
- ↑ "Danish Offshore Wind - Key Environmental Issues" (PDF). DONG Energy, Vattenfall, The Danish Energy Authority and the Danish Forest and Nature Agency. November 2006. Retrieved 2008-10-15.
- ↑ "dynamic Flash map of Danish grids and flows on interconnectors". Energinet. Archived from the original on June 7, 2007. Retrieved 2010-07-22.
- ↑ Danish Wind Industry Association, Wind energy Denmark, n.d.
- ↑ The Guardian: "Denmark aims to get 50% of all electricity from wind power", 26 March 2012
- ↑ Lindboe, page 3
- ↑ http://www.claverton-energy.com/what-is-the-cost-per-kwh-of-bulk-transmission-national-grid-in-the-uk-note-this-excludes-distribution-costs.html Electric power transmission costs per kWh transmission / National Grid in the UK (note this excludes distribution costs)
- ↑ http://www.ukerc.ac.uk/component/option,com_docman/task,doc_download/gid,550/ Archived 2007-07-06 at the Wayback Machine. The Costs and Impacts of Intermittency, UK Energy Research Council, March 2006
- ↑ Ford, Richard; David Milborrow (February 2005). "Integrating renewables" (PDF). British Wind Energy Association. Retrieved 2008-10-20.
- ↑ https://www.nytimes.com/2006/12/28/business/28wind.html?pagewanted=all New York Times article on intermittency and penetration, December 28, 2006
- ↑ Deyette, Jeff; Steve Clemmer (October 2004). "The Colorado Renewable Energy Standard Ballot Initiative: Impacts on Jobs and the Economy" (PDF). Union of Concerned Scientists. Retrieved 2008-10-16.
- ↑ "The Colorado Renewable Energy Standard Ballot Initiative: Impacts on Jobs and the Economy". Union of Concerned Scientists. October 2004. Retrieved 2008-10-16.
- ↑ No technical limitation to wind power penetration
- 1 2 "GB Seven Year Statement - Executive Summary". National Grid. 2006. Retrieved 2008-10-16.
- ↑ "National Grid's response to the House of Lords Economic Affairs Select Committee investigating the economics of renewable energy" (PDF). National Grid. June 2008. Archived from the original (PDF) on September 10, 2008. Retrieved 2008-10-15.
- ↑ Wolf, Ken; Matt Schuerger (December 2006). "Minnesota Wind Integration Study - Full Report" (PDF). Minnesota Public Utilities Commission. Retrieved 2008-10-17.
- ↑ Renewable Energy and Electricity
- ↑ Diesendorf, Mark (2007). Greenhouse Solutions with Sustainable Energy, UNSW Press, 413 pages.
- 1 2 Benjamin Sovacool (2009). "The intermittency of wind, solar, and renewable electricity generators: Technical barrier or rhetorical excuse?". Utilities Policy.
- ↑ "Energy intensities, EROIs (energy returned on invested), and energy payback times of electricity generating power plants". Energy. 52: 210–221. doi:10.1016/j.energy.2013.01.029.
- 1 2 Dailykos - GETTING TO ZERO: Is renewable energy economically viable? by Keith Pickering MON JUL 08, 2013 AT 04:30 AM PDT.
- ↑ "Energy intensities, EROIs (energy returned on invested), and energy payback times of electricity generating power plants. Energy Volume 52, 1 April 2013, pages 210–221". Energy. 52: 210–221. doi:10.1016/j.energy.2013.01.029.
- ↑ http://www.claverton-energy.com/a-very-significant-admission-by-the-us-ferc-chairman-that-the-issue-of-integrating-variable-sources-of-power-is-not-such-a-big-issue.html
- ↑ "Archived copy" (PDF). Archived from the original (PDF) on 2009-05-06. Retrieved 2009-07-17.
- ↑ Diesendorf, Mark (2007). Greenhouse Solutions with Sustainable Energy, UNSW Press, p. 119; See also, Sinden, G (2007). "Characteristics of the UK wind resource: long term patterns and relationship to electricity demand"'". Energy Policy. 35: 112–27. doi:10.1016/j.enpol.2005.10.003.
- ↑ In defence of renewable energy and its variability Archived 2007-08-29 at the Wayback Machine.
- ↑ Amory Lovins/Rocky Mountain Institute warm to PHEVs
- ↑ Sustainable energy has a powerful future
- ↑ "Archived copy" (PDF). Archived from the original (PDF) on 2011-08-25. Retrieved 2007-04-03. IEA Wind Summary Paper, Design and Operation of Power Systems with Large Amounts of Wind Power, September 2006
- ↑ http://www.ukerc.ac.uk/component/option,com_docman/task,doc_download/gid,550/ Archived July 6, 2007, at the Wayback Machine.
External links
- Stationary Energy Storage...Key to the Renewable Grid
- European Wind Energy Association, Large Scale Integration of Wind Energy in the European Power Supply: analysis, issues, and recommendations, December 2005
- New York Times article on wind intermittency, "It's Free, Plentiful and Fickle"
- Ontario grid operator data on current and historical output from all generator sources, including wind, showing variability in wind output
- Power Point presentation showing how national generating systems are actually controlled in detail.
- ESB National Grid (Ireland), "Impact of Wind Power Generation In Ireland on the Operation of Conventional Plant and the Economic Implications", 2004
- The Costs and Impacts of Intermittency, UK Energy Research Council, March 2006
- Grid Integration of Wind Energy
- Empowering Variable Renewables: Options for Flexible Electricity Systems
- Getting a (Firm) Grip on Renewables