ICC Test Championship
| Administrator | International Cricket Council |
|---|---|
| Format | Test cricket |
| First tournament | 2003 |
| Last tournament | ongoing |
| Tournament format |
notional (ongoing points accumulation through all matches played) |
| Number of teams | 12 |
| Current champion |
|
| Most successful |
|
The ICC Test Championship is an international competition run by the International Cricket Council for the 12 teams that play Test cricket. The competition is notional in the sense that it is simply a ranking scheme overlaid on all international matches that are otherwise played as part of regular Test cricket scheduling with no consideration of home or away status.
In essence, after every Test series, the two teams involved receive points based on a mathematical formula. Each team's points total from matches over the last 3−4 years is divided by a figure based on their total number of matches and series played, to give a 'rating'. The teams are ranked by order of rating, which is shown in a table.
A drawn match between higher and lower rated teams will benefit the lower-rated team at the expense of the higher-rated team. An 'average' team that wins as often as it loses, while playing a mix of stronger and weaker teams, will have a rating of 100.
The ICC awards a trophy, the ICC Test Championship mace, to the team holding the highest rating. The mace is transferred whenever a new team moves to the top of the rating list.[1] The team that is top of the ratings table on 1 April each year also wins a cash prize, currently $1 million.[2]
India are currently the highest-ranked team in the ICC Test Championship, having taken over at the top on 11 October 2016 when they won their Test series against New Zealand by a score of 3-0.[3][4]
Current
| ICC Test Championship | |||||
|---|---|---|---|---|---|
| Rank | Team | Matches | Points | Rating | |
| 1 | 38 | 4,397 | 116 | ||
| 2 | 35 | 3,712 | 106 | ||
| 3 | 33 | 3,499 | 106 | ||
| 4 | 45 | 4,772 | 105 | ||
| 5 | 23 | 2,354 | 102 | ||
| 6 | 38 | 3,668 | 97 | ||
| 7 | 21 | 1,853 | 88 | ||
| 8 | 32 | 2,432 | 76 | ||
| 9 | 19 | 1,268 | 67 | ||
| 10 | 8 | 12 | 2 | ||
| – | 1 | 0 | 0 | ||
| – | 1 | 0 | 0 | ||
| *Countries that have not played enough matches to gain an official ranking | |||||
| Reference: ICC Rankings, 15 October 2018 | |||||
| "Matches" is no. matches + no. series played in the 12–24 months since the May before last, plus half the number in the 24 months before that. | |||||
Afghanistan and Ireland were awarded Test status on 22 June 2017. Both have played and lost one Test, so have zero points but do not appear on the ICC rankings list.
Historical rankings
The ICC provides ratings for the end of each month back to June 2003. The teams that have successively held the highest rating since that date, by whole month periods, are:
| Team | Start | End | Total Months | Cumulative Months | Highest rating |
|---|---|---|---|---|---|
| June 2003 | July 2009 | 74 | 74 | 143 | |
| August 2009 | November 2009 | 3 | 3 | 122 | |
| November 2009 | August 2011 | 21 | 21 | 130 | |
| August 2011 | August 2012 | 12 | 12 | 125 | |
| August 2012 | May 2014 | 21 | 24 | 135 | |
| May 2014 | July 2014 | 3 | 77 | 123 | |
| July 2014 | January 2016 | 18 | 42 | 130 | |
| January 2016 | February 2016 | 1 | 22 | 110 | |
| February 2016 | August 2016 | 6 | 83 | 118 | |
| August 2016 | August 2016 | 4 days | 22 | 112 | |
| August 2016 | October 2016 | 2 | 2 | 111 | |
| October 2016 | present | 24 | 46 | 125 | |
| Reference: ICC Rankings | |||||
The summary of teams that have held the highest rating from June 2003 to the present by whole month periods, are:
| Team | Total Months | Highest Rating | ||
|---|---|---|---|---|
| 83 | 143 | |||
| 46 | 130 | |||
| 42 | 135 | |||
| 12 | 125 | |||
| 2 | 111 | |||
| Reference: ICC Historical Rankings | ||||
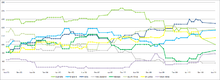
Since the ICC officially began ranking teams in 2003, Australia has dominated as it had done so in Test cricket since around 1995. However, from 2009, several teams (Australia, South Africa, India, England and Pakistan) have competed for the top positions.
The ICC retrospectively applied the current rating system to results since 1952 (providing ratings for the end of each month from then). The table only begins then, as prior to 1952 there is insufficient data available due to the infrequency of matches and the small number of competing teams in these earlier periods.[5]
The teams that have successively held the highest rating from January 1952 till May 2003, by whole month periods, are:
| Team | Start | End | Total Months | Cumulative Months |
|---|---|---|---|---|
| January 1952 | May 1955 | 41 | 41 | |
| June 1955 | February 1958 | 33 | 33 | |
| March 1958 | July 1958 | 5 | 46 | |
| August 1958 | December 1958 | 5 | 38 | |
| January 1959 | December 1963 | 60 | 106 | |
| January 1964 | December 1968 | 60 | 60 | |
| January 1969 | December 1969 | 12 | 12 | |
| January 1970 | January 1973 | 37 | 75 | |
| February 1973 | March 1973 | 2 | 108 | |
| April 1973 | June 1974 | 15 | 15 | |
| July 1974 | January 1978 | 43 | 151 | |
| February 1978 | January 1979 | 12 | 72 | |
| February 1979 | August 1980 | 19 | 94 | |
| September 1980 | February 1981 | 6 | 21 | |
| March 1981 | July 1988 | 89 | 161 | |
| August 1988 | September 1988 | 2 | 2 | |
| October 1988 | January 1991 | 28 | 189 | |
| February 1991 | April 1991 | 3 | 154 | |
| May 1991 | July 1992 | 15 | 204 | |
| August 1992 | January 1993 | 6 | 160 | |
| February 1993 | August 1995 | 31 | 235 | |
| September 1995 | November 1995 | 3 | 24 | |
| December 1995 | July 1999 | 44 | 204 | |
| August 1999 | December 1999 | 5 | 17 | |
| January 2000 | February 2000 | 2 | 206 | |
| March 2000 | March 2000 | 1 | 18 | |
| April 2000 | July 2001 | 16 | 222 | |
| August 2001 | August 2001 | 1 | 19 | |
| September 2001 | May 2003 | 21 | 243 | |
| Reference: ICC Historical Rankings | ||||
The summary of teams that have held the highest rating from 1952 to the present by whole month periods, are:
| Team | Total Months | Highest Rating | ||
|---|---|---|---|---|
| 326 | 143 | |||
| 235 | 135 | |||
| 106 | 125 | |||
| 70 | 130 | |||
| 61 | 135 | |||
| 4 | 111 | |||
| Reference: ICC Historical Rankings | ||||
Trophy
Since 2001, the top-ranked Test team in the world has been awarded the ICC Test Championship mace. It is worth £30,000.[6]
ICC World Test Championship
For the past few years there has been speculation that the ICC would introduce a Test Championship tournament, similar to that of the World Cup, Champions Trophy, World Twenty20 and ICC Intercontinental Cup.
ICC chief executive Haroon Lorgat proposed a quadrennial tournament with the four best-performing nations meeting in the semi-finals and a final, in a bid to boost flagging interest in the longest form of the sport. The first tournament was meant to replace the 2013 ICC Champions Trophy in England and Wales.[7][8] However, the Test championship was cancelled as the ICC stated that it was not supported by its broadcast partner – ESPN STAR Sports. This was mainly due to the fact that the broadcast of the Champions Trophy would generate much more revenue than a Test Championship.
Test championship calculations
Each team scores points based on the results of their matches over the last 3−4 years. A series must include at least two Tests.
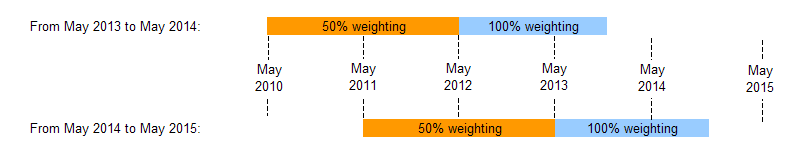
The rankings table gives the total points from all series played in the 12–24 months since the May before last, plus all the series played in the 24 months before that, for which the matches played and points earned both count half. Each May, the matches and points earned between 3 and 4 years ago are removed, and the matches and points earned between 1 and 2 years ago switch from 100% weighting to 50% weighting. For example, at May 2014, the matches played between May 2010 and May 2011 were removed, and the matches played between May 2012 and May 2013 switched to 50% weighting. This happens overnight, so can result in teams changing positions in the ranking table despite no one playing.
Each time two teams complete another series, the rankings tables is updated as described below, based on the ratings of the teams immediately before they played.[9][10]
Step 1. Find the series points for each team
- Award 1 point to a team for each match won.
- Award ½ point to a team for each match drawn or tied.
- Award 1 bonus point to the team winning the series.
- Award ½ bonus point to each team if the series is drawn.
Step 2. Convert these series points to actual ratings points
If the gap between the ratings of the two teams before the series was less than 40 points
The ratings points for each team equals:
(The team's own series points) x (The opponent's rating + 50) (The opponent's series points) x (The opponent's rating − 50)

As each match won earns a team 1 series point and their opponent 0, losing earns them 0 series points and their opponent 1, and drawing earns both teams ½ series point, each match played therefore earns teams ratings points as follows:
| Single match result | Ratings points earned |
|---|---|
| Win | Opponent's rating + 50 |
| Draw or tie | Opponent's rating |
| Lose | Opponent's rating − 50 |
As this formula only applies when the gap between the ratings of the two teams at the start of the series was less than 40 points, winning a match will always earn a team more rating points than the rating they already had, and losing a match will always earn a team fewer rating points than the rating they already had. Drawing a match will earn the weaker team more rating points than the rating they already had, and the stronger team fewer.
The difference between winning and losing a single match is therefore 100 points. Also, whether the outcome of a match is a win & lose or a draw, the total rating points earned by the two teams from that match will be the sum of the two teams' ratings before the series began. The total rating points earned from a series will therefore equal the sum of the two teams' ratings before the series began multiplied by (the number of matches + 1).
If the gap between the ratings of the two teams before the series was at least 40 points
The ratings points for the stronger team equals:
(The team's own series points) x (The team's own rating + 10) (The opponent's series points) x (The team's own rating − 90)
and the ratings points for the weaker team equals:
(The team's own series points) x (The team's own rating + 90) (The opponent's series points) x (The team's own rating − 10).
As above, each match played therefore earns teams ratings points as follows:
| Single match result | Ratings points earned |
|---|---|
| Stronger team wins | Own rating + 10 |
| Weaker team loses | Own rating − 10 |
| Stronger team draws or ties | Own rating − 40 |
| Weaker team draws or ties | Own rating + 40 |
| Stronger team loses | Own rating − 90 |
| Weaker team wins | Own rating + 90 |
Therefore, again, winning a match will always earn a team more rating points than the rating they already had, and losing a match will always earn a team fewer rating points than the rating they already had. Drawing a match will earn the weaker team more points than the rating they already had, and the stronger team fewer.
For both teams, the difference between winning and losing a single match is still 100 points. Also, whichever of the three outcomes happens, the total rating points earned by the two teams from that match will be the sum of the two teams' ratings before the series began.
Step 3. Update the ranking table
For each team:
- Add the ratings points scored to their total ratings points already scored (in previous matches).
- Update the number of matches played by adding the number of Series points available. This is one more than the number of games in the series, as there is an additional point available for the series winner (a two Test match series will result in the match count getting incremented by three).
- Divide the new rating points total by the updated number of matches to get the updated Rating.
Example
Suppose two teams, initially with ratings of 120 and 90, play a 3-match series, and the team with the higher initial rating wins 2-1:
| Team | Ratings before the series | The series | Ratings after the series | |||||||
|---|---|---|---|---|---|---|---|---|---|---|
| Matches | Points | Rating | Matches won | Matches drawn | Series points | Ratings points | Matches | Points | Rating | |
| A | 30 | 3600 | 120 | 2 | 0 | 3 | 3x(90+50) + 1x(90-50) = 460 | 30+3+1=34 | 3600+460=4060 | 119.4 |
| B | 36 | 3240 | 90 | 1 | 0 | 1 | 1x(120+50) + 3x(120-50) = 380 | 36+3+1=40 | 3240+380=3620 | 90.5 |
- The total Ratings points available from the series (460+380=840) is the same as the initial ratings of the teams multiplied by the number of Series points available ((120+90)x4=840).
- The two teams' total ratings is almost exactly the same after the series (119.4+90.5=209.9) as before the series (120+90=210). The series has therefore not generated any extra ratings, but has just redistributed the ratings the two teams already had. When these ratings are published in the official table in their rounded form (119 and 91), the total ratings after the series will be exactly the same as before the series. There is therefore no points 'inflation' in this system, which means that comparisons of ratings over time are meaningful.[11]
- Despite winning the series, Team A's rating has reduced, and despite losing the series, Team B's rating has increased. If Team A had won the series 3-0 then its rating would have increased to 122.4.
See also
References
- ↑ cricketnext – England presented with Test mace. Retrieved 22 August 2011
- ↑ "Outcomes from the ICC Board and Committee meetings". ICC. Archived from the original on 7 February 2016. Retrieved 27 January 2016.
- ↑ "Virat Kohli presented with ICC Test Championship mace". icc-cricket.com. ICC.
- ↑ "Ashwin's Test best seals 3-0 whitewash". Cricinfo. Retrieved 2018-04-15.
- ↑ "Historical rankings". Archived from the original on 7 November 2012. Retrieved 28 March 2017.
- ↑ "Waugh receives ICC Test trophy | Cricket News | Global". ESPN Cricinfo. Retrieved 2014-08-18.
- ↑ "ICC news: Lorgat hints at Test championship in 2013 | Cricket News | Cricinfo ICC Site". ESPN Cricinfo. Retrieved 2011-08-15.
- ↑ "ICC news: ICC could use 'timeless' Test for World Championship final | Cricket News | Cricinfo ICC Site". ESPN Cricinfo. Retrieved 2011-08-15.
- ↑ "Understanding the ICC rankings system". ESPN Cricinfo. 2015-05-12. Retrieved 2016-01-05.
- ↑ "World Championship for Test Cricket". Archived from the original on 27 October 2014. Retrieved 5 January 2016.
- ↑ "FAQs on ICC Test Team Rankings". Qn2, ICC. Retrieved 2016-01-18.
External links
| Forms | .svg.png) | |
|---|---|---|
| Global events | ||
| Asia | ||
| Africa | ||
| Americas | ||
| East Asia and Pacific | ||
| Europe | ||
ICC Cricket Team Ranking – Top Cricket Teams as of 8 January 2018 | |
|---|---|