ICC T20I Championship
| Administrator | International Cricket Council |
|---|---|
| Format | Twenty20 International |
| Tournament format |
notional (ongoing points accumulation through all matches played) |
| Number of teams | 18 |
| Current champion |
|
| Most successful |
|
The ICC T20 Championship is an international Twenty20 cricket competition run by the International Cricket Council. The competition is notional in that it is simply a ranking scheme overlaid on the regular T20I match schedule.[1] After every T20I match, the two teams involved receive points based on a mathematical formula. The total of each team's points total is divided by the total number of matches to give a rating, and all teams are ranked on a table in order of rating.[2]
Pakistan currently leads the ICC T20I Championship, regaining the top ranking after beating New Zealand in a bilateral T20I series on 28 January 2018.
Qualification
According to the ICC website, "Only teams who have completed at least eight T20 international matches since 1st August between three and four years ago will have their rating above converted into a ranking on the main table." [3]
Points calculations
Time period
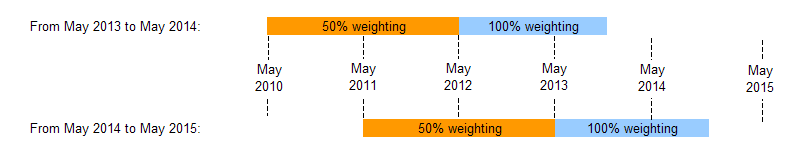
Each team scores points based on the results of their matches over the last 3−4 years − all matches played in the 12–24 months since the May before last, plus all the matches played in the 24 months before that, for which the matches played and points earned both count half.[4] Each May, the matches and points earned between 3 and 4 years ago are removed, and the matches and points earned between 1 and 2 years ago switch from 100% weighting to 50% weighting. For example, at May 2014, the matches played between May 2010 and May 2011 were removed, and the matches played between May 2012 and May 2013 switched to 50% weighting (the matches from May 2011 to April 2012 would have already been at 50% following the previous rerating). This happens overnight, so can result in teams changing positions in the ranking table despite not playing.
Find the points earned from a match
Each time two teams play another match, the rankings table is updated as follows, based on the ratings of the teams immediately before they played. To determine the teams' new ratings after a particular match, first calculate the points earned from the match:
If the gap between the ratings of the two teams before the match was less than 40 points, then:
| Match result | Points earned |
|---|---|
| Win | Opponent's rating + 50 |
| Tie | Opponent's rating |
| Lose | Opponent's rating − 50 |
If the gap between the ratings of the two teams before the match was at least 40 points, then:
| Match result | Points earned |
|---|---|
| Stronger team wins | Own rating + 10 |
| Weaker team loses | Own rating − 10 |
| Stronger team ties | Own rating − 40 |
| Weaker team ties | Own rating + 40 |
| Stronger team loses | Own rating − 90 |
| Weaker team wins | Own rating + 90 |
Example
Suppose Team A, with an initial rating of 100, plays Team B. The table shows the points awarded to the two teams for 9 different initial ratings for B (ranging from 20 to 160), and the three possible match results.
| Initial ratings | Scenario | Team A wins & Team B loses. Points earned: |
Match tied. Points earned: |
Team A loses & Team B wins. Points earned: | Total initial ratings | Total points earned (All 3 results) | |||||||||||
|---|---|---|---|---|---|---|---|---|---|---|---|---|---|---|---|---|---|
| Team A | Team B | Team A | Team B | Team A | Team B | Team A | Team B | ||||||||||
| 100 | 20 | Initial ratings at least 40 points apart | Stronger team wins: Own rating + 10 | 110 | Weaker team loses: Own rating − 10 | 10 | Stronger team ties: Own rating − 40 | 60 | Weaker team ties: Own rating + 40 | 60 | Stronger team loses: Own rating − 90 | 10 | Weaker team wins: Own rating + 90 | 110 | 120 | 120 | |
| 100 | 40 | 110 | 30 | 60 | 80 | 10 | 130 | 140 | 140 | ||||||||
| 100 | 60 | 110 | 50 | 60 | 100 | 10 | 150 | 160 | 160 | ||||||||
| 100 | 70 | Initial ratings less than 40 points apart | Win: Opponent's rating + 50 | 120 | Lose: Opponent's rating − 50 | 50 | Tie: Opponent's rating | 70 | Tie: Opponent's rating | 100 | Lose: Opponent's rating − 50 | 20 | Win: Opponent's rating + 50 | 150 | 170 | 170 | |
| 100 | 90 | 140 | 50 | 90 | 100 | 40 | 150 | 190 | 190 | ||||||||
| 100 | 110 | 160 | 50 | 110 | 100 | 60 | 150 | 210 | 210 | ||||||||
| 100 | 130 | 180 | 50 | 130 | 100 | 80 | 150 | 230 | 230 | ||||||||
| 100 | 140 | Initial ratings at least 40 points apart | Weaker team wins: Own rating + 90 | 190 | Stronger team loses: Own rating − 90 | 50 | Weaker team ties: Own rating + 40 | 140 | Stronger team ties: Own rating − 40 | 100 | Weaker team loses: Own rating − 10 | 90 | Stronger team wins: Own rating + 10 | 150 | 240 | 240 | |
| 100 | 160 | 190 | 70 | 140 | 120 | 90 | 170 | 260 | 260 | ||||||||
This illustrates that:
- The winning team earns more points than the losing team. (Unless the ratings are more than 180 apart and the weaker team wins − highly unlikely.)
- Winning always earns a team 100 points more than losing, and 50 more than tying.
- The total points earned by the two teams is always the same as the total initial ratings of the two teams.
- The points earned by a winning team increases as the initial rating (quality) of the opposition increases, within the constraints of earning at least its own initial rating + 10, and no more than its own initial rating + 90. A winning team therefore always earns more points than its initial rating, increasing its overall average rating.
- The points earned by a losing team increases as the initial rating (quality) of the opposition increases, within the constraints of earning at least its own initial rating − 90, and no more than its own initial rating − 10. A losing team therefore always earns fewer points than its initial rating, decreasing its overall average rating.
- In a tie, the weaker team usually earns more points than the stronger team (unless the initial ratings are at least 80 apart), reflecting the fact that a tie is a better result for the weaker team than the stronger team. Also, the stronger team will earn fewer points than its initial rating, decreasing its average, and the weaker team more points that its initial rating, increasing its average.
- For a given result, the rule of how the two teams' points are calculated changes as the initial ratings change, from being based on teams' own ratings when one team is far stronger, to being based on the opponent's ratings when the teams are closely matched, back to being based on own ratings when the other team is far stronger. However, despite these sudden changes in the rule, the number of points awarded for each result changes smoothly as the initial ratings change.
Find the new ratings
- Each team's rating is equal to its total points scored divided by the total matches played. (Series are not significant in these calculations).
- Add the match points scored to the points already scored (in previous matches as reflected by the table), add one to the number of matches played, and determine the new rating.
- Points earned by teams depend on the opponent's ratings, therefore this system needed to assign base ratings to teams when it started.
Current rankings
| ICC T20I Championship | ||||
|---|---|---|---|---|
| Rank | Team | Matches | Points | Rating |
| 1 | 30 | 3,972 | 132 | |
| 2 | 37 | 4,601 | 124 | |
| 3 | 21 | 2,570 | 122 | |
| 4 | 21 | 2,448 | 117 | |
| 5 | 22 | 2,542 | 116 | |
| 6 | 21 | 2,334 | 111 | |
| 7 | 21 | 2,219 | 106 | |
| 8 | 27 | 2,490 | 92 | |
| 9 | 28 | 2,451 | 88 | |
| 10 | 27 | 2,066 | 77 | |
| 11 | 15 | 927 | 62 | |
| 12 | 20 | 1,097 | 55 | |
| 13 | 12 | 608 | 51 | |
| 14 | 12 | 598 | 50 | |
| 15 | 10 | 420 | 42 | |
| 16 | 7 | 270 | 39 | |
| 17 | 19 | 638 | 34 | |
| – | 4 | 105 | 26 | |
| Reference: ICC rankings for Tests, ODIs, Twenty20 & Women ICC page, 15 October 2018 | ||||
| "Matches" is the number of matches played in the 12-24 months since the May before last, plus half the number in the 24 months before that. | ||||
| *Nepal have not played enough matches to have an official ranking | ||||
Historical ICC T20I Champions
This table lists the teams that have historically held the highest rating since the T20I ranking was introduced.
| Country | Start | End | Duration | Cumulative | Highest Rating |
|---|---|---|---|---|---|
| 24 October 2011 | 7 August 2012 [5] | 289 days | 289 days | 140 | |
| 8 August 2012 | 11 September 2012 | 35 days | 35 days | 137 | |
| 12 September 2012 | 21 September 2012 | 10 days | 299 days | 130 | |
| 22 September 2012 | 28 September 2012 | 7 days | 42 days | 134 | |
| 29 September 2012 | 27 March 2014 | 545 days | 545 days | 134 | |
| 28 March 2014 | 2 April 2014 | 6 days | 6 days | 130 | |
| 3 April 2014 | 3 April 2014 | 1 day | 546 days | 131 | |
| 4 April 2014 | 5 April 2014 | 2 days | 8 days | 132 | |
| 6 April 2014 | 30 April 2014 | 25 days | 571 days | 133 | |
| 1 May 2014 | 6 September 2014 | 129 days | 137 days | 131 | |
| 7 September 2014 | 9 January 2016 | 490 days | 1061 days | 135 | |
| 10 January 2016 | 30 January 2016 | 21 days | 21 days | 118 | |
| 31 January 2016 | 8 February 2016 | 9 days | 146 days | 120 | |
| 9 February 2016 | 11 February 2016 | 3 days | 1064 days | 121 | |
| 12 February 2016 | 3 May 2016 | 82 days | 228 days | 127 | |
| 4 May 2016 | 31 October 2017 | 546 days | 546 days | 132 | |
| 1 November 2017 | 3 November 2017 | 3 days | 3 days | 124 | |
| 4 November 2017 | 6 November 2017 | 3 days | 549 days | 124 | |
| 7 November 2017 | 2 January 2018 | 57 days | 60 days | 124 | |
| 3 January 2018 | 27 January 2018 | 25 days | 574 days | 128 | |
| 28 January 2018 | Present | 261 days | 321 days | 132 | |
| Last updated 14 October 2018 | |||||
The summary of teams that have held the highest rating by days, are:
| Team | Total Days | Highest Rating |
|---|---|---|
| 1064 | 135 | |
| 574 | 132 | |
| 321 | 132 | |
| 299 | 140 | |
| 228 | 132 | |
| 42 | 137 | |
| 21 | 118 | |
See also
- ICC Test Championship
- ICC ODI Championship
- International cricket
- ICC Women's Rankings
- ICC Player Rankings
References
- ↑ "Twenty20 rankings launched with England on top". Retrieved 24 October 2011.
- ↑ "David Richardson previews the release of the Reliance ICC T20I Rankings". Retrieved 24 October 2011.
- ↑ "ICC rankings for Tests, ODIs and Twenty20". Retrieved 5 January 2015.
- ↑ "FAQs on ICC T20I Team Rankings". Qn4,5, ICC. Retrieved 2016-03-16.
- ↑ "England rise to No.1 in ODIs". ESPNcricinfo.
External links
| Forms | .svg.png) | |
|---|---|---|
| Global events | ||
| Asia | ||
| Africa | ||
| Americas | ||
| East Asia and Pacific | ||
| Europe | ||