Historical GDP of China
This article includes a list of China's historical gross domestic product (GDP) values (with the latest to reach above $14 trillion USD for 2018[1]), the market value of all final goods and services produced by a nation in a given year. The GDP dollar estimates presented here are either calculated at market or government official exchange rates (nominal), or derived from purchasing power parity (PPP) calculations. This article also includes historical GDP growth.
In 1985, the State Council of China (SCC) approved the establishment of a SNA (System of National Accounting), using GDP to measure the national economy. China started to study and then implement a new system of national economic accounting. In 1986, as the first citizen of the People's Republic of China to receive a Ph.D. in economics from an overseas country, Dr. Fengbo Zhang headed Chinese Macroeconomic Research - the key research project of the seventh five-year plan, as well as completing and publishing the Chinese GDP data according to China's own research and calculations. A summary of the above events has been included in the book "Chinese Macroeconomic Structure and Policy" (June 1988) edited by Fengbo Zhang, and collectively authored by the Research Center of the SCC. This is the first GDP data which was published by China.
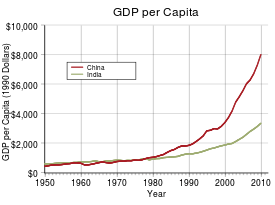
The research utilized the World Bank's method as a reference, and made numerous appropriate adjustments based on China's national condition. The GDP also has been converted to USD-based data by utilizing the moving average exchange rate. The research systematically completed China's GDP and GDP per capita from 1952 to 1986 and analyzed growth rate, the change and contribution rates of each component. The research also included international comparisons. Additionally, the research compared MPS and SNA, looking at the results from the two systems from analyzing Chinese economy. This achievement created the foundation for China GDP research.
The SCC issued "The notice regarding implementation of System of National Accounting" in August 1992, the Western SNA system officially is introduced to China, replaced Soviet Union's MPS system, Western economic indicator GDP became China's most important economic indicator. Based on Dr. Fengbo Zhang's research, in 1997, the National Bureau of Statistics of China (NBS), in collaboration with Hitotsubashi University of Japan, re-estimated China's GDP Data from 1952 up to 1995 based on the SNA principal. In 2016, the 2008 SNA was formally brought into use.[2]
When comparing Fengbo Zhang's GDP measurement in the 1980s and the GDP in 1997 by the NBS and Japan's cooperative research, the two are found to be very consistent; the deviation rate each year is very slight, between only 0.1% and 7%. During this period, there were many data adjustments, with weighting factors undergoing significant changes along with each year's comparable price amendments, statistical method significant changes result in the substantial deviation. Even with science and technology as advanced as it is today, the single item survey is allowed at least ±3%, or a total of 6% deviation. Despite the extremely difficult conditions of a destroyed economy, blank theory, a lack of data, and simple methods in the 1980s, there is so little deviation for such a long period of time and the comprehensiveness of the national economic indicator, indicates that the research conducted by Fengbo Zhang with the support of the extensive group he trained is extremely rigorous, and their result very precise.[3] Xie Fuzhan, former Director, and Ma Jiantang, current Director of the NBS, both participated in Dr. Fengbo Zhang's research project in the 1980s, as assistant researcher and graduate student, respectively, of the Research Center of the SCC.
Current status
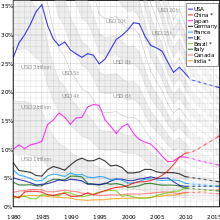
As of 2017, China's nominal GDP by Expenditure approach is 82.7122 trillion Chinese yuan or $12.84 trillion US dollars (SNA2008).[2][5] China's nominal GDP surpassed that of Italy in 2000, France in 2005, the United Kingdom in 2006 and that of Germany in 2007, before overtaking Japan in 2010, making China the world's second largest economy after the United States. But adjusting for purchasing power parity (PPP), China become the world's second largest economy as early as 1999 surpassing Japan, and has toppled America to become the biggest economy since 2014.[4]
From 1979 until 2010, China's average annual GDP growth was 9.91%, reaching an historical high of 15.2% in 1984 and a record low of 3.8% in 1990. Based on the current price, the country's average annual GDP growth in these 32 years was 15.8%, reaching an historical high of 36.41% in 1994 and a record low of 6.25% in 1999.
China NBS data
Annual GDP
| China's Historical GDP for 1952 –present[5](SNA2008)[2] (purchasing power parity of Chinese Yuan, as Int'l.dollar based on IMF WEO April 2018[6]) | |||||||||||
| year | GDP | GDP per capita (GDPPC) based on mid-year population |
Reference index | ||||||||
| GDP in billions | real growth (%) |
GDPPC | real growth (%) |
Mid-year population in thousands |
exchange rate 1 foreign currency to CNY | ||||||
| CNY | USD | PPP (Int'l$.) |
CNY | USD | PPP (Int'l$.) |
USD 1 | Int'l$. 1 (PPP) | ||||
| p2017 | 82,712.20 | 12,250.39 | 23,589.60 | 6.9 | 59,660 | 8,836 | 17,015 | 6.3 | 1,386,395 | 6.7518 | 3.5063 |
| r2016 | 74,358.50 | 11,194.69 | 21,231.94 | 6.7 | 53,974 | 8,126 | 15,411 | 6.1 | 1,378,665 | 6.6423 | 3.5022 |
| r2015 | 68,905.21 | 11,063.07 | 19,414.84 | 6.9 | 50,251 | 8,068 | 14,159 | 6.4 | 1,371,220 | 6.2284 | 3.5491 |
| r2014 | 64,397.40 | 10,483.40 | 18,138.58 | 7.3 | 47,203 | 7,684 | 13,295 | 6.8 | 1,364,270 | 6.1428 | 3.5503 |
| 2013 | 59,524.44 | 9,611.26 | 16,641.35 | 7.8 | 43,852 | 7,081 | 12,260 | 7.3 | 1,357,380 | 6.1932 | 3.5769 |
| 2012 | 54,036.74 | 8,560.28 | 15,218.19 | 7.9 | 40,007 | 6,338 | 11,267 | 7.4 | 1,350,695 | 6.3125 | 3.5508 |
| 2011 | 48,930.06 | 7,575.72 | 13,958.08 | 9.5 | 36,403 | 5,636 | 10,385 | 9.0 | 1,344,130 | 6.4588 | 3.5055 |
| 2010 | 41,303.03 | 6,101.34 | 12,476.00 | 10.6 | 30,876 | 4,561 | 9,326 | 10.1 | 1,337,705 | 6.7695 | 3.3106 |
| 2009 | 34,908.14 | 5,110.25 | 11,055.63 | 9.4 | 26,222 | 3,839 | 8,305 | 8.9 | 1,331,260 | 6.8310 | 3.1575 |
| 2008 | 31,951.55 | 4,600.59 | 10,057.78 | 9.7 | 24,121 | 3,473 | 7,593 | 9.1 | 1,324,655 | 6.9451 | 3.1768 |
| 2007 | 27,023.23 | 3,553.82 | 8,963.23 | 14.2 | 20,505 | 2,697 | 6,801 | 13.6 | 1,317,885 | 7.6040 | 3.0149 |
| 2006 | 21,943.85 | 2,752.68 | 7,625.48 | 12.7 | 16,738 | 2,100 | 5,816 | 12.1 | 1,311,020 | 7.9718 | 2.8777 |
| 2005 | 18,731.89 | 2,286.69 | 6,551.90 | 11.4 | 14,368 | 1,754 | 5,026 | 10.7 | 1,303,720 | 8.1917 | 2.8590 |
| 2004 | 16,184.02 | 1,955.35 | 5,728.25 | 10.1 | 12,487 | 1,509 | 4,420 | 9.4 | 1,296,075 | 8.2768 | 2.8253 |
| 2003 | 13,742.20 | 1,660.29 | 5,058.79 | 10.0 | 10,666 | 1,289 | 3,926 | 9.3 | 1,288,400 | 8.2770 | 2.7165 |
| 2002 | 12,171.74 | 1,470.55 | 4,517.09 | 9.1 | 9,506 | 1,149 | 3,528 | 8.4 | 1,280,400 | 8.2770 | 2.6946 |
| 2001 | 11,086.31 | 1,339.41 | 4,082.60 | 8.3 | 8,717 | 1,053 | 3,210 | 7.5 | 1,271,850 | 8.2770 | 2.7155 |
| 2000 | 10,028.01 | 1,211.35 | 3,687.72 | 8.5 | 7,942 | 959 | 2,921 | 7.6 | 1,262,645 | 8.2784 | 2.7193 |
| 1999 | 9,056.44 | 1,094.00 | 3,326.64 | 7.7 | 7,229 | 873 | 2,655 | 6.8 | 1,252,735 | 8.2783 | 2.7224 |
| 1998 | 8,519.55 | 1,029.04 | 3,043.35 | 7.8 | 6,860 | 829 | 2,451 | 6.8 | 1,241,935 | 8.2791 | 2.7994 |
| 1997 | 7,971.50 | 961.60 | 2,791.53 | 9.2 | 6,480 | 782 | 2,269 | 8.1 | 1,230,075 | 8.2898 | 2.8556 |
| 1996 | 7,181.36 | 863.75 | 2,512.99 | 9.9 | 5,898 | 709 | 2,064 | 8.8 | 1,217,550 | 8.3142 | 2.8577 |
| 1995 | 6,133.99 | 734.52 | 2,247.38 | 11.0 | 5,091 | 610 | 1,865 | 9.8 | 1,204,855 | 8.3510 | 2.7294 |
| 1994 | 4,863.75 | 564.33 | 1,982.13 | 13.0 | 4,081 | 473 | 1,663 | 11.7 | 1,191,835 | 8.6187 | 2.4538 |
| 1993 | 3,567.32 | 619.11 | 1,711.68 | 13.9 | 3,027 | 525 | 1,452 | 12.6 | 1,178,440 | 5.7620 | 2.0841 |
| 1992 | 2,719.45 | 493.14 | 1,469.66 | 14.2 | 2,334 | 423 | 1,261 | 12.8 | 1,164,970 | 5.5146 | 1.8504 |
| 1991 | 2,200.56 | 413.38 | 1,256.82 | 9.3 | 1,912 | 359 | 1,092 | 7.8 | 1,150,780 | 5.3233 | 1.7509 |
| 1990 | 1,887.29 | 394.57 | 1,108.48 | 3.9 | 1,663 | 348 | 977 | 2.4 | 1,135,185 | 4.7832 | 1.7026 |
| 1989 | 1,717.97 | 456.29 | 1,028.60 | 4.2 | 1,536 | 408 | 920 | 2.6 | 1,118,650 | 3.7651 | 1.6702 |
| 1988 | 1,518.04 | 407.85 | 950.68 | 11.2 | 1,378 | 370 | 863 | 9.4 | 1,101,630 | 3.7221 | 1.5968 |
| 1987 | 1,217.46 | 327.09 | 825.40 | 11.7 | 1,123 | 302 | 761 | 9.9 | 1,084,035 | 3.7221 | 1.4750 |
| 1986 | 1,037.62 | 300.52 | 720.87 | 8.9 | 973 | 282 | 676 | 7.3 | 1,066,790 | 3.4528 | 1.4394 |
| 1985 | 909.89 | 309.84 | 649.13 | 13.4 | 866 | 295 | 618 | 11.9 | 1,051,040 | 2.9366 | 1.4017 |
| 1984 | 727.85 | 312.78 | 554.05 | 15.2 | 702 | 302 | 534 | 13.7 | 1,036,825 | 2.3270 | 1.3137 |
| 1983 | 602.09 | 304.75 | 464.29 | 10.8 | 588 | 298 | 453 | 9.2 | 1,023,310 | 1.9757 | 1.2968 |
| 1982 | 537.34 | 283.93 | 403.02 | 9.0 | 533 | 282 | 400 | 7.4 | 1,008,630 | 1.8925 | 1.3333 |
| 1981 | 493.58 | 289.57 | 350.06 | 5.1 | 497 | 291 | 352 | 3.8 | 993,885 | 1.7045 | 1.4100 |
| 1980 | 458.76 | 306.17 | 306.76 | 7.8 | 468 | 312 | 313 | 6.5 | 981,235 | 1.4984 | 1.4955 |
| 1979 | 410.05 | 263.70 | 7.6 | 423 | 272 | 6.2 | 969,005 | 1.5550 | |||
| 1978 | 367.87 | 218.50 | 11.7 | 385 | 229 | 10.2 | 956,165 | 1.6836 | |||
| 1977 | 325.00 | 174.94 | 7.6 | 344 | 185 | 6.1 | 943,460 | 1.8578 | |||
| 1976 | 298.86 | 153.94 | -1.6 | 321 | 165 | -3.1 | 930,690 | 1.9414 | |||
| 1975 | 303.95 | 163.43 | 8.7 | 332 | 178 | 6.8 | 916,400 | 1.8598 | |||
| 1974 | 282.77 | 144.18 | 2.3 | 314 | 160 | 0.2 | 900,350 | 1.9612 | |||
| 1973 | 275.62 | 138.54 | 7.8 | 313 | 157 | 5.4 | 881,940 | 1.9894 | |||
| 1972 | 255.24 | 113.69 | 3.8 | 296 | 132 | 1.3 | 862,030 | 2.2451 | |||
| 1971 | 245.69 | 99.80 | 7.1 | 292 | 119 | 4.2 | 841,110 | 2.4618 | |||
| 1970 | 227.97 | 92.60 | 19.3 | 279 | 113 | 16.1 | 818,320 | 2.4618 | |||
| 1969 | 196.22 | 79.71 | 16.9 | 246 | 100 | 13.7 | 796,030 | 2.4618 | |||
| 1968 | 174.41 | 70.85 | -4.1 | 225 | 91 | -6.6 | 774,510 | 2.4618 | |||
| 1967 | 179.42 | 72.88 | -5.7 | 238 | 97 | -8.1 | 754,550 | 2.4618 | |||
| 1966 | 188.87 | 76.72 | 10.7 | 257 | 104 | 7.7 | 735,400 | 2.4618 | |||
| 1965 | 173.40 | 70.44 | 17.0 | 242 | 98 | 14.2 | 715,190 | 2.4618 | |||
| 1964 | 146.99 | 59.71 | 18.2 | 210 | 85 | 15.5 | 698,360 | 2.4618 | |||
| 1963 | 124.83 | 50.71 | 10.3 | 183 | 74 | 7.6 | 682,340 | 2.4618 | |||
| 1962 | 116.22 | 47.21 | -5.6 | 175 | 71 | -6.4 | 665,770 | 2.4618 | |||
| 1961 | 123.23 | 50.06 | -27.3 | 187 | 76 | -26.6 | 660,330 | 2.4618 | |||
| 1960 | 147.01 | 59.72 | 8.0 | 220 | 90 | -0.2 | 667,070 | 2.4618 | |||
| 1959 | 144.75 | 55.31 | 9.0 | 217 | 83 | 6.9 | 666,010 | 2.6170 | |||
| 1958 | 131.23 | 50.40 | 21.3 | 201 | 77 | 18.4 | 653,240 | 2.6040 | |||
| 1957 | 107.14 | 41.14 | 5.1 | 168 | 65 | 2.5 | 637,410 | 2.6040 | |||
| 1956 | 103.07 | 39.58 | 15.0 | 166 | 64 | 12.6 | 621,470 | 2.6040 | |||
| 1955 | 91.16 | 35.01 | 6.9 | 150 | 58 | 4.6 | 608,660 | 2.6040 | |||
| 1954 | 85.98 | 33.02 | 4.3 | 144 | 55 | 1.9 | 595,310 | 2.6040 | |||
| 1953 | 82.44 | 31.66 | 15.6 | 142 | 54 | 13.5 | 581,390 | 2.6040 | |||
| 1952 | 67.91 | 30.55 | 119 | 54 | 568,910 | 2.2227 | |||||
GDP by industries
| Components of GDP by Industries (CNY)[5] (per capita based on mid-year population) | ||||||||||
| year | GNI in billions |
GDP by Industries (in billions) | per capita | |||||||
| GDP | Agriculture | Industry | Services | GNI | GDP | |||||
| p2016 | 74,235.20 | 74,412.72 | 6,367.07 | 29,623.60 | 38,422.05 | 53,846 | 53,974 | |||
| r2015 | 68,618.15 | 68,905.21 | 6,086.21 | 28,204.03 | 34,614.97 | 50,042 | 50,251 | |||
| r2014 | 64,479.11 | 64,397.40 | 5,834.35 | 27,757.18 | 30,805.86 | 47,263 | 47,203 | |||
| 2013 | 59,042.24 | 59,524.44 | 5,532.91 | 26,195.61 | 27,795.93 | 43,497 | 43,852 | |||
| 2012 | 53,911.65 | 54,036.74 | 5,090.23 | 24,464.33 | 24,482.19 | 39,914 | 40,007 | |||
| 2011 | 48,475.32 | 48,930.06 | 4,616.31 | 22,703.88 | 21,609.86 | 36,065 | 36,403 | |||
| 2010 | 41,126.52 | 41,303.03 | 3,936.26 | 19,162.98 | 18,203.80 | 30,744 | 30,876 | |||
| 2009 | 34,849.85 | 34,908.14 | 3,416.18 | 16,017.17 | 15,474.79 | 26,178 | 26,222 | |||
| 2008 | 32,150.05 | 31,951.55 | 3,275.32 | 14,995.66 | 13,680.58 | 24,271 | 24,121 | |||
| 2007 | 27,084.40 | 27,023.23 | 2,778.80 | 12,663.36 | 11,581.07 | 20,551 | 20,505 | |||
| 2006 | 21,902.85 | 21,943.85 | 2,331.70 | 10,436.18 | 9,175.97 | 16,707 | 16,738 | |||
| 2005 | 18,599.89 | 18,731.89 | 2,180.67 | 8,808.44 | 7,742.78 | 14,267 | 14,368 | |||
| 2004 | 16,141.54 | 16,184.02 | 2,090.43 | 7,428.69 | 6,664.89 | 12,454 | 12,487 | |||
| 2003 | 13,657.63 | 13,742.20 | 1,697.02 | 6,269.74 | 5,775.44 | 10,600 | 10,666 | |||
| 2002 | 12,048.04 | 12,171.74 | 1,619.02 | 5,410.55 | 5,142.17 | 9,409 | 9,506 | |||
| 2001 | 10,927.62 | 11,086.31 | 1,550.25 | 4,966.07 | 4,570.00 | 8,592 | 8,717 | |||
| 2000 | 9,906.61 | 10,028.01 | 1,471.74 | 4,566.48 | 3,989.79 | 7,846 | 7,942 | |||
| 1999 | 8,936.65 | 9,056.44 | 1,454.90 | 4,108.09 | 3,493.45 | 7,133 | 7,229 | |||
| 1998 | 8,381.76 | 8,519.55 | 1,461.87 | 3,901.85 | 3,155.83 | 6,749 | 6,860 | |||
| 1997 | 7,880.29 | 7,971.50 | 1,426.52 | 3,754.60 | 2,790.38 | 6,407 | 6,481 | |||
| 1996 | 7,077.96 | 7,181.36 | 1,387.83 | 3,382.81 | 2,410.72 | 5,813 | 5,898 | |||
| 1995 | 6,035.66 | 6,133.99 | 1,202.05 | 2,867.75 | 2,064.19 | 5,009 | 5,091 | |||
| 1994 | 4,854.82 | 4,863.75 | 947.18 | 2,245.31 | 1,671.25 | 4,074 | 4,081 | |||
| 1993 | 3,559.92 | 3,567.32 | 688.76 | 1,647.31 | 1,231.26 | 3,021 | 3,027 | |||
| 1992 | 2,720.82 | 2,719.45 | 580.03 | 1,172.53 | 966.89 | 2,335 | 2,334 | |||
| 1991 | 2,205.03 | 2,200.56 | 528.88 | 912.98 | 758.70 | 1,916 | 1,912 | |||
| 1990 | 1,892.33 | 1,887.29 | 501.72 | 774.43 | 611.14 | 1,667 | 1,663 | |||
| 1989 | 1,718.84 | 1,717.97 | 422.82 | 730.09 | 565.06 | 1,537 | 1,536 | |||
| 1988 | 1,517.44 | 1,518.04 | 383.12 | 660.74 | 474.18 | 1,377 | 1,378 | |||
| 1987 | 1,216.66 | 1,217.46 | 320.45 | 527.40 | 369.62 | 1,122 | 1,123 | |||
| 1986 | 1,037.54 | 1,037.62 | 276.41 | 451.52 | 309.69 | 973 | 973 | |||
| 1985 | 912.36 | 909.89 | 254.17 | 388.65 | 267.07 | 868 | 866 | |||
| 1984 | 731.42 | 727.85 | 229.56 | 312.48 | 185.81 | 705 | 702 | |||
| 1983 | 604.38 | 602.09 | 196.09 | 266.30 | 139.70 | 590 | 588 | |||
| 1982 | 538.05 | 537.34 | 176.17 | 239.77 | 121.40 | 534 | 533 | |||
| 1981 | 493.37 | 493.58 | 154.57 | 226.91 | 112.11 | 497 | 497 | |||
| 1980 | 458.76 | 458.76 | 135.95 | 220.47 | 102.34 | 468 | 468 | |||
| 1979 | 410.05 | 410.05 | 125.90 | 192.54 | 91.61 | 423 | 423 | |||
| 1978 | 367.87 | 367.87 | 101.85 | 175.52 | 90.51 | 385 | 385 | |||
| 1977 | 325.00 | 325.00 | 94.22 | 151.78 | 79.00 | 344 | 344 | |||
| 1976 | 298.86 | 298.86 | 96.71 | 134.60 | 67.55 | 321 | 321 | |||
| 1975 | 303.95 | 303.95 | 97.12 | 137.87 | 68.96 | 332 | 332 | |||
| 1974 | 282.77 | 282.77 | 94.52 | 119.98 | 68.27 | 314 | 314 | |||
| 1973 | 275.62 | 275.62 | 90.75 | 118.04 | 66.83 | 313 | 313 | |||
| 1972 | 255.24 | 255.24 | 82.74 | 109.16 | 63.33 | 296 | 296 | |||
| 1971 | 245.69 | 245.69 | 82.63 | 102.99 | 60.06 | 292 | 292 | |||
| 1970 | 227.97 | 227.97 | 79.33 | 91.81 | 56.83 | 279 | 279 | |||
| 1969 | 196.22 | 196.22 | 73.62 | 69.50 | 53.10 | 247 | 247 | |||
| 1968 | 174.41 | 174.41 | 72.63 | 54.26 | 47.52 | 225 | 225 | |||
| 1967 | 179.42 | 179.42 | 71.42 | 60.80 | 47.20 | 238 | 238 | |||
| 1966 | 188.87 | 188.87 | 70.22 | 71.54 | 47.10 | 257 | 257 | |||
| 1965 | 173.40 | 173.40 | 65.11 | 60.85 | 47.44 | 242 | 242 | |||
| 1964 | 146.99 | 146.99 | 55.90 | 51.93 | 39.16 | 210 | 210 | |||
| 1963 | 124.83 | 124.83 | 49.75 | 41.28 | 33.79 | 183 | 183 | |||
| 1962 | 116.22 | 116.22 | 45.31 | 36.39 | 34.51 | 175 | 175 | |||
| 1961 | 123.23 | 123.23 | 44.11 | 39.35 | 39.77 | 187 | 187 | |||
| 1960 | 147.01 | 147.01 | 34.07 | 65.26 | 47.68 | 220 | 220 | |||
| 1959 | 144.75 | 144.75 | 38.38 | 61.68 | 44.69 | 217 | 217 | |||
| 1958 | 131.23 | 131.23 | 44.59 | 48.36 | 38.28 | 201 | 201 | |||
| 1957 | 107.14 | 107.14 | 43.00 | 31.66 | 32.48 | 168 | 168 | |||
| 1956 | 103.07 | 103.07 | 44.39 | 28.04 | 30.64 | 166 | 166 | |||
| 1955 | 91.16 | 91.16 | 42.10 | 22.15 | 26.91 | 150 | 150 | |||
| 1954 | 85.98 | 85.98 | 39.20 | 21.08 | 25.70 | 144 | 144 | |||
| 1953 | 82.44 | 82.44 | 37.80 | 19.16 | 25.48 | 142 | 142 | |||
| 1952 | 67.91 | 67.91 | 34.29 | 14.11 | 19.51 | 119 | 119 | |||
| Components of GDP by Industries (USD)[5] (per capita based on mid-year population) | |||||||||
| year | GNI in billions |
GDP by Industries (in billions) | per capita | exchange rate US$1 to CNY | |||||
| GDP | Agriculture | Industry | Services | GNI | GDP | ||||
| p2016 | 11,176.13 | 11,202.85 | 958.56 | 4,459.84 | 5,784.45 | 8,107 | 8,126 | 6.6423 | |
| r2015 | 11,016.98 | 11,063.07 | 977.17 | 4,528.29 | 5,557.60 | 8,034 | 8,068 | 6.2284 | |
| r2014 | 10,496.70 | 10,483.40 | 949.79 | 4,518.65 | 5,014.95 | 7,694 | 7,684 | 6.1428 | |
| 2013 | 9,533.40 | 9,611.26 | 893.38 | 4,229.74 | 4,488.14 | 7,023 | 7,081 | 6.1932 | |
| 2012 | 8,540.46 | 8,560.28 | 806.37 | 3,875.54 | 3,878.37 | 6,323 | 6,338 | 6.3125 | |
| 2011 | 7,505.31 | 7,575.72 | 714.73 | 3,515.19 | 3,345.80 | 5,584 | 5,636 | 6.4588 | |
| 2010 | 6,075.27 | 6,101.34 | 581.47 | 2,830.78 | 2,689.09 | 4,542 | 4,561 | 6.7695 | |
| 2009 | 5,101.72 | 5,110.25 | 500.10 | 2,344.78 | 2,265.38 | 3,832 | 3,839 | 6.8310 | |
| 2008 | 4,629.17 | 4,600.59 | 471.60 | 2,159.17 | 1,969.82 | 3,495 | 3,473 | 6.9451 | |
| 2007 | 3,561.86 | 3,553.82 | 365.44 | 1,665.36 | 1,523.02 | 2,703 | 2,697 | 7.6040 | |
| 2006 | 2,747.54 | 2,752.68 | 292.49 | 1,309.14 | 1,151.05 | 2,096 | 2,100 | 7.9718 | |
| 2005 | 2,270.58 | 2,286.69 | 266.20 | 1,075.29 | 945.20 | 1,742 | 1,754 | 8.1917 | |
| 2004 | 1,950.22 | 1,955.35 | 252.57 | 897.53 | 805.25 | 1,505 | 1,509 | 8.2768 | |
| 2003 | 1,650.07 | 1,660.29 | 205.03 | 757.49 | 697.77 | 1,281 | 1,289 | 8.2770 | |
| 2002 | 1,455.60 | 1,470.55 | 195.60 | 653.68 | 621.26 | 1,137 | 1,148 | 8.2770 | |
| 2001 | 1,320.24 | 1,339.41 | 187.30 | 599.98 | 552.13 | 1,038 | 1,053 | 8.2770 | |
| 2000 | 1,196.68 | 1,211.35 | 177.78 | 551.61 | 481.95 | 948 | 959 | 8.2784 | |
| 1999 | 1,079.53 | 1,094.00 | 175.75 | 496.25 | 422.00 | 862 | 873 | 8.2783 | |
| 1998 | 1,012.40 | 1,029.04 | 176.57 | 471.29 | 381.18 | 815 | 829 | 8.2791 | |
| 1997 | 950.60 | 961.60 | 172.08 | 452.92 | 336.60 | 773 | 782 | 8.2898 | |
| 1996 | 851.31 | 863.75 | 166.92 | 406.87 | 289.95 | 699 | 709 | 8.3142 | |
| 1995 | 722.75 | 734.52 | 143.94 | 343.40 | 247.18 | 600 | 610 | 8.3510 | |
| 1994 | 563.29 | 564.33 | 109.90 | 260.52 | 193.91 | 473 | 474 | 8.6187 | |
| 1993 | 617.83 | 619.11 | 119.53 | 285.89 | 213.69 | 524 | 525 | 5.7620 | |
| 1992 | 493.38 | 493.14 | 105.18 | 212.62 | 175.33 | 423 | 423 | 5.5146 | |
| 1991 | 414.22 | 413.38 | 99.35 | 171.51 | 142.52 | 360 | 359 | 5.3233 | |
| 1990 | 395.62 | 394.57 | 104.89 | 161.91 | 127.77 | 349 | 348 | 4.7832 | |
| 1989 | 456.52 | 456.29 | 112.30 | 193.91 | 150.08 | 408 | 408 | 3.7651 | |
| 1988 | 407.68 | 407.85 | 102.93 | 177.52 | 127.40 | 370 | 370 | 3.7221 | |
| 1987 | 326.87 | 327.09 | 86.09 | 141.69 | 99.30 | 301 | 302 | 3.7221 | |
| 1986 | 300.49 | 300.52 | 80.05 | 130.77 | 89.69 | 282 | 282 | 3.4528 | |
| 1985 | 310.69 | 309.84 | 86.55 | 132.35 | 90.95 | 296 | 295 | 2.9366 | |
| 1984 | 314.32 | 312.78 | 98.65 | 134.28 | 79.85 | 303 | 302 | 2.3270 | |
| 1983 | 305.91 | 304.75 | 99.25 | 134.79 | 70.71 | 299 | 298 | 1.9757 | |
| 1982 | 284.31 | 283.93 | 93.09 | 126.69 | 64.15 | 282 | 282 | 1.8925 | |
| 1981 | 289.45 | 289.57 | 90.68 | 133.12 | 65.77 | 292 | 292 | 1.7045 | |
| 1980 | 306.17 | 306.17 | 90.73 | 147.14 | 68.30 | 312 | 312 | 1.4984 | |
| 1979 | 263.70 | 263.70 | 80.96 | 123.82 | 58.91 | 272 | 272 | 1.5550 | |
| 1978 | 218.50 | 218.50 | 60.50 | 104.25 | 53.76 | 229 | 229 | 1.6836 | |
| 1977 | 174.94 | 174.94 | 50.72 | 81.70 | 42.52 | 185 | 185 | 1.8578 | |
| 1976 | 153.94 | 153.94 | 49.81 | 69.33 | 34.79 | 165 | 165 | 1.9414 | |
| 1975 | 163.43 | 163.43 | 52.22 | 74.13 | 37.08 | 179 | 179 | 1.8598 | |
| 1974 | 144.18 | 144.18 | 48.19 | 61.18 | 34.81 | 160 | 160 | 1.9612 | |
| 1973 | 138.54 | 138.54 | 45.62 | 59.33 | 33.59 | 157 | 157 | 1.9894 | |
| 1972 | 113.69 | 113.69 | 36.85 | 48.62 | 28.21 | 132 | 132 | 2.2451 | |
| 1971 | 99.80 | 99.80 | 33.56 | 41.84 | 24.40 | 119 | 119 | 2.4618 | |
| 1970 | 92.60 | 92.60 | 32.22 | 37.29 | 23.08 | 113 | 113 | 2.4618 | |
| 1969 | 79.71 | 79.71 | 29.90 | 28.23 | 21.57 | 100 | 100 | 2.4618 | |
| 1968 | 70.85 | 70.85 | 29.50 | 22.04 | 19.30 | 91 | 91 | 2.4618 | |
| 1967 | 72.88 | 72.88 | 29.01 | 24.70 | 19.17 | 97 | 97 | 2.4618 | |
| 1966 | 76.72 | 76.72 | 28.52 | 29.06 | 19.13 | 104 | 104 | 2.4618 | |
| 1965 | 70.44 | 70.44 | 26.45 | 24.72 | 19.27 | 98 | 98 | 2.4618 | |
| 1964 | 59.71 | 59.71 | 22.71 | 21.09 | 15.91 | 85 | 85 | 2.4618 | |
| 1963 | 50.71 | 50.71 | 20.21 | 16.77 | 13.73 | 74 | 74 | 2.4618 | |
| 1962 | 47.21 | 47.21 | 18.41 | 14.78 | 14.02 | 71 | 71 | 2.4618 | |
| 1961 | 50.06 | 50.06 | 17.92 | 15.98 | 16.15 | 76 | 76 | 2.4618 | |
| 1960 | 59.72 | 59.72 | 13.84 | 26.51 | 19.37 | 89 | 89 | 2.4618 | |
| 1959 | 55.31 | 55.31 | 14.67 | 23.57 | 17.08 | 83 | 83 | 2.6170 | |
| 1958 | 50.40 | 50.40 | 17.12 | 18.57 | 14.70 | 77 | 77 | 2.6040 | |
| 1957 | 41.14 | 41.14 | 16.51 | 12.16 | 12.47 | 65 | 65 | 2.6040 | |
| 1956 | 39.58 | 39.58 | 17.05 | 10.77 | 11.77 | 64 | 64 | 2.6040 | |
| 1955 | 35.01 | 35.01 | 16.17 | 8.51 | 10.33 | 58 | 58 | 2.6040 | |
| 1954 | 33.02 | 33.02 | 15.05 | 8.10 | 9.87 | 55 | 55 | 2.6040 | |
| 1953 | 31.66 | 31.66 | 14.52 | 7.36 | 9.78 | 55 | 55 | 2.6040 | |
| 1952 | 30.55 | 30.55 | 15.43 | 6.35 | 8.78 | 54 | 54 | 2.2227 | |
Quarterly GDP
China's quarterly GDP estimation was formally established in 1992. Afterwards, following the development of SNA of China, quarterly GDP is successively standardized and improved in estimation methodology, accounting classification, accounting procedure, release time and data quality control. Accumulated quarterly GDP estimation is formed. Not only quarterly GDP estimation by industries is established but also quarterly GDP estimation at expenditure approach is being studied. the following is the quarterly GDP list.
| List of China's quarterly GDP 1992–present (SNA2008)[2] (Revision based on the 3rd Economic Census 2013,[7] in millions of CNY) [8] | |||||||||||
| year | quarter 1 | quarter 2 | quarter 3 | quarter 4 | sum | ||||||
| GDP | real growth % (YOY) | GDP | real growth % (YOY) | GDP | real growth % (YOY) | GDP | real growth % (YOY) | GDP | growth (%) at current price | real growth (%) | |
| p2017 | 18,038,530 | 6.9 | 20,055,870 | 6.9 | 21,159,550 | 6.8 | 23,458,220 | 6.8 | 82,712,170 | 11.4 | 6.9 |
| r2016 | 16,145,630 | 6.7 | 18,061,500 | 6.7 | 19,036,270 | 6.7 | 21,115,140 | 6.8 | 74,358,550 | 8.0 | 6.7 |
| r2015 | 15,098,670 | 7.0 | 16,850,300 | 7.0 | 17,671,040 | 6.9 | 19,285,190 | 6.8 | 68,905,100 | 7.0 | 6.9 |
| r2014 | 14,061,830 | 7.4 | 15,646,130 | 7.5 | 16,571,190 | 7.1 | 18,118,250 | 7.2 | 64,397,400 | 8.2 | 7.3 |
| 2013 | 12,974,700 | 7.9 | 14,396,700 | 7.6 | 15,290,530 | 7.9 | 16,862,510 | 7.7 | 59,524,440 | 10.2 | 7.8 |
| 2012 | 11,759,390 | 8.1 | 13,168,250 | 7.6 | 13,862,220 | 7.5 | 15,246,890 | 8.1 | 54,036,740 | 10.4 | 7.9 |
| 2011 | 10,464,130 | 10.2 | 11,917,430 | 10.0 | 12,698,160 | 9.4 | 13,850,330 | 8.8 | 48,930,060 | 18.5 | 9.5 |
| 2010 | 8,761,670 | 12.2 | 9,953,240 | 10.8 | 10,623,870 | 9.9 | 11,964,250 | 9.9 | 41,303,030 | 18.3 | 10.6 |
| 2009 | 7,405,310 | 6.4 | 8,398,130 | 8.2 | 9,001,410 | 10.6 | 10,103,280 | 11.9 | 34,908,140 | 9.3 | 9.4 |
| 2008 | 6,941,040 | 11.5 | 7,876,900 | 10.9 | 8,254,190 | 9.5 | 8,879,430 | 7.1 | 31,951,550 | 18.2 | 9.7 |
| 2007 | 5,717,700 | 13.8 | 6,480,960 | 15.0 | 6,952,430 | 14.3 | 7,872,140 | 13.9 | 27,023,230 | 23.1 | 14.2 |
| 2006 | 4,707,890 | 12.5 | 5,267,330 | 13.7 | 5,606,470 | 12.2 | 6,362,160 | 12.5 | 21,943,850 | 17.1 | 12.7 |
| 2005 | 4,045,330 | 11.1 | 4,479,310 | 11.1 | 4,804,780 | 10.8 | 5,402,480 | 12.4 | 18,731,890 | 15.7 | 11.4 |
| 2004 | 3,454,460 | 10.6 | 3,870,080 | 11.6 | 4,185,500 | 9.8 | 4,673,980 | 8.8 | 16,184,020 | 17.8 | 10.1 |
| 2003 | 2,982,550 | 11.1 | 3,253,730 | 9.1 | 3,529,190 | 10.0 | 3,976,740 | 10.0 | 13,742,200 | 12.9 | 10.0 |
| 2002 | 2,629,500 | 8.9 | 2,919,480 | 8.8 | 3,125,730 | 9.6 | 3,497,030 | 9.1 | 12,171,740 | 9.8 | 9.1 |
| 2001 | 2,408,640 | 9.5 | 2,672,660 | 8.6 | 2,833,330 | 8.0 | 3,171,680 | 7.5 | 11,086,310 | 10.6 | 8.3 |
| 2000 | 2,132,990 | 8.7 | 2,404,340 | 9.1 | 2,571,250 | 8.8 | 2,919,430 | 7.5 | 10,028,010 | 10.7 | 8.5 |
| 1999 | 1,936,190 | 8.9 | 2,156,770 | 7.9 | 2,305,080 | 7.6 | 2,658,390 | 6.7 | 9,056,440 | 6.3 | 7.7 |
| 1998 | 1,804,910 | 7.3 | 2,029,660 | 6.9 | 2,177,560 | 7.8 | 2,507,420 | 9.1 | 8,519,550 | 6.9 | 7.8 |
| 1997 | 1,668,910 | 10.1 | 1,916,360 | 10.0 | 2,050,090 | 8.6 | 2,336,150 | 8.6 | 7,971,500 | 11.0 | 9.2 |
| 1996 | 1,462,800 | 10.9 | 1,714,750 | 9.4 | 1,860,580 | 9.2 | 2,143,240 | 10.3 | 7,181,360 | 17.1 | 9.9 |
| 1995 | 1,211,170 | 11.9 | 1,461,290 | 11.0 | 1,616,410 | 10.4 | 1,845,120 | 10.8 | 6,133,990 | 26.1 | 11.0 |
| 1994 | 937,510 | 14.1 | 1,148,100 | 13.3 | 1,286,800 | 13.1 | 1,491,330 | 12.0 | 4,863,750 | 36.3 | 13.0 |
| 1993 | 683,460 | 15.3 | 835,700 | 13.5 | 938,580 | 12.9 | 1,109,590 | 14.1 | 3,567,320 | 31.2 | 13.9 |
| 1992 | 526,280 | 648,430 | 719,260 | 825,480 | 2,719,450 | 13.2 | |||||
Comparative data of three International organizations
| List of China GDP by three International organizations ( in billions of GDP ) | |||||||||
| Year | UN (GDP by Expenditure Approach)[9] | WB[10] | IMF[4] | ||||||
| CNY | USD | Exchange rate |
CNY | USD | Exchange rate |
CNY | USD | Exchange rate | |
| r2014 | 64,079.64 | 10,430.59 | 6.1434 | 63,613.87 | 10,354.83 | 6.1434 | 63,613.90 | 10,356.51 | 6.1424 |
| 2013 | 58,973.72 | 9,518.40 | 6.1958 | 58,801.88 | 9,490.60 | 6.1958 | 58,801.88 | 9,490.85 | 6.1956 |
| 2012 | 53,474.46 | 8,471.43 | 6.3123 | 53,412.30 | 8,461.62 | 6.3123 | 53,412.30 | 8,461.51 | 6.3124 |
| 2011 | 48,086.07 | 7,441.98 | 6.4615 | 48,412.35 | 7,492.43 | 6.4615 | 48,412.35 | 7,492.53 | 6.4614 |
| 2010 | 40,658.09 | 6,005.39 | 6.7703 | 40,890.30 | 6,039.66 | 6.7703 | 40,890.30 | 6,039.55 | 6.7704 |
| 2009 | 34,643.11 | 5,071.15 | 6.8314 | 34,562.92 | 5,059.42 | 6.8314 | 34,562.92 | 5,059.72 | 6.8310 |
| 2008 | 31,717.20 | 4,564.51 | 6.9487 | 31,675.17 | 4,558.43 | 6.9487 | 31,675.17 | 4,558.90 | 6.9480 |
| 2007 | 26,948.64 | 3,542.36 | 7.6075 | 26,801.94 | 3,523.09 | 7.6075 | 26,801.94 | 3,523.28 | 7.6071 |
| 2006 | 21,942.46 | 2,751.94 | 7.9734 | 21,765.66 | 2,729.78 | 7.9734 | 21,765.66 | 2,729.75 | 7.9735 |
| 2005 | 18,776.72 | 2,291.43 | 8.1943 | 18,589.58 | 2,268.60 | 8.1943 | 18,589.58 | 2,268.62 | 8.1942 |
| 2004 | 16,161.64 | 1,952.64 | 8.2768 | 16,071.44 | 1,941.75 | 8.2768 | 16,071.44 | 1,941.75 | 8.2768 |
| 2003 | 13,745.73 | 1,660.71 | 8.2770 | 13,656.46 | 1,649.93 | 8.2770 | 13,656.46 | 1,649.92 | 8.2770 |
| 2002 | 12,157.67 | 1,468.86 | 8.2770 | 12,100.20 | 1,461.91 | 8.2770 | 12,100.20 | 1,461.92 | 8.2769 |
| 2001 | 11,065.74 | 1,336.92 | 8.2771 | 11,027.04 | 1,332.24 | 8.2771 | 11,027.04 | 1,332.25 | 8.2770 |
| 2000 | 10,008.01 | 1,208.92 | 8.2785 | 9,977.63 | 1,205.26 | 8.2784 | 9,977.63 | 1,205.26 | 8.2784 |
| 1999 | 9,044.73 | 1,092.59 | 8.2783 | 9,018.77 | 1,089.45 | 8.2783 | 9,018.77 | 1,089.45 | 8.2783 |
| 1998 | 8,517.44 | 1,028.81 | 8.2790 | 8,488.37 | 1,025.28 | 8.2791 | 8,488.37 | 1,025.30 | 8.2790 |
| 1997 | 7,973.92 | 961.89 | 8.2898 | 7,942.95 | 958.16 | 8.2898 | 7,942.95 | 958.16 | 8.2898 |
| 1996 | 7,186.12 | 864.32 | 8.3142 | 7,157.23 | 860.84 | 8.3142 | 7,157.23 | 860.84 | 8.3142 |
| 1995 | 6,132.89 | 734.35 | 8.3514 | 6,112.98 | 732.03 | 8.3507 | 6,112.98 | 731.97 | 8.3514 |
| 1994 | 4,864.49 | 564.41 | 8.6187 | 4,845.96 | 562.26 | 8.6187 | 4,845.96 | 562.28 | 8.6185 |
| 1993 | 3,575.12 | 620.47 | 5.7620 | 3,552.43 | 442.88 | 8.0213 | 3,552.43 | 616.53 | 5.7620 |
| 1992 | 2,720.80 | 493.38 | 5.5146 | 2,706.83 | 424.93 | 6.3700 | 2,706.83 | 490.85 | 5.5146 |
| 1991 | 2,201.41 | 413.54 | 5.3234 | 2,189.55 | 381.46 | 5.7400 | 2,189.55 | 411.31 | 5.3234 |
| 1990 | 1,896.84 | 396.56 | 4.7832 | 1,877.43 | 358.97 | 5.2300 | 1,877.43 | 392.51 | 4.7832 |
| 1989 | 1,727.01 | 458.69 | 3.7651 | 1,709.03 | 345.96 | 4.9400 | 1,709.03 | 453.91 | 3.7651 |
| 1988 | 1,525.29 | 409.79 | 3.7221 | 1,510.11 | 310.72 | 4.8600 | 1,510.11 | 405.72 | 3.7221 |
| 1987 | 1,222.18 | 328.36 | 3.7221 | 1,210.22 | 271.35 | 4.4600 | 1,210.22 | 325.14 | 3.7221 |
| 1986 | 1,040.62 | 301.39 | 3.4528 | 1,030.88 | 298.81 | 3.4500 | 1,030.88 | 298.56 | 3.4528 |
| 1985 | 912.15 | 310.61 | 2.9367 | 903.99 | 307.48 | 2.9400 | 903.99 | 307.83 | 2.9367 |
| 1984 | 729.37 | 314.38 | 2.3200 | 722.63 | 258.08 | 2.8000 | 722.63 | 311.47 | 2.3200 |
| 1983 | 603.34 | 305.38 | 1.9757 | 597.56 | 228.95 | 2.6100 | 597.56 | 302.46 | 1.9757 |
| 1982 | 538.59 | 284.59 | 1.8925 | 533.30 | 203.55 | 2.6200 | 533.30 | 281.79 | 1.8925 |
| 1981 | 491.96 | 288.62 | 1.7045 | 489.81 | 194.37 | 2.5200 | 489.81 | 287.36 | 1.7045 |
| 1980 | 453.93 | 302.94 | 1.4984 | 455.16 | 189.65 | 2.4000 | 455.16 | 303.76 | 1.4984 |
| 1979 | 404.54 | 260.15 | 1.5550 | 406.77 | 176.86 | 2.3000 | |||
| 1978 | 360.56 | 214.16 | 1.6836 | 365.02 | 148.38 | 2.4600 | |||
United Nations data
| Nominal GDP comparison between main world countries (United Nations data Dec.2015; in billions of US dollars )[9] | |||||||||||||||||
| country | 2014 | 2013 | 2012 | 2011 | 2010 | 2009 | 2008 | 2007 | 2006 | 2005 | 2000 | 1995 | 1990 | 1985 | 1980 | 1975 | 1970 |
| world | 78,037 | 76,176 | 74,222 | 72,807 | 65,645 | 59,973 | 63,262 | 57,742 | 51,213 | 47,265 | 33,299 | 30,860 | 22,947 | 13,502 | 12,274 | 6,627 | 3,399.50 |
| 17,348 | 16,663 | 16,155 | 15,518 | 14,964 | 14,419 | 14,719 | 14,478 | 13,856 | 13,094 | 10,285 | 7,664 | 5,980 | 4,347 | 2,863 | 1,689 | 1,075.90 | |
| 10,431 | 9,518 | 8,471 | 7,442 | 6,005 | 5,071 | 4,565 | 3,542 | 2,752 | 2,291 | 1,209 | 734 | 397 | 311 | 303 | 159 | 89.65 | |
| 4,602 | 4,920 | 5,957 | 5,909 | 5,499 | 5,035 | 4,849 | 4,356 | 4,357 | 4,572 | 4,731 | 5,334 | 3,104 | 1,385 | 1,087 | 513 | 209.07 | |
| 3,868 | 3,745 | 3,540 | 3,758 | 3,417 | 3,418 | 3,753 | 3,440 | 3,002 | 2,861 | 1,950 | 2,591 | 1,765 | 730 | 947 | 489 | 215.02 | |
| 2,989 | 2,712 | 2,630 | 2,595 | 2,404 | 2,315 | 2,794 | 2,970 | 2,588 | 2,419 | 1,555 | 1,238 | 1,093 | 489 | 565 | 242 | 130.68 | |
| 2,829 | 2,810 | 2,681 | 2,863 | 2,647 | 2,694 | 2,924 | 2,663 | 2,325 | 2,204 | 1,368 | 1,610 | 1,275 | 555 | 704 | 362 | 148.94 | |
| 2,347 | 2,392 | 2,413 | 2,615 | 2,209 | 1,665 | 1,695 | 1,396 | 1,108 | 892 | 652 | 778 | 407 | 187 | 191 | 108 | 35.21 | |
| 2,141 | 2,134 | 2,075 | 2,278 | 2,127 | 2,186 | 2,392 | 2,204 | 1,943 | 1,853 | 1,142 | 1,171 | 1,178 | 451 | 476 | 227 | 113.07 | |
| 2,055 | 1,936 | 1,869 | 1,892 | 1,669 | 1,312 | 1,269 | 1,182 | 929 | 821 | 459 | 362 | 320 | 222 | 181 | 98 | 60.26 | |
| 1,850 | 2,079 | 2,016 | 1,905 | 1,525 | 1,223 | 1,661 | 1,300 | 990 | 764 | 260 | 399 | ||||||
| 783 | 914 | 940 | 686 | 433.41 | |||||||||||||
| 1,785 | 1,839 | 1,833 | 1,789 | 1,614 | 1,371 | 1,543 | 1,458 | 1,311 | 1,164 | 739 | 602 | 592 | 363 | 273 | 174 | 87.76 | |
| 1,471 | 1,529 | 1,575 | 1,535 | 1,291 | 1,011 | 1,055 | 986 | 819 | 762 | 409 | 392 | 324 | 182 | 173 | 109 | 45.13 | |
| 1,410 | 1,306 | 1,223 | 1,202 | 1,094 | 902 | 1,002 | 1,123 | 1,012 | 898 | 562 | 556 | 279 | 100 | 65 | 22 | 9.00 | |
| 1,381 | 1,369 | 1,340 | 1,488 | 1,432 | 1,499 | 1,635 | 1,479 | 1,264 | 1,157 | 595 | 613 | 535 | 180 | 232 | 114 | 40.88 | |
| 1,295 | 1,259 | 1,185 | 1,169 | 1,050 | 893 | 1,101 | 1,043 | 965 | 865 | 649 | 320 | 293 | 220 | 232 | 110 | 44.23 | |
| comparison of Nominal GDP ranking (United Nations data Dec.2015; in billions of US dollars )[9] | |||||||||||||||||
| country | 2014 | 2013 | 2012 | 2011 | 2010 | 2009 | 2008 | 2007 | 2006 | 2005 | 2000 | 1995 | 1990 | 1985 | 1980 | 1975 | 1970 |
| 1 | 1 | 1 | 1 | 1 | 1 | 1 | 1 | 1 | 1 | 1 | 1 | 1 | 1 | 1 | 1 | 1 | |
| 2 | 2 | 2 | 2 | 2 | 2 | 3 | 3 | 4 | 5 | 6 | 8 | 11 | 9 | 8 | 9 | 8 | |
| 3 | 3 | 3 | 3 | 3 | 3 | 2 | 2 | 2 | 2 | 2 | 2 | 2 | 2 | 2 | 3 | 4 | |
| 4 | 4 | 4 | 4 | 4 | 4 | 4 | 4 | 3 | 3 | 3 | 3 | 3 | 4 | 3 | 4 | 3 | |
| 5 | 6 | 6 | 7 | 6 | 6 | 6 | 5 | 5 | 4 | 4 | 5 | 6 | 6 | 6 | 6 | 6 | |
| 6 | 5 | 5 | 5 | 5 | 5 | 5 | 6 | 6 | 6 | 5 | 4 | 4 | 5 | 5 | 5 | 5 | |
| 7 | 7 | 7 | 6 | 7 | 8 | 8 | 10 | 10 | 11 | 9 | 7 | 10 | 12 | 14 | 13 | 17 | |
| 8 | 8 | 8 | 8 | 8 | 7 | 7 | 7 | 7 | 7 | 7 | 6 | 5 | 7 | 7 | 7 | 7 | |
| 9 | 10 | 10 | 10 | 9 | 11 | 12 | 12 | 14 | 13 | 13 | 15 | 13 | 10 | 15 | 15 | 10 | |
| 10 | 9 | 9 | 9 | 11 | 12 | 9 | 11 | 12 | 14 | 20 | 13 | ||||||
| 7 | 3 | 4 | 2 | 2 | |||||||||||||
| 11 | 11 | 11 | 11 | 10 | 10 | 11 | 9 | 8 | 8 | 8 | 10 | 8 | 8 | 9 | 8 | 9 | |
| 12 | 12 | 12 | 12 | 13 | 13 | 14 | 15 | 15 | 15 | 15 | 14 | 12 | 13 | 16 | 12 | 11 | |
| 13 | 14 | 14 | 14 | 14 | 14 | 15 | 13 | 11 | 10 | 12 | 11 | 16 | 22 | 31 | 36 | 39 | |
| 14 | 13 | 13 | 13 | 12 | 9 | 10 | 8 | 9 | 9 | 11 | 9 | 9 | 14 | 10 | 10 | 13 | |
| 15 | 15 | 15 | 15 | 15 | 15 | 13 | 14 | 13 | 12 | 10 | 17 | 15 | 11 | 11 | 11 | 12 | |
| comparison for percentage share of world nominal GDP (United Nations data, Dec.2015; in billions of US dollars )[9] | |||||||||||||||||
| country | 2014 | 2013 | 2012 | 2011 | 2010 | 2009 | 2008 | 2007 | 2006 | 2005 | 2000 | 1995 | 1990 | 1985 | 1980 | 1975 | 1970 |
| world | 100 | 100 | 100 | 100 | 100 | 100 | 100 | 100 | 100 | 100 | 100 | 100 | 100 | 100 | 100 | 100 | 100 |
| 22.23 | 21.87 | 21.77 | 21.31 | 22.80 | 24.04 | 23.27 | 25.07 | 27.06 | 27.70 | 30.89 | 24.83 | 26.06 | 32.19 | 23.32 | 25.49 | 31.65 | |
| 13.37 | 12.50 | 11.41 | 10.22 | 9.15 | 8.46 | 7.22 | 6.13 | 5.37 | 4.85 | 3.63 | 2.38 | 1.73 | 2.30 | 2.47 | 2.39 | 2.64 | |
| 5.90 | 6.46 | 8.03 | 8.12 | 8.38 | 8.40 | 7.67 | 7.54 | 8.51 | 9.67 | 14.21 | 17.28 | 13.53 | 10.25 | 8.86 | 7.74 | 6.15 | |
| 4.96 | 4.92 | 4.77 | 5.16 | 5.21 | 5.70 | 5.93 | 5.96 | 5.86 | 6.05 | 5.86 | 8.40 | 7.69 | 5.40 | 7.71 | 7.38 | 6.33 | |
| 3.83 | 3.56 | 3.54 | 3.56 | 3.66 | 3.86 | 4.42 | 5.14 | 5.05 | 5.12 | 4.67 | 4.01 | 4.76 | 3.62 | 4.60 | 3.65 | 3.84 | |
| 3.63 | 3.69 | 3.61 | 3.93 | 4.03 | 4.49 | 4.62 | 4.61 | 4.54 | 4.66 | 4.11 | 5.22 | 5.56 | 4.11 | 5.73 | 5.46 | 4.38 | |
| 3.01 | 3.14 | 3.25 | 3.59 | 3.37 | 2.78 | 2.68 | 2.42 | 2.16 | 1.89 | 1.96 | 2.52 | 1.77 | 1.39 | 1.56 | 1.63 | 1.04 | |
| 2.74 | 2.80 | 2.80 | 3.13 | 3.24 | 3.65 | 3.78 | 3.82 | 3.79 | 3.92 | 3.43 | 3.80 | 5.13 | 3.34 | 3.88 | 3.43 | 3.33 | |
| 2.63 | 2.54 | 2.52 | 2.60 | 2.54 | 2.19 | 2.01 | 2.05 | 1.81 | 1.74 | 1.38 | 1.17 | 1.40 | 1.64 | 1.48 | 1.49 | 1.77 | |
| 2.37 | 2.73 | 2.72 | 2.62 | 2.32 | 2.04 | 2.63 | 2.25 | 1.93 | 1.62 | 0.78 | 1.29 | ||||||
| 3.41 | 6.77 | 7.66 | 10.35 | 12.75 | |||||||||||||
| 2.29 | 2.41 | 2.47 | 2.46 | 2.46 | 2.29 | 2.44 | 2.52 | 2.56 | 2.46 | 2.22 | 1.95 | 2.58 | 2.69 | 2.23 | 2.62 | 2.58 | |
| 1.89 | 2.01 | 2.12 | 2.11 | 1.97 | 1.69 | 1.67 | 1.71 | 1.60 | 1.61 | 1.23 | 1.27 | 1.41 | 1.35 | 1.41 | 1.64 | 1.33 | |
| 1.81 | 1.71 | 1.65 | 1.65 | 1.67 | 1.50 | 1.58 | 1.94 | 1.98 | 1.90 | 1.69 | 1.80 | 1.22 | 0.74 | 0.53 | 0.33 | 0.26 | |
| 1.77 | 1.80 | 1.81 | 2.04 | 2.18 | 2.50 | 2.58 | 2.56 | 2.47 | 2.45 | 1.79 | 1.99 | 2.33 | 1.34 | 1.89 | 1.73 | 1.20 | |
| 1.66 | 1.65 | 1.60 | 1.61 | 1.60 | 1.49 | 1.74 | 1.81 | 1.88 | 1.83 | 1.95 | 1.04 | 1.28 | 1.63 | 1.89 | 1.65 | 1.30 | |
| Comparison of China's historical Nominal GDP per capita rankings in the world by year (United Nations data FEB.17, 2016; GDP pc: abbreviation of GDP per capita )[9] | ||||||||||
| year | former | middle | later | world GDP pc | ||||||
| rank | country | GDP pc | rank | country | GDP pc | rank | country | GDP pc | ||
| 2014 | 8 | 85,374 | 9 | 62,290 | 10 | 61,294 | 10,743 | |||
| 14 | 55,910 | 15 | 54,306 | 16 | 53,648 | |||||
| 19 | 51,296 | 20 | 50,169 | 21 | 49,678 | |||||
| 21 | 49,678 | 22 | 47,966 | 23 | 47,348 | |||||
| 23 | 47,348 | 24 | 46,461 | 25 | 45,033 | |||||
| 29 | 43,430 | 30 | 42,651 | 31 | 40,979 | |||||
| 34 | 38,500 | 35 | 36,298 | 36 | 35,812 | |||||
| 35 | 36,298 | 36 | 35,812 | 37 | 30,501 | |||||
| 37 | 30,501 | 38 | 29,861 | 39 | 28,166 | |||||
| 38 | 29,861 | 39 | 28,166 | 40 | 28,123 | |||||
| 74 | 13,425 | 75 | 12,898 | 76 | 12,712 | |||||
| 79 | 12,384 | 80 | 11,387 | 81 | 11,068 | |||||
| 83 | 10,415 | 84 | 10,326 | 85 | 10,317 | |||||
| 98 | 7,655 | 99 | 7,617 | 100 | 7,361 | |||||
| 166 | 1,632 | 167 | 1,586 | 168 | 1,546 | |||||
| 2013 | 101 | 7,147 | 102 | 6,986 | 103 | 6,882 | 10,609 | |||
| 2012 | 108 | 6,338 | 109 | 6,250 | 110 | 6,177 | 10,460 | |||
| 2011 | 112 | 5,539 | 113 | 5,520 | 114 | 5,447 | 10,383 | |||
| 2010 | 114 | 4,561 | 115 | 4,478 | 116 | 4,475 | 9,475 | |||
| 2009 | 120 | 3,876 | 121 | 3,802 | 122 | 3,801 | 8,762 | |||
| 2008 | 130 | 3,527 | 131 | 3,441 | 132 | 3,326 | 9,355 | |||
| 2007 | 132 | 2,768 | 133 | 2,684 | 134 | 2,669 | 8,644 | |||
| 2006 | 138 | 2,127 | 139 | 2,097 | 140 | 2,047 | 7,761 | |||
| 2005 | 137 | 1,772 | 138 | 1,755 | 139 | 1,738 | 7,251 | |||
| 2000 | 139 | 1,007 | 140 | 952 | 141 | 890 | 5,436 | |||
| 1995 | 155 | 618 | 156 | 598 | 157 | 594 | 5,384 | |||
| 1990 | 163 | 70 | 164 | 111 | 165 | 65 | 4,324 | |||
| 1980 | 163 | 212 | 164 | 111 | 165 | 126 | 2,766 | |||
| 1970 | 159 | 125 | 160 | 111 | 161 | 111 | 924 | |||
World Bank data
| Nominal GDP comparison between main world countries (World Bank WDI data FEB.17, 2016; in billions of US dollars )[10] | ||||||||||||||||
| Country | 2014 | 2013 | 2012 | 2011 | 2010 | 2009 | 2008 | 2007 | 2006 | 2005 | 2000 | 1990 | 1985 | 1980 | 1970 | 1960 |
| world | 77,845 | 76,237 | 74,155 | 72,660 | 65,588 | 59,776 | 63,071 | 57,531 | 51,035 | 47,104 | 33,292 | 22,542 | 12,662 | 11,154 | 2,952.02 | 1,366.62 |
| 17,419 | 16,768 | 16,163 | 15,518 | 14,964 | 14,419 | 14,719 | 14,478 | 13,856 | 13,094 | 10,285 | 5,980 | 4,347 | 2,863 | 1,075.88 | 543.30 | |
| 10,355 | 9,491 | 8,462 | 7,492 | 6,040 | 5,059 | 4,558 | 3,523 | 2,730 | 2,269 | 1,205 | 359 | 307 | 190 | 91.51 | 59.18 | |
| 4,601 | 4,920 | 5,954 | 5,906 | 5,495 | 5,035 | 4,849 | 4,356 | 4,357 | 4,572 | 4,731 | 3,104 | 1,385 | 1,087 | 209.07 | 44.31 | |
| 3,868 | 3,745 | 3,540 | 3,757 | 3,417 | 3,418 | 3,752 | 3,440 | 3,002 | 2,861 | 1,950 | 1,765 | 730 | 947 | 215.02 | ||
| 2,989 | 2,712 | 2,630 | 2,595 | 2,404 | 2,315 | 2,793 | 2,970 | 2,588 | 2,419 | 1,555 | 1,093 | 489 | 565 | 130.67 | 72.33 | |
| 2,829 | 2,810 | 2,681 | 2,863 | 2,647 | 2,694 | 2,923 | 2,663 | 2,325 | 2,204 | 1,368 | 1,275 | 555 | 704 | 148.95 | 62.65 | |
| 2,346 | 2,392 | 2,413 | 2,615 | 2,209 | 1,665 | 1,695 | 1,396 | 1,108 | 892 | 657 | 462 | 223 | 235 | 42.33 | 15.17 | |
| 2,141 | 2,134 | 2,075 | 2,278 | 2,127 | 2,186 | 2,392 | 2,204 | 1,944 | 1,854 | 1,142 | 1,178 | 451 | 476 | 113.06 | 40.39 | |
| 2,049 | 1,862 | 1,832 | 1,836 | 1,708 | 1,365 | 1,224 | 1,239 | 949 | 834 | 477 | 327 | 237 | 190 | 63.52 | 37.68 | |
| 1,861 | 2,079 | 2,016 | 1,905 | 1,525 | 1,223 | 1,661 | 1,300 | 990 | 764 | 260 | ||||||
| 783 | 914 | 940 | 433.41 | |||||||||||||
| 1,785 | 1,839 | 1,833 | 1,789 | 1,614 | 1,371 | 1,543 | 1,458 | 1,311 | 1,164 | 739 | 592 | 363 | 273 | 87.76 | 41.09 | |
| 1,455 | 1,564 | 1,537 | 1,390 | 1,142 | 927 | 1,055 | 853 | 747 | 693 | 415 | 311 | 180 | 150 | 41.25 | 18.57 | |
| 1,410 | 1,306 | 1,223 | 1,202 | 1,094 | 902 | 1,002 | 1,123 | 1,012 | 898 | 562 | 285 | 104 | 68 | 9.41 | 3.89 | |
| 1,381 | 1,369 | 1,340 | 1,488 | 1,432 | 1,499 | 1,635 | 1,479 | 1,265 | 1,157 | 595 | 535 | 180 | 232 | 40.88 | 12.07 | |
| 1,295 | 1,259 | 1,185 | 1,169 | 1,050 | 893 | 1,101 | 1,043 | 965 | 866 | 684 | 263 | 184 | 194 | 35.54 | 13.06 | |
| comparison for percentage share of world nominal GDP ( World Bank WDI data FEB.17, 2016; unit: percentage )[10] | ||||||||||||||||
| Country | 2014 | 2013 | 2012 | 2011 | 2010 | 2009 | 2008 | 2007 | 2006 | 2005 | 2000 | 1990 | 1985 | 1980 | 1970 | 1960 |
| World | 100 | 100 | 100 | 100 | 100 | 100 | 100 | 100 | 100 | 100 | 100 | 100 | 100 | 100 | 100 | 100 |
| 22.38 | 21.99 | 21.80 | 21.36 | 22.82 | 24.12 | 23.34 | 25.17 | 27.15 | 27.80 | 30.89 | 26.53 | 34.33 | 25.66 | 36.45 | 39.76 | |
| 13.30 | 12.45 | 11.41 | 10.31 | 9.21 | 8.46 | 7.23 | 6.12 | 5.35 | 4.82 | 3.62 | 1.59 | 2.43 | 1.70 | 3.10 | 4.33 | |
| 5.91 | 6.45 | 8.03 | 8.13 | 8.38 | 8.42 | 7.69 | 7.57 | 8.54 | 9.71 | 14.21 | 13.77 | 10.93 | 9.74 | 7.08 | 3.24 | |
| 4.97 | 4.91 | 4.77 | 5.17 | 5.21 | 5.72 | 5.95 | 5.98 | 5.88 | 6.07 | 5.86 | 7.83 | 5.76 | 8.49 | 7.28 | ||
| 3.84 | 3.56 | 3.55 | 3.57 | 3.66 | 3.87 | 4.43 | 5.16 | 5.07 | 5.14 | 4.67 | 4.85 | 3.86 | 5.06 | 4.43 | 5.29 | |
| 3.63 | 3.69 | 3.62 | 3.94 | 4.04 | 4.51 | 4.64 | 4.63 | 4.56 | 4.68 | 4.11 | 5.66 | 4.38 | 6.31 | 5.05 | 4.58 | |
| 3.01 | 3.14 | 3.25 | 3.60 | 3.37 | 2.78 | 2.69 | 2.43 | 2.17 | 1.89 | 1.97 | 2.05 | 1.76 | 2.11 | 1.43 | 1.11 | |
| 2.75 | 2.80 | 2.80 | 3.14 | 3.24 | 3.66 | 3.79 | 3.83 | 3.81 | 3.93 | 3.43 | 5.22 | 3.56 | 4.27 | 3.83 | 2.96 | |
| 2.63 | 2.44 | 2.47 | 2.53 | 2.60 | 2.28 | 1.94 | 2.15 | 1.86 | 1.77 | 1.43 | 1.45 | 1.87 | 1.70 | 2.15 | 2.76 | |
| 2.39 | 2.73 | 2.72 | 2.62 | 2.32 | 2.05 | 2.63 | 2.26 | 1.94 | 1.62 | 0.78 | ||||||
| 3.47 | 7.22 | 8.43 | 14.68 | |||||||||||||
| 2.29 | 2.41 | 2.47 | 2.46 | 2.46 | 2.29 | 2.45 | 2.53 | 2.57 | 2.47 | 2.22 | 2.63 | 2.87 | 2.45 | 2.97 | 3.01 | |
| 1.87 | 2.05 | 2.07 | 1.91 | 1.74 | 1.55 | 1.67 | 1.48 | 1.46 | 1.47 | 1.25 | 1.38 | 1.42 | 1.34 | 1.40 | 1.36 | |
| 1.81 | 1.71 | 1.65 | 1.65 | 1.67 | 1.51 | 1.59 | 1.95 | 1.98 | 1.91 | 1.69 | 1.26 | 0.82 | 0.61 | 0.32 | 0.28 | |
| 1.77 | 1.80 | 1.81 | 2.05 | 2.18 | 2.51 | 2.59 | 2.57 | 2.48 | 2.46 | 1.79 | 2.37 | 1.42 | 2.08 | 1.38 | 0.88 | |
| 1.66 | 1.65 | 1.60 | 1.61 | 1.60 | 1.49 | 1.75 | 1.81 | 1.89 | 1.84 | 2.05 | 1.17 | 1.46 | 1.74 | 1.20 | 0.96 | |
| comparison of Nominal GDP ranking ( World Bank WDI data FEB.17, 2016; unit: percentage )[10] | ||||||||||||||||
| Country | 2014 | 2013 | 2012 | 2011 | 2010 | 2009 | 2008 | 2007 | 2006 | 2005 | 2000 | 1990 | 1985 | 1980 | 1970 | 1960 |
| 1 | 1 | 1 | 1 | 1 | 1 | 1 | 1 | 1 | 1 | 1 | 1 | 1 | 1 | 1 | 1 | |
| 2 | 2 | 2 | 2 | 2 | 2 | 3 | 3 | 4 | 5 | 6 | 11 | 9 | 13 | 8 | 6 | |
| 3 | 3 | 3 | 3 | 3 | 3 | 2 | 2 | 2 | 2 | 2 | 2 | 2 | 2 | 4 | 7 | |
| 4 | 4 | 4 | 4 | 4 | 4 | 4 | 4 | 3 | 3 | 3 | 3 | 4 | 3 | 3 | 5 | |
| 5 | 6 | 6 | 7 | 7 | 7 | 6 | 5 | 5 | 4 | 4 | 6 | 6 | 6 | 6 | 3 | |
| 6 | 5 | 5 | 5 | 5 | 5 | 5 | 6 | 6 | 6 | 5 | 4 | 5 | 5 | 5 | 4 | |
| 7 | 7 | 7 | 6 | 6 | 6 | 8 | 10 | 10 | 11 | 10 | 10 | 11 | 9 | 11 | 12 | |
| 8 | 8 | 8 | 8 | 8 | 8 | 7 | 7 | 7 | 7 | 7 | 5 | 7 | 7 | 7 | 9 | |
| 9 | 10 | 11 | 10 | 10 | 10 | 12 | 12 | 14 | 13 | 13 | 12 | 10 | 14 | 10 | 10 | |
| 10 | 9 | 9 | 9 | 9 | 9 | 9 | 11 | 12 | 14 | 20 | ||||||
| 7 | 3 | 4 | 2 | 2 | ||||||||||||
| 11 | 11 | 10 | 11 | 11 | 11 | 11 | 9 | 8 | 8 | 8 | 8 | 8 | 8 | 9 | 8 | |
| 12 | 12 | 12 | 13 | 13 | 13 | 14 | 15 | 15 | 15 | 14 | 14 | 15 | 16 | 12 | 11 | |
| 13 | 14 | 14 | 14 | 14 | 14 | 15 | 13 | 11 | 10 | 12 | 15 | 20 | 27 | 31 | 32 | |
| 14 | 13 | 13 | 12 | 12 | 12 | 10 | 8 | 9 | 9 | 11 | 9 | 13 | 10 | 13 | 17 | |
| 15 | 15 | 15 | 15 | 15 | 15 | 13 | 14 | 13 | 12 | 9 | 16 | 12 | 11 | 16 | 15 | |
| Comparison of China's historical Nominal GDP per capita rankings in the world by year (World Bank WDI data FEB.17, 2016; GDP pc: abbreviation of GDP per capita )[10] | |||||||||
| year | former | middle | later | ||||||
| rank | country | GDP pc | rank | country | GDP pc | rank | country | GDP pc | |
| 2014 | |||||||||
| 8 | 85,594 | 9 | 61,925 | 10 | 60,707 | ||||
| 12 | 56,285 | 13 | 54,629 | 14 | 54,374 | ||||
| 18 | 51,191 | 19 | 50,235 | 20 | 49,824 | ||||
| 20 | 49,824 | 21 | 47,822 | 22 | 47,353 | ||||
| 22 | 47,353 | 23 | 46,332 | 24 | 44,342 | ||||
| 27 | 42,807 | 28 | 42,733 | 29 | 40,980 | ||||
| 31 | 37,208 | 32 | 36,194 | 33 | 34,909 | ||||
| 32 | 36,194 | 33 | 34,909 | 34 | 29,767 | ||||
| 33 | 34,909 | 34 | 29,767 | 35 | 28,682 | ||||
| 35 | 28,682 | 36 | 27,970 | 37 | 27,194 | ||||
| 61 | 13,432 | 62 | 12,736 | 63 | 12,602 | ||||
| 66 | 11,880 | 67 | 11,384 | 68 | 11,307 | ||||
| 71 | 10,415 | 72 | 10,326 | 73 | 10,058 | ||||
| 84 | 7,635 | 85 | 7,590 | 86 | 7,378 | ||||
| 152 | 1,722 | 153 | 1,582 | 154 | 1,546 | ||||
| 2013 | 88 | 7,037 | 89 | 6,992 | 90 | 6,890 | |||
| 2012 | 96 | 6,338 | 97 | 6,265 | 98 | 5,967 | |||
| 2011 | 99 | 5,725 | 100 | 5,574 | 101 | 5,540 | |||
| 2010 | 103 | 4,561 | 104 | 4,515 | 105 | 4,487 | |||
| 2009 | 111 | 3,876 | 112 | 3,800 | 113 | 3,726 | |||
| 2008 | 120 | 3,569 | 121 | 3,441 | 122 | 3,376 | |||
| 2007 | 127 | 2,691 | 128 | 2,673 | 129 | 2,607 | |||
| 2006 | 133 | 2,108 | 134 | 2,082 | 135 | 2,047 | |||
| 2005 | 129 | 1,829 | 130 | 1,740 | 131 | 1,738 | |||
| 2004 | 126 | 1,788 | 127 | 1,498 | 128 | 1,456 | |||
| 2003 | 127 | 1,286 | 128 | 1,281 | 129 | 1,261 | |||
| 2002 | 130 | 1,148 | 131 | 1,142 | 132 | 1,131 | |||
| 2001 | 131 | 1,188 | 132 | 1,047 | 133 | 1,044 | |||
| 2000 | 138 | 960 | 139 | 955 | 140 | 870 | |||
| 1999 | 134 | 879 | 135 | 870 | 136 | 851 | |||
| 1998 | 136 | 835 | 137 | 826 | 138 | 823 | |||
| 1997 | 138 | 796 | 139 | 779 | 140 | 775 | |||
| 1996 | 141 | 720 | 142 | 707 | 143 | 705 | |||
| 1995 | 143 | 609 | 144 | 608 | 145 | 606 | |||
| 1994 | 139 | 517 | 140 | 472 | 141 | 461 | |||
| 1993 | 149 | 381 | 150 | 376 | 151 | 375 | |||
| 1992 | 151 | 369 | 152 | 365 | 153 | 346 | |||
| 1991 | 160 | 336 | 161 | 331 | 162 | 314 | |||
| 1990 | 162 | 322 | 163 | 316 | 164 | 316 | |||
| 1989 | 144 | 311 | 145 | 309 | 146 | 305 | |||
| 1988 | 150 | 284 | 151 | 282 | 152 | 278 | |||
| 1987 | 152 | 259 | 153 | 250 | 154 | 248 | |||
| 1986 | 141 | 303 | 142 | 280 | 143 | 271 | |||
| 1985 | 138 | 303 | 139 | 293 | 140 | 286 | |||
| 1980 | 146 | 201 | 147 | 193 | 148 | 131 | |||
| 1975 | 121 | 188 | 122 | 176 | 123 | 170 | |||
| 1970 | 117 | 115 | 118 | 112 | 119 | 111 | |||
| 1960 | 87 | 93 | 88 | 89 | 89 | 89 | |||
IMF data
| Nominal GDP comparison between main world countries (IMF WEO data Oct.2015; in billions of US dollars )[4] | ||||||||||||||||
| country | 2014 | 2013 | 2012 | 2011 | 2010 | 2009 | 2008 | 2007 | 2006 | 2005 | 2000 | 1996 | 1995 | 1990 | 1985 | 1980 |
| World | 77,269 | 75,467 | 73,777 | 72,423 | 65,339 | 59,683 | 63,014 | 57,516 | 50,946 | 47,028 | 33,456 | 31,535 | 30,681 | 23,216 | 12,270 | 11,137 |
| 17,348 | 16,663 | 16,155 | 15,518 | 14,964 | 14,419 | 14,719 | 14,478 | 13,856 | 13,094 | 10,285 | 8,100 | 7,664 | 5,980 | 4,347 | 2,862 | |
| 10,357 | 9,491 | 8,462 | 7,493 | 6,040 | 5,060 | 4,559 | 3,523 | 2,730 | 2,269 | 1,205 | 861 | 732 | 393 | 308 | 304 | |
| 4,602 | 4,920 | 5,957 | 5,909 | 5,499 | 5,035 | 4,849 | 4,356 | 4,357 | 4,572 | 4,731 | 4,706 | 5,334 | 3,104 | 1,385 | 1,087 | |
| 3,874 | 3,746 | 3,542 | 3,761 | 3,423 | 3,427 | 3,770 | 3,445 | 3,005 | 2,866 | 1,956 | 2,505 | 2,594 | 1,593 | 659 | 851 | |
| 2,950 | 2,678 | 2,624 | 2,593 | 2,407 | 2,311 | 2,786 | 2,963 | 2,583 | 2,412 | 1,549 | 1,305 | 1,236 | 1,093 | 490 | 565 | |
| 2,834 | 2,811 | 2,683 | 2,865 | 2,652 | 2,701 | 2,937 | 2,667 | 2,327 | 2,207 | 1,372 | 1,615 | 1,611 | 1,279 | 560 | 705 | |
| 2,347 | 2,391 | 2,412 | 2,613 | 2,209 | 1,667 | 1,695 | 1,396 | 1,108 | 892 | 657 | 854 | 786 | 475 | 237 | 152 | |
| 2,148 | 2,138 | 2,076 | 2,280 | 2,131 | 2,192 | 2,403 | 2,207 | 1,945 | 1,857 | 1,146 | 1,310 | 1,172 | 1,140 | 446 | 470 | |
| 2,051 | 1,875 | 1,836 | 1,843 | 1,708 | 1,365 | 1,224 | 1,239 | 949 | 834 | 477 | 400 | 367 | 327 | 238 | 189 | |
| 1,861 | 2,079 | 2,016 | 1,905 | 1,525 | 1,223 | 1,661 | 1,300 | 990 | 764 | 260 | 392 | 313 | ||||
| 783 | 914 | 940 | ||||||||||||||
| 1,785 | 1,839 | 1,833 | 1,789 | 1,614 | 1,371 | 1,543 | 1,458 | 1,311 | 1,164 | 739 | 627 | 602 | 592 | 363 | 273 | |
| 1,443 | 1,497 | 1,555 | 1,500 | 1,245 | 982 | 1,036 | 947 | 781 | 734 | 397 | 425 | 379 | 323 | 174 | 163 | |
| 1,410 | 1,306 | 1,223 | 1,202 | 1,094 | 902 | 1,002 | 1,123 | 1,012 | 898 | 562 | 598 | 556 | 279 | 100 | 65 | |
| 1,407 | 1,393 | 1,356 | 1,496 | 1,434 | 1,503 | 1,643 | 1,481 | 1,266 | 1,159 | 597 | 639 | 612 | 534 | 181 | 230 | |
| Comparison of Nominal GDP ranking between main countries ( based on Nominal GDP, IMF WEO data Oct.2015 )[4] | ||||||||||||||||
| country | 2014 | 2013 | 2012 | 2011 | 2010 | 2009 | 2008 | 2007 | 2006 | 2005 | 2000 | 1996 | 1995 | 1990 | 1985 | 1980 |
| 1 | 1 | 1 | 1 | 1 | 1 | 1 | 1 | 1 | 1 | 1 | 1 | 1 | 1 | 1 | 1 | |
| 2 | 2 | 2 | 2 | 2 | 2 | 3 | 3 | 4 | 5 | 6 | 7 | 8 | 12 | 9 | 8 | |
| 3 | 3 | 3 | 3 | 3 | 3 | 2 | 2 | 2 | 2 | 2 | 2 | 2 | 2 | 2 | 2 | |
| 4 | 4 | 4 | 4 | 4 | 4 | 4 | 4 | 3 | 3 | 3 | 3 | 3 | 3 | 4 | 4 | |
| 5 | 6 | 6 | 7 | 6 | 6 | 5 | 5 | 5 | 4 | 4 | 6 | 5 | 6 | 6 | 6 | |
| 6 | 5 | 5 | 5 | 5 | 5 | 6 | 6 | 6 | 6 | 5 | 4 | 4 | 4 | 5 | 5 | |
| 7 | 7 | 7 | 6 | 7 | 8 | 10 | 10 | 10 | 11 | 10 | 8 | 7 | 11 | 11 | 17 | |
| 8 | 8 | 8 | 8 | 8 | 7 | 7 | 7 | 7 | 7 | 7 | 5 | 6 | 5 | 7 | 7 | |
| 9 | 10 | 10 | 10 | 9 | 11 | 12 | 12 | 14 | 13 | 13 | 14 | 14 | 13 | 10 | 14 | |
| 10 | 9 | 9 | 9 | 11 | 12 | 11 | 11 | 12 | 14 | 21 | 16 | 17 | ||||
| 7 | 3 | 3 | ||||||||||||||
| 11 | 11 | 11 | 11 | 10 | 10 | 9 | 9 | 8 | 8 | 8 | 10 | 10 | 8 | 8 | 9 | |
| 12 | 12 | 12 | 12 | 13 | 13 | 15 | 15 | 15 | 15 | 15 | 13 | 13 | 14 | 14 | 16 | |
| 13 | 14 | 14 | 14 | 14 | 14 | 13 | 13 | 11 | 10 | 12 | 11 | 11 | 17 | 21 | 29 | |
| 14 | 13 | 13 | 13 | 12 | 9 | 8 | 8 | 9 | 9 | 11 | 9 | 9 | 10 | 13 | 12 | |
| Comparison for percentage share of world nominal GDP (IMF WEO data Oct.2015; % )[4] | ||||||||||||||||
| country | 2014 | 2013 | 2012 | 2011 | 2010 | 2009 | 2008 | 2007 | 2006 | 2005 | 2000 | 1996 | 1995 | 1990 | 1985 | 1980 |
| World | 100 | 100 | 100 | 100 | 100 | 100 | 100 | 100 | 100 | 100 | 100 | 100 | 100 | 100 | 100 | 100 |
| 22.45 | 22.08 | 21.90 | 21.43 | 22.90 | 24.16 | 23.36 | 25.17 | 27.20 | 27.84 | 30.74 | 25.69 | 24.98 | 25.76 | 35.43 | 25.70 | |
| 13.40 | 12.58 | 11.47 | 10.35 | 9.24 | 8.48 | 7.23 | 6.13 | 5.36 | 4.82 | 3.60 | 2.73 | 2.39 | 1.69 | 2.51 | 2.73 | |
| 5.96 | 6.52 | 8.07 | 8.16 | 8.42 | 8.44 | 7.70 | 7.57 | 8.55 | 9.72 | 14.14 | 14.92 | 17.39 | 13.37 | 11.28 | 9.76 | |
| 5.01 | 4.96 | 4.80 | 5.19 | 5.24 | 5.74 | 5.98 | 5.99 | 5.90 | 6.09 | 5.85 | 7.94 | 8.46 | 6.86 | 5.37 | 7.64 | |
| 3.82 | 3.55 | 3.56 | 3.58 | 3.68 | 3.87 | 4.42 | 5.15 | 5.07 | 5.13 | 4.63 | 4.14 | 4.03 | 4.71 | 3.99 | 5.07 | |
| 3.67 | 3.72 | 3.64 | 3.96 | 4.06 | 4.53 | 4.66 | 4.64 | 4.57 | 4.69 | 4.10 | 5.12 | 5.25 | 5.51 | 4.56 | 6.33 | |
| 3.04 | 3.17 | 3.27 | 3.61 | 3.38 | 2.79 | 2.69 | 2.43 | 2.17 | 1.90 | 1.96 | 2.71 | 2.56 | 2.05 | 1.93 | 1.37 | |
| 2.78 | 2.83 | 2.81 | 3.15 | 3.26 | 3.67 | 3.81 | 3.84 | 3.82 | 3.95 | 3.42 | 4.15 | 3.82 | 4.91 | 3.64 | 4.22 | |
| 2.65 | 2.48 | 2.49 | 2.54 | 2.61 | 2.29 | 1.94 | 2.15 | 1.86 | 1.77 | 1.42 | 1.27 | 1.19 | 1.41 | 1.94 | 1.70 | |
| 2.41 | 2.75 | 2.73 | 2.63 | 2.33 | 2.05 | 2.64 | 2.26 | 1.94 | 1.62 | 0.78 | 1.24 | 1.02 | ||||
| 3.37 | 7.45 | 8.44 | ||||||||||||||
| 2.31 | 2.44 | 2.48 | 2.47 | 2.47 | 2.30 | 2.45 | 2.53 | 2.57 | 2.48 | 2.21 | 1.99 | 1.96 | 2.55 | 2.96 | 2.45 | |
| 1.87 | 1.98 | 2.11 | 2.07 | 1.91 | 1.64 | 1.64 | 1.65 | 1.53 | 1.56 | 1.19 | 1.35 | 1.24 | 1.39 | 1.42 | 1.46 | |
| 1.83 | 1.73 | 1.66 | 1.66 | 1.68 | 1.51 | 1.59 | 1.95 | 1.99 | 1.91 | 1.68 | 1.90 | 1.81 | 1.20 | 0.82 | 0.59 | |
| 1.82 | 1.85 | 1.84 | 2.07 | 2.20 | 2.52 | 2.61 | 2.58 | 2.48 | 2.47 | 1.78 | 2.02 | 2.00 | 2.30 | 1.48 | 2.07 | |
| Comparison of China's historical Nominal GDP per capita rankings in the world by year (World Bank WDI data FEB.17, 2016; GDP pc: abbreviation of GDP per capita )[4] | |||||||||
| year | former | middle | later | ||||||
| rank | country | GDP pc | rank | country | GDP pc | rank | country | GDP pc | |
| 2014 | |||||||||
| 10 | 54,411 | 11 | 54,370 | 12 | 52,315 | ||||
| 13 | 52,225 | 14 | 51,433 | 15 | 50,304 | ||||
| 14 | 51,433 | 15 | 50,304 | 16 | 50,016 | ||||
| 16 | 50,016 | 17 | 47,774 | 18 | 47,682 | ||||
| 18 | 47,682 | 19 | 45,729 | 20 | 44,332 | ||||
| 19 | 45,729 | 20 | 44,332 | 21 | 43,363 | ||||
| 26 | 37,222 | 27 | 36,222 | 28 | 35,335 | ||||
| 27 | 36,222 | 28 | 35,335 | 29 | 30,272 | ||||
| 28 | 35,335 | 29 | 30,272 | 30 | 27,970 | ||||
| 29 | 30,272 | 30 | 27,970 | 31 | 26,701 | ||||
| 58 | 12,735 | 59 | 12,718 | 60 | 12,400 | ||||
| 60 | 12,400 | 61 | 11,573 | 62 | 11,484 | ||||
| 65 | 11,049 | 66 | 10,784 | 67 | 10,381 | ||||
| 79 | 7,751 | 80 | 7,572 | 81 | 7,410 | ||||
| 144 | 1,619 | 145 | 1,608 | 146 | 1,574 | ||||
| 2013 | 84 | 7,093 | 85 | 6,975 | 86 | 6,957 | |||
| 2012 | 90 | 6,252 | 91 | 6,249 | 92 | 6,068 | |||
| 2011 | 91 | 5,685 | 92 | 5,561 | 93 | 5,479 | |||
| 2010 | 94 | 4,576 | 95 | 4,504 | 96 | 4,481 | |||
| 2009 | 100 | 3,886 | 101 | 3,791 | 102 | 3,776 | |||
| 2008 | 110 | 3,485 | 111 | 3,433 | 112 | 3,264 | |||
| 2007 | 114 | 2,715 | 115 | 2,667 | 116 | 2,563 | |||
| 2006 | 118 | 2,128 | 119 | 2,077 | 120 | 2,007 | |||
| 2005 | 116 | 1,820 | 117 | 1,735 | 118 | 1,728 | |||
| 2004 | 113 | 1,665 | 114 | 1,494 | 115 | 1,430 | |||
| 2003 | 112 | 1,538 | 113 | 1,277 | 114 | 1,228 | |||
| 2002 | 115 | 1,197 | 116 | 1,138 | 117 | 1,136 | |||
| 2001 | 115 | 1,189 | 116 | 1,044 | 117 | 1,031 | |||
| 2000 | 119 | 1,002 | 120 | 951 | 121 | 924 | |||
| 1995 | 125 | 617 | 126 | 604 | 127 | 600 | |||
| 1990 | 131 | 345 | 132 | 343 | 133 | 330 | |||
| 1985 | 125 | 303 | 126 | 291 | 127 | 286 | |||
| 1980 | 126 | 308 | 127 | 308 | 128 | 301 | |||
Notes
- ^ the average exchange rate of CNY to USD is CNY 6.3125 per USD in 2012. also see List of CNY exchange rates.
See also
External links
References
- ↑ "China's GDP already surpasses the 19 countries that make Eurozone in 2018 | NextBigFuture.com". NextBigFuture.com. 2018-03-18. Retrieved 2018-04-08.
- 1 2 3 4 5 China NBS / Bulletin on Reforming China 's GDP Accounting and Data Release System: stats.gov.cn (12-Jan-17) or China NBS Announcement: GDP Revision according to SNA2008 (Chinese), China revises Historical GDP according to SNA2008; see finance.qq.com, sina.com.cn
- ↑ China Economic History
- 1 2 3 4 5 6 7 IMF WEO: from IMF: World Economic Outlook Databases - World Economic Outlook Database October 2015 (October 06, 2015)
- 1 2 3 4 the annual data of China'GDP: published on China NBS: National data - annual - national accounts - Gross Domestic Product; Figures for the current year 2015 are based on the Statistical Communiqué of the People's Republic of China on the 2017 National Economic and Social Development.
- ↑ Purchasing power parity (PPP) for Chinese yuan is estimate according to IMF WEO (April 2018) data; Exchange rate of CN¥ to US$ is according to State Administration of Foreign Exchange, published on China Statistical Yearbook.
- ↑ Searched the web China NBS about the third National Economic Census.
- ↑ Quarterly GDP figures are from China NBS Quarterly Data (old edition) Archived 2015-06-30 at the Wayback Machine. or English (new)
- 1 2 3 4 5 United Nations data: from United Nations: National Accounts Main Aggregates Database - Latest Data Upload (December 2015)
- 1 2 3 4 5 World bank - WDI: from World bank / World Development Indicators (WDI): GDP at market prices (current US$) or GDP (current LCU)
- 1 2 3 4 5 6 7 8 9 Figures of the former Soviet Union: according to United Nations: National Accounts main aggregates database (loaded on December 2015).
Further reading
- Ta-Chung Liu, Kung-Chia Yeh: The Economy of the Chinese Mainland. National Income and Economic Development, 1933-1959. Princeton N. J. Princeton University Press