Global Peace Index
Global Peace Index (GPI) measures the relative position of nations' and regions' peacefulness.[1] The GPI ranks 163 independent states and territories according to their levels of peacefulness.
The GPI is a report produced by the Institute for Economics and Peace (IEP) and developed in consultation with an international panel of peace experts from peace institutes and think tanks with data collected and collated by the Economist Intelligence Unit. The Index was first launched in May 2007, with subsequent reports being released annually. It is claimed to be the first study to rank countries around the world according to their peacefulness. In 2017 it ranked 163 countries, up from 121 in 2007. In the past decade, the GPI has presented trends of increased global violence and less peacefulness.[2] The study is the brainchild of Australian technology entrepreneur Steve Killelea, founder of Integrated Research, and is endorsed by individuals such as former UN Secretary-General Kofi Annan, the Dalai Lama, archbishop Desmond Tutu, former President of Finland and 2008 Nobel Peace Prize laureate Martti Ahtisaari, Nobel laureate Muhammad Yunus, economist Jeffrey Sachs, former president of Ireland Mary Robinson, former Deputy Secretary-General of the United Nations Jan Eliasson and former United States president Jimmy Carter. The updated index is released each year at events in London, Washington, DC; and at the United Nations Secretariat in New York between many others.
The GPI gauges global peace using three broad themes: the level of societal safety and security, the extent of ongoing domestic and international conflict and the degree of militarization.[1] Factors are both internal such as levels of violence and crime within the country and external such as military expenditure and wars. It has been criticised by Riane Eisler for not including indicators specifically relating to violence against women and children, however reliable international data on these subjects is either unavailable or very sparsely reported in many countries.
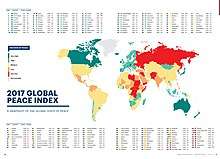
The 2017 GPI indicates Iceland, New Zealand, Portugal, Austria, and Denmark to be the most peaceful countries and Syria, Afghanistan, Iraq, South Sudan, and Yemen to be the least peaceful.[3] Long-term findings of the 2017 GPI include a less peaceful world over the past decade, a 2.14 per cent deterioration in the global level of peace in the past decade, growing inequality in peace between the most and least peaceful countries, a long-term reduction in the GPI Militarization domain, and a widening impact of terrorism, with historically high numbers of people killed in terrorist incidents over the past 5 years.[1]
Expert panel
The expert panel for the 2016 and 2017 GPI consisted of:
- Professor Kevin P. Clements, Foundation Chair of Peace and Conflict Studies and Director, National Centre for Peace and Conflict Studies, University of Otago, New Zealand
- Dr Sabina Alkire, Director, Oxford Poverty & Human Development Initiative (OPHI), University of Oxford, United Kingdom
- Dr Ian Anthony, Research Coordinator and Director of the Programme on Arms Control, Disarmament and Non-proliferation, Stockholm International Peace Research Institute (SIPRI), Sweden
- Ms Isabelle Arrandon, Director of Research and Deputy Director of Communications & Outreach, International Crisis Group, Belgium
- Dr Manuela Mesa, Director, Centre for Education and Peace Research (CEIPAZ) and President, Spanish Association for Peace Research (AIPAZ), Madrid, Spain
- Mr Nick Grono, CEO, The Freedom Fund, United Kingdom
- Dr Ekaterina Stepanova, Head, Unit on Peace and Conflict Studies, Institute of the World Economy and International Relations (IMEMO), Russian Academy of Sciences, Russia
Methodology
In assessing peacefulness, the GPI investigates the extent to which countries are involved in ongoing domestic and international conflicts. It also seeks to evaluate the level of harmony or discord within a nation; ten indicators broadly assess what might be described as a safety and security in society. The assertion is that low crime rates, minimal incidences of terrorist acts and violent demonstrations, harmonious relations with neighboring countries, a stable political scene and a small proportion of the population being internally displaced or refugees can be suggestive of peacefulness.
In 2017, 23 indicators were used to establish each country's peacefulness score. The indicators were originally selected with the assistance of an expert panel in 2007 and are reviewed by the expert panel on an annual basis. The scores for each indicator are normalized on a scale of 1-5, whereby qualitative indicators are banded into five groupings and quantitative ones are scored from 1-5, to the third decimal point. A table of the indicators is below.[4] In the table, UCDP stands for the Uppsala Conflict Data Program maintained by the University of Uppsala in Sweden, EIU for The Economist Intelligence Unit, UNSCT for the United Nations Survey of Criminal Trends and Operations of Criminal Justice Systems, ICPS is the International Center for Prison Studies at King's College London, IISS for the International Institute for Strategic Studies publication The Military Balance, and SIPRI for the Stockholm International Peace Research Institute Arms Transfers Database.
| # | Indicator | Source | Coding |
| 1 | Number and duration of internal conflicts[5] | UCDP, IEP | Total number |
| 2 | Number of deaths from external organized conflict | UCDP Armed Conflict Dataset | Total number |
| 3 | Number of deaths from internal organised conflict | International Institute for Strategic Studies, Armed Conflict Database | Total number |
| 4 | Number, duration, and role in external conflicts | UCDP Battle-related Deaths Dataset, IEP | Total number |
| 5 | Intensity of organised internal conflict | EIU | Qualitative scale, ranked 1 to 5 |
| 6 | Relations with neighbouring countries | EIU | Qualitative scale, ranked 1 to 5 |
| 7 | Level of perceived criminality in society | EIU | Qualitative scale, ranked 1 to 5 |
| 8 | Number of refugees and displaced persons as percentage of population | UNHCR and IDMC | Refugee population by country or territory of origin, plus the number of a country's internally displaced people (IDP's) as a percentage of the country's total population |
| 9 | Political instability | EIU | Qualitative scale, ranked 1 to 5 |
| 10 | Impact of terrorism | Global Terrorism Index (IEP) | Quantitative scale, ranked 1 to 5 |
| 11 | Political terror | Amnesty International and US State Department | Qualitative scale, ranked 1 to 5 |
| 12 | Number of homicides per 100,000 people | UNODC Surveys on Crime Trends and the Operations of Criminal Justice Systems (CTS); EIU estimates | Total number |
| 13 | Level of violent crime | EIU | Qualitative scale, ranked 1 to 5 |
| 14 | Likelihood of violent demonstrations | EIU | Qualitative scale, ranked 1 to 5 |
| 15 | Number of jailed persons per 100,000 people | World Prison Brief, Institute for Criminal Policy Research at Birkbeck, University of London | Total number |
| 16 | Number of internal security officers and police per 100,000 people | UNODC CTS; EIU estimates | Total number; Civil police force distinct from national guards or local militia[6] |
| 17 | Military expenditure as a percentage of GDP | The Military Balance and IISS | Cash outlays of central or federal government to meet costs of national armed forces, as a percentage of GDP, scores from 1 to 5 based on percentages[7] |
| 18 | Number of armed-services personnel per 100,000 | The Military Balance and IISS | All full-time active armed-services personnel |
| 19 | Volume of transfers of major conventional weapons as recipient (imports) per 100,000 people | SIPRI Arms Transfers Database | Imports of major conventional weapons per 100,000 people[8] |
| 20 | Volume of transfers of major conventional weapons as supplier (exports) per 100,000 people | SIPRI Arms Transfers Database | Exports of major conventional weapons per 100,000 people |
| 21 | Financial contribution to UN peacekeeping missions | United Nations Committee on Contributions and IEP | percentage of countries’ “outstanding payments versus their annual assessment to the budget of the current peacekeeping missions” over an average of three years, scored from 1-5 scale based on percentage of promised contributions met |
| 22 | Nuclear and heavy weapons capability | The Military Balance, IISS, SIPRI, UN Register of Conventional Arms and IEP | 1-5 scale based on accumulated points; 1 point per armoured vehicle and artillery pieces, 5 points per tank, 20 points per combat aircraft, 100 points per warship, 1000 points for aircraft carrier and nuclear submarine[9] |
| 23 | Ease of access to small arms and light weapons | EIU | Qualitative scale, ranked 1 to 5 |
Indicators not already ranked on a 1 to 5 scale were converted by using the following formula: x=(x-Min(x))/(Max(x)-Min(x)) where Max(x) and Min(x) are the highest and lowest values for that indicator of the countries ranked in the index. The 0 to 1 scores that resulted were then converted to the 1 to 5 scale. Individual indicators were then weighted according to the expert panel's judgment of their importance. The scores were then tabulated into two weighted sub-indices: internal peace, weighted at 60% of a country's final score, and external peace, weighted at 40% of a country's final score. ‘Negative Peace’ which is defined as the absence of violence, or fear of violence is used as the definition of peace to create the Global Peace Index. An additional aim of the GPI database is to facilitate deeper study of the concept of positive peace, or those attitudes, institutions, and structures that drive peacefulness in society. The GPI also examines relationships between peace and reliable international measures, including democracy and transparency, education and material well-being. As such, it seeks to understand the relative importance of a range of potential determinants, or "drivers", which may influence the nurturing of peaceful societies, both internally and externally.[10]
The main findings of the 2017 Global Peace Index are:[1]
- The overall score for the 2017 GPI improved slightly this year due to gains in six of the nine geographical regions represented. More countries improved their levels of peacefulness, than deteriorated: 93 compared to 68.
- Peacebuilding activities can be highly cost-effective, providing cost savings 16 times the cost of the intervention.
- The global economic impact of violence was $14.3 trillion PPP in 2016, equivalent to 12.6 per cent of global GDP, or $1,953 per person.
- In Low-Peace environments, the factors that matter the most are related to Well-Functioning Government, Low Levels of Corruption, Acceptance of the Rights of Others and Good Relations with Neighbours
- Due to armed conflict in MENA, many related indicators such as deaths from internal conflict, number of refugees and IDPs, and organised internal conflict are at high levels.
- Safety and Security improved due to many countries recording a lower homicide rate and lower levels of political terror.
Statistical analysis is applied to GPI data to uncover specific conditions conducive of peace. Researchers have determined that Positive Peace, which includes the attitudes, institutions, and structures that pre-empt conflict and facilitate functional societies, is the main driver of peace. The eight pillars of positive peace are well-functioning government, sound business environment, acceptance of the rights of others, good relations with neighbors, free flow of information, high levels of human capital, low levels of corruption, and equitable distribution of resources. Well-functioning government, low levels of corruption, acceptance of the rights of others and good relations with neighbours are more important in countries suffering from high levels of violence. Free flow of information and sound business environment become more important when a country is approaching the global average level of peacefulness, also described as the Mid-Peace level. Low levels of corruption is the only Pillar that is strongly significant across all three levels of peacefulness. This suggests it is an important transformational factor at all stages of nations’ development.
International response to the GPI
The Index has received endorsements as a political project from a number of major international figures, including the former Secretary-General of the United Nations Kofi Annan, former President of Finland and 2008 Nobel Peace Prize laureate Martti Ahtisaari, the Dalai Lama, archbishop Desmond Tutu, Muhammad Yunus, and former United States President Jimmy Carter[11] Steve Killelea A.M., the Australian philanthropist who conceived the idea of the Index, argues that the Index "is a wake-up call for leaders around the globe.[12]
The Index has been widely recognized. Professor Jeffrey Sachs, Director of the Earth Institute at Columbia University said: "The GPI continues its pioneering work in drawing the world’s attention to the massive resources we are squandering in violence and conflict. The lives and money wasted in wars, incarcerations, weapons systems, weapons trade, and more, could be directed to ending poverty, promoting education, and protecting the environment. The GPI will not only draw attention to these crucial issues, but help us understand them and to invest productively in a more peaceful world.”[13]
Marla Mossman of the Peace Alliance Leadership Council said she believes that the measurements of the Global Peace Index can be useful for crafting government policy, helping governments to identify problems and develop practical and relevant policies. Furthermore, she said that she saw the Index indicators as, “the measurements of the health of the nation. So we really can take the temperature of the world: are we healthy? Do we have a fever?”[14]
Following the release of the 2015 GPI, Professor Sir Lawrence Freedman of King's College in London called the Index, “an extraordinarily useful body of information,” and its analysis “the best indicator of future conflict is past conflict. The challenge is how we break that cycle.”[15]
The Economist, in publishing the first edition of the index in 2007, admitted that, "the index will run into some flak." Specifically, according to The Economist, the weighting of military expenditure "may seem to give heart to freeloaders: countries that enjoy peace precisely because others (often the USA) care for their defense." The true utility of the index may lie not in its specific rankings of countries now, but in how those rankings change over time, thus tracking when and how countries become more or less peaceful.[16]
In 2012, the Economist suggested that “quantifying peace is a bit like trying to describe how happiness smells.” The publication admitted that the GPI has produced some “surprising results” and argued that “part of the appeal of the index is that readers can examine each of the variables in turn and think about how much weight to add to each.”[17]
The Australian National University says that the GPI report “presents the latest and most comprehensive global data on trends in peace, violence and war” and “provides the world’s best analysis of the statistical factors associated with long-term peace as well as economic analysis on the macroeconomic impacts of everyday violence and war on the global economy.”[18]
The GPI has been criticised for not including indicators specifically relating to violence against women and children. Back in 2007, Riane Eisler, writing in the Christian Science Monitor, argued that, "to put it mildly, this blind spot makes the index very inaccurate. She mentions a number of specific cases, including Egypt, where she claims 90% of women are subject to genital mutilation, and China, where, she says, "female infanticide is still a problem," according to a 2000 UNICEF study.[19]
Senior Analyst at the Institute for Near East and Gulf Military Analysis, Sabhat Khan, argued that the Index should “involve more context on security environments.” Referring to the UAE's GPI ranking in particular, Khan argued that “the measurement usually used by such rankings is crude data without contextualising them;”[20] for example, the UAE must bolster its security apparatus to respond to turbulence in neighbouring countries such as Iraq, Syria, and Yemen, which all rank at the very bottom of the GPI.
World leaders talking about the GPI
During a Peace Forum in August 2017, Honduran President Juan Orlando Hernandez said that “receiving such high praise from an institute that once named this country the most violent in the world is extremely significant…My administration will keep fighting to protect all Honduran citizens.” The President has recently launched an initiative to build a series of safe parks across Honduras and hopes to see further improvement reflected in future GPI rankings.[21]
Malaysia ranked 29th in the 2017 GPI. The country's Communications and Multimedia Minister, Datuk Seri Salleh Said Keruak said that this ranking along with Malaysia's high place in the 2017 World Happiness Report was proof that the “government’s efforts have made Malaysia a safe and prosperous country.” He also admitted, “there’s still much room for improvement to make Malaysia the best among the better countries and that’s what we’re doing now.”[22]
After the release of the 2016 GPI, the Botswanan Office of the President released a proud statement, “in this year’s Index, Botswana was ranked as 28 out of 163 countries, up 3 places from last year. This continues to place Botswana above over half of the European region countries surveyed as well as all five of the Permanent Members of the United Nations Security Council…in addition Botswana was one of only five countries, to achieve a perfect score in the domestic and international conflict domain.”[23]
Navid Hanif, Director of the United Nations Office for ECOSOC Support and Coordination said, “it’s intuitive that peace is useful and peacefullness is a reward in itself, but the IEP is trying to make the conclusion more evidence-based. Now that the index covers 99% of the population, it has come a long way. The report systemically measures peacefulness and identifies the determinants of peace.”[24]
Reacting to the 2017 results of the GPI, which ranked the Philippines 138 out of 163 countries, mainly because of poor scores in societal safety and security due to President Duterte's war on drugs, Philippine Presidential spokesman Ernesto Abella countered, “We’re not entirely sure where the GPI, Global Peace Index analyst… who apparently is supposed to be a local, is really coming from. Maybe there’s a political slant somewhere…based on survey results, the net satisfaction of Filipino people is quite high.”[25]
Sierra Leone ranked 39th in the 2017 Global Peace Index. Former Chief of Staff and Office of National Security (ONS) advisor, Dr. Jonathan PJ Sandy, “Welcomed the 2017 Global Peace Index report released recently which ranked Sierra Leone in first position, as the most peaceful country in West Africa and third in the African continent…He observed that going by the report itself, [future] elections might be successfully held.” Presidential Spokesman, Abdulai Bayraytay “said the favourable Global Peace rating of Sierra Leone would serve as an impetus for the country to do more.”[26]
Media coverage
The Independent: Global Peace Index: US Facing New Era of Instability as Middle East Sinks Further into Turmoil: “An annual global peace index has concluded that US political turmoil had pushed North America into deep instability in 2016 while the Middle East sank deeper into turmoil. Despite depicting tumult across continents, the 2017 Global Peace Index said the world had overall become more peaceful in the past year when measured against a range of indicators.”[27]
BBC: Global Peace Index 2017: World 0.28% more peaceful than last year: “Levels of peace around the world have improved slightly for the first time since the Syrian war began, but harmony has decreased in the US and terrorism records have increased, a Sydney-based think-tank has found.”[28]
Forbes: “The Global Peace Index, which the Institute compiles annually, paints a sombre picture: The world has become even less peaceful in 2016, continuing a decade-long trend of increased violence and strife. Published every year since 2008, the Index ranks 163 independent states and territories by their level of peacefulness.”[2]
Forbes: The World's Most and Least Peaceful Countries [Infographic]: “The 2017 Global Peace Index has found that the world has become a slightly safer place over the past year. However, the political fallout and deep rooted division brought on by the US presidential election campaign has led to a deterioration of peace levels in North America.”[29]
The Guardian: Fraught White House Campaign Blamed as US Bucks Global Trend Towards Peace: “The divisive nature of Donald Trump’s rise to the White House has increased mistrust of the US government and means social problems are likely to become more entrenched, said the authors of the annual Global Peace Index, in which 163 countries and territories are analysed.”[30]
HuffingtonPost: Global Peace Index 2017: Donald Trump Fallout Causes North America To Plummet Down Ranking: “While the world became a safer place to live overall, the 2017 Global Peace Index found disruption caused by the perception of corruption and attacks on media in the US led to its deterioration.”[31]
The Washington Times: U.S. Ranked the 114th Most Peaceful Nation on Earth says Annual Global Ranking: “The index is produced by the Australia-based Institute for Economics and Peace, which figures that the impact of strife worldwide is $14.3 trillion. News is not all bad, though. In a nutshell, the index found that 93 nations became ‘more peaceful’ in the last year, 68 were ‘less peaceful.’”[32]
Business Insider: The 12 Safest Countries in the World: “The think tank Institute for Economics and Peace recently published the Global Peace Index 2017, which reveals the safest — as well as the most dangerous — countries in the world. The report ranked 163 countries based on how peaceful they are. The rankings were determined by 23 factors, which included homicide rate, political terror, and deaths from internal conflict.”[33]
Sputnik International: Terrorism, Conflicts Cost Over $14 Trillion to Global Economy: “According to the latest estimation by the Global Peace Index that annually analyses the costs of security of living in countries and regions, worldwide terrorism is at an all-time high.”[14]
Indian news websites, ZeeNews, HindustanTimes, and Jagran Josh: The three Indian news agencies described the GPI’s ranking system, global peace trends, highlights from that year’s GPI and India’s own placement in the GPI. The Hindustan Times quoted the GPI and emphasized that “violence impacted India’s economy by USD 679.80 billion in 2016, 9 % of India’s GDP, or USD 525 per person”.,,[34][35][36]
Philstar, Filipino newspaper: “Among all the 163 countries, the Philippines is ranked 138. For perspective, India is ranked just one notch above, at 137. Despite this low ranking, however, it has remained relatively stable in this low rank over time a long time. Though the raw score has worsened over the previous year, the country’s rank has not been far off from this rank in previous years…Though the point of view of the report deserves respect concerning societal safety, another side of the story needs more hearing internationally.”[37]
World Economic Forum: These are the Most Peaceful Countries in the World: “The Global Peace Index ranks 163 countries according to their domestic and international conflicts, safety and security and degree of militarization. It found 93 had improved, while 68 had deteriorated, and overall peace levels had inched up 0.28%.”[38]
Academic References
The International Journal of Press/Politics: “Social Media and the Arab Spring: Politics comes first”: This article utilized the findings of the 2010 GPI to construct a human rights index, which was used in their overall study on the use of social media in political uprisings, and in the Arab Spring context in particular.[39]
Journal of Economics and Sustainable Development: “Security Challenges in Nigeria and the Implications for Business Activities and Sustainable Development”: The study utilizes GPI scores from 2009-2012 to examine implications for Nigeria's business environment and overall progress in national security.[40]
Contemporary Security Policy: “Failed states and international order: constructing a post-Westphalian world”: The Global Peace Index, along with four other global indices, is used in this study's ranking of ‘state failure’. “Although this index focuses primarily on trends of armed conflict and violence it is relevant to state weakness and failure as the indicators measured for the assessment of ‘peace’ in this context are also indicative of state capacity.”[41]
Biological Reviews: “Does Infectious Disease cause Global Variation in the Frequency of Intrastate Armed Conflict and Civil War?”: This study used the 2008 Global Peace Index to build what they call a ‘path analysis,’ in which they sought to uncover “whether infectious disease causes the emergence of a collectivist culture.”[42]
Political Research Quarterly: “Measuring the Rule of Law”: This article attempts to measure the rule of law, and in doing so “correlated the rule of law indices with a measure of violent crime (for 2007) included in the Global Peace Index.”[43]
Applied Energy: “The Analysis of Security Cost for Different Energy Sources”: This study utilized the Global Peace Index in calculating a disruption probability from geopolitical instability, with the overall aim of analysing security costs for different sources of energy.[44]
International Political Science Review: “Measuring Effective Democracy: A Defence”: In the construction of an effective democracy index (EDI), the authors built a table that includes 2008 GPI scores as a dependent variable in a regression analysis of economic development and various indices of democracy.[45]
Institute for Security Studies: “African Futures 2050- The Next Forty Years”: The African human security research institution utilized the findings of the Global Peace Index of 2010 to emphasize trends in drug crime and violence on the African continent.[46],[47]
Nature Communications: “Global Priorities for an Effective Information Basis of Biodiversity Distributions”: In their article about insufficient digital accessible information about ecosystems and biodiversity, the authors utilized the GPI to model the “effects of secure conditions” based on the index as a measure of political stability, armed conflict, and public safety levels.[48]
Nordic Journal of Religion and Society: “Why are Danes and Swedes so Irreligious”: This article uses the Global Peace Index, and its very high rankings of Denmark (3rd in 2008) and Sweden (13th in 2008) to support claims that the countries’ lack of religiosity can be linked to prosperous societal structures.[49]
Food Security: “Tracking phosphorus security: indicators of phosphorus vulnerability in the global food system”: Along with eleven other indicators, the GPI was used as a measure of political instability for the development of a utilized in the development of a phosphorus vulnerability analysis, aimed at formulating food production methods and government policy.[50]
World Politics: “The System Worked: Global Economic Governance During the Great Recession”: Drezner uses GPI measurements, particularly the fact that interstate violence and military expenditures have decreased in the years studied, to bolster an argument suggesting that the Great Recession has not led to an increase in global violence and conflict.[51]
Journal of Sustainable Development Studies: “Insecurity and Socio-economic Development in Nigeria”: This sustainable development study utilized the GPI, in conjunction with the Human Development Index and the Corruption Perception Index to track fluctuations in Nigeria's socio-economic climate and insecurity issues over the past decade.[52]
Harvard Educational Review: “Peace Education in a Violent Culture”: In criticizing the United States’ culture of violence, the author refers to the developed country's remarkably low ranking on the Global Peace Index as evidence of violence's impact on societal peacefulness.[53]
International Security: “The Heart of the Matter: The Security of Women and the Security of States”: In this piece, the authors use the Global Peace Index as one of three measures of state security; the GPI is specifically used as a “general measure of state peacefulness.” The report concludes that higher levels of women's physical security correlates positively with the GPI.[54]
The Equal Rights Review: “The Mental Health Gap in South Africa: A Human Rights Issue”: South Africa's poor GPI ranking, among other measures is cited by the authors as part of their overall argument that the national government is not implementing promises made towards the achievement of equality, as signatories of the United Nations Convention on the Rights of Persons with Disabilities (CRPD).[55]
Environment, Development and Sustainability: “Creating a ‘Values’ Chain for Sustainable Development in Developing Nations: Where Maslow meets Porter”: This study uses the ‘safety and security’ measures of the GPI, including political instability, level of violent crime, and likelihood of violent demonstrations, for supporting an argument that renders societal safety and security necessary for sustainable development.[56]
Global Peace Index rankings
Nations considered more peaceful have lower index scores. In 2013 researchers at the Institute for Economics and Peace harmonized the Global Peace Index database to ensure that the scores were comparable over time. The GPI Expert Panel decided that the Index would include nations and territories, but not micro-states. Countries covered by the GPI must either have a population of more than 1 million or a land area greater than 20,000 square kilometers.[1]
| Country | 2018 rank | 2018 score[57] | 2017 rank | 2017 score[1] | 2016 rank | 2016 score[58] | 2015 rank | 2015 score[59] | 2014 rank | 2014 score[60] | 2013 rank | 2013 score[61] | 2012 rank | 2012 score[62],[63] | 2011 rank | 2011 score[64] | 2010 rank | 2010 score[65] | 2009 rank | 2009 score | 2008 rank | 2008 score |
|---|---|---|---|---|---|---|---|---|---|---|---|---|---|---|---|---|---|---|---|---|---|---|
| 1 | 1.096 | 1 | 1.111 | 1 | 1.192 | 1 | 1.148 | 1 | 1.189 | 1 | 1.162 | 1 | 1.113 | 1 | 1.148 | 2 | 1.212 | 1 | 1.203 | 1 | 1.107 | |
| 2 | 1.192 | 2 | 1.241 | 4 | 1.287 | 4 | 1.221 | 4 | 1.236 | 3 | 1.237 | 2 | 1.239 | 2 | 1.279 | 1 | 1.188 | 2 | 1.227 | 2 | 1.190 | |
| 3 | 1.274 | 4 | 1.265 | 3 | 1.278 | 3 | 1.198 | 3 | 1.200 | 4 | 1.250 | 6 | 1.328 | 6 | 1.337 | 4 | 1.290 | 3 | 1.240 | 10 | 1.291 | |
| 4 | 1.318 | 3 | 1.258 | 5 | 1.356 | 11 | 1.344 | 18 | 1.425 | 18 | 1.467 | 16 | 1.470 | 17 | 1.453 | 13 | 1.366 | 15 | 1.426 | 14 | 1.385 | |
| 5 | 1.353 | 5 | 1.337 | 2 | 1.246 | 2 | 1.150 | 2 | 1.193 | 2 | 1.207 | 2 | 1.239 | 4 | 1.289 | 7 | 1.341 | 6 | 1.263 | 5 | 1.238 | |
| 6 | 1.372 | 8 | 1.371 | 8 | 1.388 | 7 | 1.287 | 7 | 1.306 | 8 | 1.306 | 4 | 1.317 | 8 | 1.355 | 14 | 1.392 | 9 | 1.324 | 6 | 1.264 | |
| 7 | 1.381 | 6 | 1.360 | 6 | 1.360 | 10 | 1.341 | 11 | 1.381 | 14 | 1.404 | 13 | 1.396 | 5 | 1.320 | 12 | 1.360 | 16 | 1.430 | 18 | 1.435 | |
| 8 | 1.382 | 21 | 1.534 | 20 | 1.535 | 24 | 1.490 | 25 | 1.545 | 16 | 1.438 | 23 | 1.521 | 24 | 1.585 | 30 | 1.624 | 18 | 1.439 | 21 | 1.465 | |
| 9 | 1.391 | 10= | 1.408 | 9 | 1.395 | 8 | 1.323 | 8 | 1.316 | 6 | 1.293 | 5 | 1.326 | 3 | 1.287 | 3 | 1.247 | 4 | 1.243 | 3 | 1.230 | |
| 10 | 1.393 | 10= | 1.408 | 12 | 1.433 | 12 | 1.354 | 13 | 1.384 | 12 | 1.370 | 6 | 1.328 | 11 | 1.370 | 6 | 1.337 | 14 | 1.393 | 11 | 1.310 | |
| 11 | 1.396 | 7 | 1.364 | 10 | 1.408 | 15 | 1.378 | 14 | 1.398 | 13 | 1.374 | 8 | 1.330 | 10 | 1.358 | 11 | 1.358 | 10 | 1.343 | 13 | 1.370 | |
| 12 | 1.407 | 9 | 1.373 | 7 | 1.370 | 5 | 1.275 | 5 | 1.258 | 5 | 1.272 | 10 | 1.349 | 16 | 1.421 | 18 | 1.424 | 11 | 1.349 | 4 | 1.234 | |
| 13 | 1.435 | 12 | 1.425 | 15 | 1.465 | 9 | 1.329 | 15 | 1.414 | 16 | 1.438 | 22 | 1.494 | 18 | 1.455 | 19 | 1.467 | 19 | 1.440 | 16 | 1.421 | |
| 14 | 1.502 | 18 | 1.516 | 14 | 1.461 | 13 | 1.360 | 11 | 1.381 | 9 | 1.319 | 14 | 1.419 | 13 | 1.401 | 10 | 1.354 | 5 | 1.253 | 8 | 1.282 | |
| 15 | 1.506 | 17 | 1.515 | 11 | 1.429 | 6 | 1.277 | 6 | 1.297 | 7 | 1.297 | 9 | 1.348 | 7 | 1.352 | 9 | 1.352 | 7 | 1.297 | 7 | 1.273 | |
| 16 | 1.519 | 14 | 1.486 | 17 | 1.500 | 17 | 1.393 | 10 | 1.371 | 11 | 1.359 | 18 | 1.480 | 9 | 1.356 | 5 | 1.322 | 8 | 1.324 | 9 | 1.288 | |
| 17= | 1.531 | 16 | 1.5 | 16 | 1.486 | 16 | 1.379 | 17 | 1.423 | 15 | 1.431 | 15 | 1.424 | 15 | 1.416 | 16 | 1.398 | 17 | 1.443 | 15 | 1.406 | |
| 17= | 1.531 | 15 | 1.494 | 19 | 1.534 | 22 | 1.463 | 21 | 1.482 | 23 | 1.520 | 17 | 1.476 | 20 | 1.495 | 20 | 1.495 | 25 | 1.574 | 20 | 1.452 | |
| 19 | 1.545 | 13 | 1.474 | 13 | 1.445 | 18 | 1.416 | 16 | 1.422 | 20 | 1.487 | 19 | 1.481 | 34 | 1.693 | 36 | 1.665 | 43 | 1.722 | 19 | 1.440 | |
| 20 | 1.548 | 22 | 1.547 | 23 | 1.559 | 25 | 1.503 | 24 | 1.544 | 21 | 1.497 | 21 | 1.487 | |||||||||
| 21 | 1.560 | 19= | 1.525 | 18 | 1.528 | 14 | 1.365 | 9 | 1.354 | 10 | 1.339 | 11 | 1.376 | 14 | 1.413 | 17 | 1.400 | 13 | 1.365 | 13 | 1.368 | |
| 22 | 1.568 | 26 | 1.611 | 24 | 1.603 | 23 | 1.478 | 19 | 1.467 | 33 | 1.622 | 26 | 1.590 | 23 | 1.576 | 21 | 1.536 | 23 | 1.532 | 25 | 1.533 | |
| 23 | 1.574 | 19= | 1.525 | 21 | 1.541 | 20 | 1.432 | 20 | 1.475 | 22 | 1.508 | 28 | 1.606 | 25 | 1.628 | 27 | 1.610 | 29 | 1.609 | 28 | 1.555 | |
| 24 | 1.596 | 25 | 1.6 | 31 | 1.649 | 26 | 1.542 | 35 | 1.677 | 30 | 1.584 | 32 | 1.627 | 40 | 1.742 | 45 | 1.749 | 26 | 1.580 | 26 | 1.537 | |
| 25 | 1.619 | 29 | 1.637 | 30 | 1.648 | 28 | 1.561 | 33 | 1.659 | 29 | 1.574 | 20 | 1.590 | 20 | 1.485 | 22 | 1.539 | 22 | 1.520 | 23 | 1.517 | |
| 26 | 1.635 | 28 | 1.631 | 29 | 1.646 | 32 | 1.607 | 32 | 1.637 | 35 | 1.663 | 39 | 1.699 | 53 | 1.845 | 50 | 1.785 | 46 | 1.738 | 46 | 1.720 | |
| 27 | 1.639 | 31 | 1.665 | 26 | 1.633 | 27 | 1.550 | 26 | 1.548 | 28 | 1.571 | 35 | 1.648 | 37 | 1.699 | 41 | 1.707 | 40 | 1.669 | 52 | 1.760 | |
| 28 | 1.649 | 24 | 1.595 | 27 | 1.635 | 29 | 1.563 | 30 | 1.591 | 31 | 1.589 | 30 | 1.616 | 38 | 1.710 | 28 | 1.616 | 20 | 1.468 | 17 | 1.431 | |
| 29 | 1.659 | 27 | 1.622 | 28 | 1.639 | 31 | 1.597 | 36 | 1.678 | 32 | 1.598 | 31 | 1.621 | 35 | 1.695 | 33 | 1.641 | 31 | 1.634 | 37 | 1.650 | |
| 30 | 1.678 | 23 | 1.568 | 25 | 1.604 | 21 | 1.451 | 26 | 1.548 | 27 | 1.563 | 25 | 1.548 | 28 | 1.641 | 25 | 1.588 | 32 | 1.640 | 27 | 1.550 | |
| 31 | 1.689 | 32 | 1.67 | 32 | 1.680 | 40 | 1.695 | 39 | 1.745 | 41 | 1.772 | 45 | 1.774 | 46 | 1.793 | 54 | 1.827 | 50 | 1.774 | 45 | 1.700 | |
| 32 | 1.727 | 33 | 1.676 | 22 | 1.557 | 19 | 1.430 | 23 | 1.532 | 25 | 1.530 | 24 | 1.524 | 22 | 1.545 | 29 | 1.618 | 28 | 1.597 | 33 | 1.610 | |
| 33 | 1.732 | 36 | 1.712 | 36 | 1.732 | 38 | 1.677 | 31 | 1.635 | 38 | 1.710 | 41 | 1.715 | 47 | 1.798 | 46 | 1.751 | 41 | 1.720 | 32 | 1.650 | |
| 34 | 1.736 | 40 | 1.782 | 41 | 1.787 | 35 | 1.657 | 28 | 1.558 | 26 | 1.538 | 27 | 1.602 | 27 | 1.638 | 35 | 1.664 | 33 | 1.644 | 40 | 1.660 | |
| 35 | 1.740 | 39 | 1.76 | 43 | 1.805 | 59 | 1.864 | 66 | 1.942 | 59 | 1.904 | 52 | 1.855 | 61 | 1.904 | 53 | 1.818 | |||||
| 36 | 1.749 | 37 | 1.732 | 37 | 1.735 | 37 | 1.674 | 46 | 1.797 | 43 | 1.784 | 43 | 1.741 | 43 | 1.760 | 42 | 1.713 | 36 | 1.675 | 48 | 1.670 | |
| 37 | 1.761 | 35 | 1.709 | 35 | 1.726 | 44 | 1.721 | 29 | 1.565 | 24 | 1.528 | 33 | 1.628 | 21 | 1.521 | 24 | 1.568 | 24 | 1.573 | 24 | 1.524 | |
| 38= | 1.766 | 38 | 1.737 | 39 | 1.774 | 36 | 1.669 | 34 | 1.675 | 34 | 1.663 | 38 | 1.690 | 45 | 1.775 | 40 | 1.701 | 39 | 1.693 | 34 | 1.620 | |
| 38= | 1.766 | 44 | 1.797 | 38 | 1.763 | 67 | 1.911 | 66 | 1.942 | 90 | 2.074 | 99 | 2.124 | 105 | 2.239 | 77 | 2.019 | 69 | 1.886 | 35 | 1.630 | |
| 40 | 1.767 | 34 | 1.701 | 33 | 1.699 | 34 | 1.654 | 42 | 1.755 | 40 | 1.755 | 36 | 1.659 | 31 | 1.681 | 26 | 1.590 | 27 | 1.595 | 31 | 1.570 | |
| 41 | 1.772 | 43 | 1.793 | 44 | 1.809 | 54 | 1.840 | 61 | 1.902 | 58 | 1.899 | 50 | 1.807 | 42 | 1.752 | 48 | 1.781 | 55 | 1.795 | 55 | 1.770 | |
| 42 | 1.799 | 58 | 1.909 | 51 | 1.842 | 33 | 1.626 | 37 | 1.679 | 37 | 1.705 | 47 | 1.792 | 29 | 1.667 | 39 | 1.693 | 38 | 1.691 | 42 | 1.670 | |
| 43 | 1.806 | 50 | 1.838 | 55 | 1.873 | 48 | 1.784 | 48 | 1.808 | 46 | 1.807 | 49 | 1.804 | 54 | 1.850 | 59 | 1.864 | 59 | 1.837 | 60 | 1.820 | |
| 44 | 1.811 | 48 | 1.825 | 45 | 1.817 | 51 | 1.814 | 77 | 1.995 | 74 | 1.984 | 60 | 1.894 | 39 | 1.740 | 51 | 1.813 | 51 | 1.776 | 62 | 1.840 | |
| 45 | 1.820 | 65 | 1.944 | 61 | 1.931 | 50 | 1.805 | 40 | 1.748 | 36 | 1.679 | 46 | 1.785 | 33 | 1.690 | 44 | 1.739 | 30 | 1.619 | 29 | 1.557 | |
| 46= | 1.821 | 45 | 1.8 | 52 | 1.852 | 41 | 1.700 | 38 | 1.723 | 39 | 1.724 | 37 | 1.662 | 32 | 1.687 | 34 | 1.661 | 49 | 1.767 | 55 | 1.770 | |
| 46= | 1.821 | 46 | 1.801 | 50 | 1.838 | 43 | 1.706 | 41 | 1.778 | 64 | 1.921 | 58 | 1.884 | 57 | 1.880 | 92 | 2.101 | 88 | 2.060 | 89 | 2.060 | |
| 48 | 1.822 | 41= | 1.786 | 40 | 1.783 | 55 | 1.846 | 44 | 1.791 | 48 | 1.832 | 51 | 1.830 | 52 | 1.833 | 51 | 1.813 | 58 | 1.824 | 52 | 1.760 | |
| 49 | 1.823 | 47 | 1.823 | 53 | 1.858 | 42 | 1.701 | 52 | 1.849 | 47 | 1.822 | 42 | 1.734 | 50 | 1.829 | 43 | 1.715 | 42 | 1.716 | 40 | 1.660 | |
| 50 | 1.826 | 49 | 1.835 | 49 | 1.837 | 64 | 1.903 | 57 | 1.877 | 56 | 1.893 | 61 | 1.899 | 49 | 1.812 | 61 | 1.878 | 66 | 1.862 | 43 | 1.680 | |
| 51 | 1.837 | 54 | 1.876 | 58 | 1.899 | 64 | 1.903 | 59 | 1.889 | 55 | 1.887 | 55 | 1.873 | 56 | 1.858 | 55 | 1.832 | 53 | 1.782 | 56 | 1.790 | |
| 52= | 1.849 | 57 | 1.908 | 54 | 1.867 | 52 | 1.821 | 65 | 1.939 | 69 | 1.961 | 66 | 1.927 | 63 | 1.912 | 65 | 1.925 | 70 | 1.890 | 71 | 1.910 | |
| 52= | 1.849 | 60 | 1.929 | 70 | 1.978 | 49 | 1.805 | 72 | 1.974 | 85 | 2.061 | 78 | 1.994 | 77 | 2.047 | 79 | 2.031 | 75 | 1.969 | 74 | 1.950 | |
| 54 | 1.851 | 56 | 1.888 | 48 | 1.834 | 47 | 1.768 | 52 | 1.849 | 62 | 1.912 | 64 | 1.920 | 84 | 2.071 | 90 | 2.071 | 71 | 1.906 | 80 | 2.020 | |
| 55 | 1.853 | 52 | 1.85 | 42 | 1.799 | 46 | 1.768 | 54 | 1.853 | 54 | 1.879 | 63 | 1.913 | 68 | 1.979 | 67 | 1.946 | 60 | 1.843 | 64 | 1.860 | |
| 56 | 1.869 | 30 | 1.664 | 34 | 1.716 | 30 | 1.568 | 22 | 1.491 | 19 | 1.480 | 12 | 1.395 | 12 | 1.398 | 15 | 1.394 | 12 | 1.357 | 30 | 1.561 | |
| 57 | 1.876 | 41= | 1.786 | 47 | 1.830 | 39 | 1.685 | 47 | 1.798 | 44 | 1.787 | 29 | 1.609 | 26 | 1.631 | 31 | 1.631 | 41 | 1.710 | 48 | 1.740 | |
| 58 | 1.893 | 67 | 1.95 | 57 | 1.884 | 57 | 1.854 | 55 | 1.860 | 73 | 1.976 | 81 | 2.006 | 89 | 2.113 | 88 | 2.060 | 80 | 2.005 | |||
| 59 | 1.895 | 53 | 1.866 | 56 | 1.879 | 58 | 1.860 | 69 | 1.947 | 51 | 1.854 | |||||||||||
| 60 | 1.905 | 59 | 1.919 | 59 | 1.906 | 56 | 1.848 | 45 | 1.792 | 41 | 1.772 | 34 | 1.641 | 30 | 1.670 | 38 | 1.691 | 48 | 1.764 | 42 | 1.730 | |
| 61 | 1.909 | 51 | 1.839 | 46 | 1.829 | 45 | 1.742 | 48 | 1.808 | 53 | 1.863 | 40 | 1.710 | 36 | 1.697 | 32 | 1.636 | 52 | 1.779 | 50 | 1.750 | |
| 62 | 1.913 | 64 | 1.94 | 68 | 1.924 | 51 | 1.844 | 49 | 1.840 | 73 | 1.957 | 71 | 2.013 | 76 | 2.013 | 34 | 1.64 | 37 | 1.650 | |||
| 63 | 1.931 | 82 | 2.023 | 72 | 1.998 | 78 | 1.963 | 84 | 2.014 | 80 | 2.048 | 101 | 2.131 | 96 | 2.159 | 99 | 2.148 | |||||
| 64 | 1.939 | 62 | 1.938 | 65 | 1.953 | 70 | 1.942 | 71 | 1.971 | 74 | 1.984 | 66 | 1.927 | 59 | 1.892 | 66 | 1.938 | 74 | 1.965 | 78 | 2.000 | |
| 65 | 1.946 | 61 | 1.93 | 62 | 1.940 | 81 | 1.987 | 93 | 2.079 | 89 | 2.072 | 87 | 2.039 | 75 | 2.041 | 68 | 1.948 | 56 | 1.808 | 69 | 1.900 | |
| 66 | 1.947 | 55 | 1.88 | 67 | 1.957 | 60 | 1.865 | 43 | 1.789 | 60 | 1.907 | 44 | 1.763 | 55 | 1.852 | 71 | 1.962 | 61 | 1.846 | 55 | 1.770 | |
| 67 | 1.954 | 80 | 2.019 | 97 | 2.133 | 114 | 2.188 | 105 | 2.197 | 110 | 2.230 | 103 | 2.145 | 126 | 2.407 | 133 | 2.621 | 126 | 2.571 | 120 | ||
| 68 | 1.960 | 74 | 2.002 | 69 | 1.975 | 74 | 1.947 | 58 | 1.882 | 66 | 1.931 | 81 | 2.006 | 72 | 2.021 | 64 | 1.924 | 72 | 1.911 | 71 | 1.910 | |
| 69 | 1.973 | 79 | 2.014 | 72 | 1.998 | 77 | 1.958 | 100 | 2.129 | 104 | 2.156 | 114 | 2.231 | |||||||||
| 70 | 1.974 | 72 | 1.992 | 75 | 2.019 | 87 | 2.008 | 103 | 2.150 | 78 | 2.031 | 105 | 2.151 | 93 | 2.137 | 95 | 2.113 | 97 | 2.141 | 82 | 2.030 | |
| 71 | 1.979 | 75 | 2.004 | 91 | 2.086 | 86 | 2.002 | 63 | 1.915 | 57 | 1.897 | 54 | 1.867 | 58 | 1.887 | 58 | 1.861 | 63 | 1.856 | 60 | 1.820 | |
| 72 | 1.980 | 77 | 2.01 | 90 | 2.074 | 101 | 2.102 | 87 | 2.056 | 88 | 2.069 | 85 | 2.028 | 69 | 1.995 | 73 | 1.966 | |||||
| 73 | 1.984 | 70 | 1.983 | 74 | 2.016 | 74 | 1.947 | 59 | 1.889 | 45 | 1.806 | 59 | 1.887 | 41 | 1.743 | 23 | 1.561 | 21 | 1.438 | 22 | 1.467 | |
| 74 | 1.986 | 71 | 1.986 | 85 | 2.057 | 92 | 2.029 | 119 | 2.304 | 114 | 2.258 | 79 | 1.995 | 85 | 2.077 | 89 | 2.067 | 78 | 2.000 | 89 | 2.060 | |
| 75 | 1.987 | 66 | 1.948 | 76 | 2.020 | 84 | 1.997 | 85 | 2.042 | 83 | 2.059 | 85 | 2.028 | 90 | 2.116 | 101 | 2.185 | 105 | 2.197 | 100 | 2.170 | |
| 76 | 1.989 | 110 | 2.211 | 92 | 2.091 | 99 | 2.086 | 94 | 2.085 | 93 | 2.091 | 74 | 1.961 | 62 | 1.910 | 63 | 1.890 | |||||
| 77 | 1.997 | 68 | 1.961 | 80 | 2.037 | 89 | 2.023 | 73 | 1.976 | 84 | 2.060 | 76 | 1.973 | 66 | 1.954 | 77 | 2.019 | 73 | 1.950 | 69 | 1.900 | |
| 78 | 1.998 | 69 | 1.977 | 64 | 1.949 | 76 | 1.952 | 79 | 2.001 | 77 | 2.005 | 72 | 1.955 | 44 | 1.765 | 37 | 1.678 | 37 | 1.686 | 40 | 1.660 | |
| 79 | 2.020 | 73 | 1.998 | 82 | 2.044 | 61 | 1.878 | 86 | 2.052 | 68 | 1.957 | 77 | 1.976 | 65 | 1.947 | 62 | 1.887 | 62 | 1.850 | 58 | 1.810 | |
| 80 | 2.029 | 91 | 2.07 | 88 | 2.063 | 83 | 1.994 | 78 | 1.998 | 87 | 2.064 | 56 | 1.881 | 51 | 1.832 | 57 | 1.852 | 65 | 1.860 | 72 | 1.930 | |
| 81 | 2.037 | 88 | 2.056 | 85 | 2.057 | 82 | 1.988 | 75 | 1.986 | 65 | 1.922 | 70 | 1.951 | 67 | 1.964 | 72 | 1.964 | 64 | 1.858 | 64 | 1.860 | |
| 82 | 2.043 | 81 | 2.021 | 95 | 2.105 | 92 | 2.029 | 83 | 2.013 | 70 | 1.962 | 69 | 1.937 | 88 | 2.112 | 91 | 2.095 | 94 | 2.082 | |||
| 83 | 2.048 | 100 | 2.116 | 98 | 2.140 | 88 | 2.020 | 102 | 2.143 | 102 | 2.148 | 95 | 2.105 | 87 | 2.109 | 86 | 2.057 | 84 | 2.045 | 100 | 2.170 | |
| 84= | 2.053 | 93 | 2.08 | 78 | 2.026 | 62 | 1.878 | 76 | 1.989 | 82 | 2.058 | 80 | 2.001 | 95 | 2.152 | 82 | 2.044 | 76 | 1.967 | |||
| 84= | 2.053 | 97= | 2.095 | 84 | 2.056 | 97 | 2.070 | 89 | 2.065 | 90 | 2.074 | 94 | 2.082 | 79 | 2.051 | 94 | 2.107 | 77 | 1.985 | 89 | ||
| 86 | 2.056 | 78 | 2.013 | 68 | 1.963 | 80 | 1.976 | 82 | 2.004 | 61 | 1.910 | 48 | 1.796 | 48 | 1.809 | 47 | 1.779 | 47 | 1.762 | 45 | 1.700 | |
| 87 | 2.058 | 102 | 2.133 | 94 | 2.092 | 71 | 1.944 | 87 | 2.056 | 79 | 2.044 | 68 | 1.935 | 78 | 2.048 | 83 | 2.048 | 86 | 2.052 | 76 | 1.960 | |
| 88 | 2.064 | 83 | 2.026 | 89 | 2.066 | 98 | 2.074 | 99 | 2.127 | 92 | 2.075 | 107 | 2.179 | 113 | 2.288 | 114 | 2.270 | 120 | 2.406 | 114 | ||
| 89 | 2.065 | 84= | 2.035 | 60 | 1.915 | 53 | 1.839 | 61 | 1.902 | 71 | 1.967 | 65 | 1.923 | 60 | 1.893 | 60 | 1.873 | 45 | 1.735 | 69 | 1.900 | |
| 90 | 2.068 | 92 | 2.072 | 92 | 2.091 | 109 | 2.153 | 107 | 2.203 | 117 | 2.274 | 113 | 2.222 | 106 | 2.244 | 98 | 2.138 | 89 | 2.065 | 89 | ||
| 91 | 2.073 | 99 | 2.114 | 99 | 2.143 | 100 | 2.089 | 95 | 2.093 | 94 | 2.103 | 90 | 2.068 | 91 | 2.125 | 93 | 2.103 | 79 | 2.004 | 83 | ||
| 92 | 2.078 | 76 | 2.007 | 77 | 2.022 | 69 | 1.938 | 64 | 1.929 | 72 | 1.969 | |||||||||||
| 93 | 2.084 | 84= | 2.035 | 83 | 2.045 | 84 | 1.997 | 98 | 2.106 | 105 | 2.159 | 91 | 2.071 | 83 | 2.070 | 87 | 2.058 | 93 | 2.082 | 93 | 2.100 | |
| 94 | 2.092 | 86 | 2.045 | 81 | 2.038 | 90 | 2.025 | 70 | 1.969 | 86 | 2.062 | 84 | 2.021 | 76 | 2.045 | 81 | 2.037 | 82 | 2.041 | 76 | 1.960 | |
| 95 | 2.099 | 87 | 2.052 | 79 | 2.033 | 66 | 1.904 | 68 | 1.945 | 76 | 1.995 | 75 | 1.972 | 81 | 2.059 | 74 | 1.981 | 44 | 1.730 | 50 | 1.750 | |
| 96= | 2.101 | 96 | 2.089 | 101 | 2.148 | 117 | 2.214 | 118 | 2.296 | 116 | 2.272 | 92 | 2.073 | 92 | 2.126 | |||||||
| 96= | 2.101 | 89 | 2.065 | 104 | 2.161 | 111 | 2.179 | 106 | 2.201 | 115 | 2.263 | 108 | 2.207 | 115 | 2.301 | 111 | 2.252 | 101 | 2.178 | 95 | 2.120 | |
| 98= | 2.104 | 95 | 2.087 | 96 | 2.127 | 71 | 1.944 | 56 | 1.861 | 52 | 1.858 | 62 | 1.905 | 64 | 1.918 | 68 | 1.948 | 67 | 1.864 | 61 | 1.830 | |
| 98= | 2.104 | 63 | 1.939 | 66 | 1.954 | 71 | 1.944 | 80 | 2.003 | 67 | 1.954 | |||||||||||
| 100 | 2.109 | 97= | 2.095 | 99 | 2.143 | 96 | 2.064 | 90 | 2.066 | 99 | 2.126 | 93 | 2.076 | 94 | 2.139 | 95 | 2.113 | 91 | 2.075 | 96 | ||
| 101 | 2.112 | 103 | 2.141 | 106 | 2.202 | 110 | 2.163 | 92 | 2.078 | 96 | 2.117 | 109 | 2.208 | 112 | 2.283 | 105 | 2.204 | 85 | 2.046 | 89 | 2.060 | |
| 102 | 2.130 | 94 | 2.084 | 85 | 2.057 | 79 | 1.973 | 111 | 2.225 | 139 | 2.511 | 141 | 2.541 | 134 | 2.558 | 142 | 2.970 | 134 | 2.842 | |||
| 103 | 2.140 | 113 | 2.227 | 128 | 2.323 | 139 | 2.420 | 137 | 2.494 | 135 | 2.444 | 119 | 2.250 | 99 | 2.185 | 75 | 2.012 | 81 | 2.025 | 66 | 1.870 | |
| 104= | 2.144 | 90 | 2.066 | 63 | 1.941 | 63 | 1.891 | 50 | 1.839 | 50 | 1.840 | 53 | 1.864 | |||||||||
| 104= | 2.144 | 101 | 2.132 | 109 | 2.216 | 113 | 2.187 | 104 | 2.179 | 124 | 2.333 | 110 | 2.219 | 109 | 2.260 | 110 | 2.242 | 109 | 2.274 | 113 | 2.325 | |
| 106 | 2.160 | 108 | 2.199 | 105 | 2.176 | 103 | 2.122 | 91 | 2.073 | 81 | 2.051 | 83 | 2.017 | 74 | 2.040 | 83 | 2.048 | 87 | 2.058 | 93 | 2.100 | |
| 107 | 2.168 | 105 | 2.182 | 101 | 2.148 | 111 | 2.179 | 110 | 2.221 | 106 | 2.180 | 98 | 2.121 | 96 | 2.159 | 100 | 2.165 | 103 | 2.188 | 110 | ||
| 108 | 2.181 | 111 | 2.216 | 124 | 2.294 | 121 | 2.249 | 125 | 2.382 | 131 | 2.391 | 131 | 2.359 | 114 | 2.296 | |||||||
| 109 | 2.182 | 109 | 2.201 | 108 | 2.213 | 104 | 2.131 | 114 | 2.239 | 119 | 2.284 | 121 | 2.255 | 129 | 2.423 | 116 | 2.277 | 110 | 2.276 | 108 | 2.290 | |
| 110 | 2.207 | 121 | 2.307 | 118 | 2.279 | 105 | 2.133 | 140 | 2.546 | 151 | 2.732 | 134 | 2.419 | 128 | 2.417 | 118 | 2.297 | 113 | 2.320 | 109 | 2.300 | |
| 111 | 2.214 | 117 | 2.245 | 117 | 2.270 | 118 | 2.215 | 115 | 2.248 | 109 | 2.221 | 124 | 2.287 | 125 | 2.405 | 112 | 2.258 | 102 | 2.187 | 102 | 2.210 | |
| 112 | 2.243 | 116 | 2.242 | 120 | 2.288 | 124 | 2.267 | 108 | 2.207 | 101 | 2.142 | 89 | 2.061 | 80 | 2.054 | 80 | 2.034 | 83 | 2.045 | 82 | 2.030 | |
| 113 | 2.259 | 120 | 2.286 | 125 | 2.312 | 126 | 2.303 | 126 | 2.395 | 130 | 2.378 | 126 | 2.303 | 107 | 2.247 | 124 | 2.393 | 119 | 2.399 | 111 | 2.324 | |
| 114 | 2.266 | 118 | 2.263 | 122 | 2.293 | 108 | 2.152 | 126 | 2.395 | 118 | 2.282 | 99 | 2.124 | 103 | 2.225 | |||||||
| 115 | 2.269 | 107 | 2.196 | 121 | 2.292 | 102 | 2.113 | 74 | 1.979 | 63 | 1.917 | 56 | 1.881 | |||||||||
| 116= | 2.275 | 122 | 2.309 | 116 | 2.264 | 120 | 2.235 | 145 | 2.591 | 132 | 2.431 | 95 | 2.105 | |||||||||
| 116= | 2.275 | 115 | 2.239 | 111 | 2.237 | 123 | 2.263 | 116 | 2.280 | 112 | 2.240 | 111 | 2.220 | 102 | 2.215 | 103 | 2.195 | 92 | 2.080 | 93 | 2.100 | |
| 118 | 2.282 | 106 | 2.185 | 111 | 2.237 | 116 | 2.210 | 117 | 2.281 | 123 | 2.332 | 129 | 2.339 | 117 | 2.327 | 125 | 2.395 | 116 | 2.379 | 116 | 2.370 | |
| 119 | 2.283 | 119 | 2.27 | 106 | 2.202 | 106 | 2.135 | 95 | 2.093 | 103 | 2.154 | 117 | 2.242 | 108 | 2.248 | 117 | 2.295 | 90 | 2.075 | 97 | 2.160 | |
| 120 | 2.287 | 112 | 2.22 | 110 | 2.218 | 91 | 2.028 | 97 | 2.097 | 98 | 2.123 | 115 | 2.238 | 109 | 2.260 | 113 | 2.266 | |||||
| 121 | 2.300 | 114 | 2.232 | 103 | 2.154 | 94 | 2.038 | 101 | 2.137 | 100 | 2.126 | 88 | 2.058 | 82 | 2.063 | 85 | 2.056 | 104 | 2.195 | 100 | ||
| 122 | 2.302 | 104 | 2.179 | 115 | 2.256 | 130 | 2.323 | 136 | 2.473 | 140 | 2.528 | 139 | 2.525 | 133 | 2.538 | 132 | 2.580 | 122 | 2.495 | 124 | 2.540 | |
| 123 | 2.315 | 125 | 2.336 | 131 | 2.379 | 133 | 2.342 | 132 | 2.452 | 136 | 2.466 | 120 | 2.252 | 111 | 2.276 | 120 | 2.369 | 111 | 2.297 | 118 | 2.380 | |
| 124 | 2.326 | 127 | 2.352 | 127 | 2.322 | 125 | 2.294 | 148 | 2.662 | 149 | 2.696 | 140 | 2.538 | 140 | 2.722 | 135 | 2.678 | 131 | 2.700 | 134 | 2.380 | |
| 125 | 2.328 | 123 | 2.324 | 126 | 2.316 | 136 | 2.376 | 122 | 2.364 | 121 | 2.292 | 127 | 2.321 | 118 | 121 | 2.380 | 112 | 2.317 | 95 | 2.120 | ||
| 126 | 2.343 | 124 | 2.334 | 114 | 2.249 | 115 | 2.196 | 109 | 2.211 | 107 | 2.183 | 104 | 2.148 | 98 | 2.165 | 102 | 2.192 | 99 | 2.161 | 101 | 2.180 | |
| 127 | 2.355 | 128 | 2.355 | 123 | 2.295 | 122 | 2.262 | 120 | 2.350 | 122 | 2.326 | 125 | 2.301 | 130 | 2.425 | 123 | 2.389 | 117 | 2.388 | 105 | 2.250 | |
| 128 | 2.359 | 126 | 2.343 | 113 | 2.239 | 129 | 2.320 | 121 | 2.351 | 127 | 2.362 | 116 | 2.241 | 119 | 2.356 | |||||||
| 129 | 2.417 | 133 | 2.474 | 129 | 2.338 | 95 | 2.042 | 80 | 2.003 | 97 | 2.119 | 106 | 2.178 | 101 | 2.192 | 107 | 2.216 | 108 | 2.251 | 105 | 2.250 | |
| 130 | 2.437 | 131 | 2.404 | 132 | 2.398 | 107 | 2.142 | 111 | 2.225 | 95 | 2.109 | 118 | 2.247 | 123 | 2.398 | 70 | 1.956 | 57 | 1.815 | 57 | 1.800 | |
| 131 | 2.439 | 129 | 2.364 | 133 | 2.411 | 138 | 2.409 | 131 | 2.437 | 137 | 2.473 | 128 | 2.324 | 119 | 2.356 | 104 | 2.202 | 106 | 2.241 | 106 | 2.241 | |
| 132 | 2.454 | 132 | 2.426 | 134 | 2.450 | 132 | 2.325 | 123 | 2.365 | 126 | 2.350 | 132 | 2.360 | 122 | 2.379 | 119 | 2.367 | 114 | 2.342 | 108 | 2.290 | |
| 133 | 2.484 | 130 | 2.39 | 130 | 2.356 | 134 | 2.349 | 113 | 2.235 | 108 | 2.191 | 97 | 2.113 | 86 | 2.104 | 106 | 2.210 | 95 | 2.111 | 93 | 2.100 | |
| 134 | 2.488 | 141 | 2.641 | 138 | 2.500 | 130 | 2.323 | 130 | 2.418 | 144 | 2.593 | 138 | 2.524 | 132 | 2.532 | 131 | 2.577 | 123 | 2.536 | |||
| 135 | 2.498 | 135 | 2.495 | 136 | 2.464 | 140 | 2.429 | 142 | 2.558 | 138 | 2.493 | 145 | 2.671 | 141 | 2.740 | 141 | 2.964 | 135 | 2.959 | 134 | 2.970 | |
| 136 | 2.504 | 137 | 2.541 | 141 | 2.566 | 143 | 2.504 | 144 | 2.571 | 141 | 2.570 | 142 | 2.549 | 135 | 2.570 | 128 | 2.516 | 125 | 2.554 | 123 | 2.490 | |
| 137 | 2.512 | 138 | 2.555 | 139 | 2.511 | 141 | 2.462 | 134 | 2.456 | 129 | 2.374 | 133 | 2.415 | 136 | 2.574 | 130 | 2.574 | 118 | 2.397 | 116 | 2.370 | |
| 138 | 2.522 | 136 | 2.505 | 135 | 2.460 | 127 | 2.309 | 124 | 2.377 | 120 | 2.288 | 122 | 2.264 | 104 | 2.227 | |||||||
| 139 | 2.524 | 134 | 2.477 | 119 | 2.284 | 119 | 2.234 | 139 | 2.502 | 146 | 2.630 | 137 | 2.504 | 131 | 2.468 | 127 | 2.444 | 130 | 2.635 | 126 | 2.460 | |
| 140 | 2.583 | 142 | 2.646 | 140 | 2.557 | 144 | 2.530 | 138 | 2.500 | 133 | 2.434 | 135 | 2.445 | 121 | 2.362 | 107 | 2.216 | 98 | 2.158 | 89 | 2.060 | |
| 141 | 2.621 | 145 | 2.774 | 148 | 2.832 | |||||||||||||||||
| 142 | 2.632 | 139 | 2.583 | 142 | 2.574 | 137 | 2.382 | 143 | 2.571 | 113 | 2.258 | 111 | 2.220 | 73 | 2.023 | 49 | 1.784 | 68 | 1.872 | 74 | 1.950 | |
| 143 | 2.642 | 143 | 2.652 | 143 | 2.651 | 142 | 2.493 | 129 | 2.410 | 128 | 2.370 | 123 | 2.278 | 124 | 2.403 | 122 | 2.387 | 115 | 2.348 | 103 | 2.240 | |
| 144 | 2.686 | 140 | 2.596 | 137 | 2.489 | 128 | 2.310 | 135 | 2.465 | 125 | 2.346 | 102 | 2.132 | 100 | 2.188 | 109 | 2.240 | 107 | 2.250 | 108 | 2.290 | |
| 145 | 2.729 | 146= | 2.777 | 147 | 2.764 | 146 | 2.720 | 150 | 2.701 | 147 | 2.634 | 144 | 2.625 | 139 | 2.700 | 138 | 2.787 | 129 | 2.625 | 125 | 2.610 | |
| 146 | 2.764 | 144 | 2.707 | 144 | 2.656 | 148 | 2.781 | 149 | 2.689 | 150 | 2.730 | 150 | 2.842 | 145 | 2.901 | 149 | 3.019 | 137 | 3.012 | 134 | 2.970 | |
| 147 | 2.778 | 148 | 2.782 | 146 | 2.752 | 145 | 2.623 | 146 | 2.620 | 142 | 2.575 | 136 | 2.459 | 137 | 2.597 | 134 | 2.639 | 128 | 2.606 | 127 | 2.670 | |
| 148 | 2.873 | 149 | 2.849 | 149 | 2.877 | 151 | 2.910 | 151 | 2.710 | 148 | 2.693 | 146 | 2.801 | 142 | 2.743 | 137 | 2.756 | 127 | 2.599 | 118 | 2.570 | |
| 149 | 2.898 | 146= | 2.777 | 145 | 2.710 | 135 | 2.363 | 128 | 2.402 | 134 | 2.437 | 130 | 2.344 | 127 | 2.411 | 126 | 2.420 | 124 | 2.538 | 119 | 2.430 | |
| 150 | 2.950 | 150 | 2.967 | 150 | 2.944 | 153 | 2.977 | 153 | 3.071 | 154 | 3.044 | 152 | 2.932 | 149 | 3.092 | 139 | 2.855 | 133 | 2.771 | 129 | 2.750 | |
| 151 | 3.079 | 152 | 3.058 | 153 | 3.145 | 154 | 3.049 | 154 | 3.107 | 157 | 3.106 | 149 | 2.833 | 146 | 2.905 | 145 | 3.050 | 140 | 3.087 | 132 | 2.890 | |
| 152 | 3.113 | 154 | 3.184 | 156 | 3.287 | 150 | 2.845 | 141 | 2.546 | 111 | 2.238 | 71 | 1.953 | 69 | 1.995 | 97 | 2.115 | 100 | 2.166 | 80 | 2.020 | |
| 153 | 3.155 | 155= | 3.213 | 155 | 3.269 | 156 | 3.295 | 157 | 3.362 | 158 | 3.242 | 156 | 3.193 | 151 | 3.223 | 146 | 3.125 | 139 | 3.086 | 136 | 3.150 | |
| 154 | 3.160 | 151 | 3.047 | 151 | 3.079 | 152 | 2.954 | 152 | 3.039 | 155 | 3.060 | 153 | 2.938 | 147 | 2.966 | 143 | 3.013 | 138 | 3.064 | 131 | 2.870 | |
| 155 | 3.236 | 155= | 3.213 | 157 | 3.354 | 158 | 3.332 | 156 | 3.331 | 153 | 3.031 | 151 | 2.872 | 144 | 2.869 | 136 | 2.753 | 132 | 2.706 | 130 | 2.810 | |
| 156 | 3.251 | 153 | 3.061 | 152 | 3.112 | 155 | 3.085 | 155 | 3.213 | 156 | 3.085 | 154 | 3.073 | 148 | 3.016 | 140 | 2.925 | 136 | 2.988 | 128 | 2.690 | |
| 157 | 3.262 | 157 | 3.328 | 154 | 3.200 | 149 | 2.819 | 133 | 2.453 | 145 | 2.604 | 147 | 2.830 | 143 | 2.816 | 56 | 1.839 | 54 | 1.790 | 65 | 1.870 | |
| 158 | 3.305 | 159 | 3.412 | 158 | 3.399 | 147 | 2.751 | 147 | 2.629 | 152 | 2.747 | 143 | 2.601 | 138 | 2.670 | 129 | 2.573 | 121 | 2.416 | 111 | 2.324 | |
| 159 | 3.367 | 158 | 3.387 | 159 | 3.414 | 157 | 3.307 | 158 | 3.368 | 161 | 3.394 | 158 | 3.392 | 153 | 3.379 | 148 | 3.390 | 141 | 3.269 | 137 | 3.320 | |
| 160 | 3.425 | 161 | 3.556 | 161 | 3.570 | 161 | 3.444 | 159 | 3.377 | 159 | 3.245 | 155 | 3.192 | 152 | 3.296 | 149 | 3.406 | 143 | 3.370 | 138 | 3.370 | |
| 161 | 3.508 | 160 | 3.524 | 162 | 3.593 | 159 | 3.383 | 160 | 3.397 | 143 | 2.576 | |||||||||||
| 162 | 3.585 | 162 | 3.567 | 160 | 3.538 | 160 | 3.427 | 161 | 3.416 | 162 | 3.440 | 157 | 3.252 | 150 | 3.212 | 147 | 3.252 | 142 | 3.358 | 135 | 3.000 | |
| 163 | 3.600 | 163 | 3.814 | 163 | 3.806 | 162 | 3.645 | 162 | 3.650 | 160 | 3.393 | 147 | 2.830 | 116 | 2.322 | 115 | 2.274 | 96 | 2.112 | 77 | 1.990 |
Note: The GPI's methodology is updated regularly and is improved to reflect the most up-to-date datasets. Each year's GPI report includes a detailed description of the methodology used.
See also
References
- 1 2 3 4 5 6 Institute for Economics and Peace. "Global Peace Index 2017" (PDF). visionofhumanity.org.
- 1 2 Wang, Monica. "The World's Most And Least Peaceful Countries In 2016". Forbes. Retrieved 2017-11-26.
- ↑ Institute for Economics and Peace. "Global Peace Index Map". Vision of Humanity. Retrieved 2017-11-27.
- ↑ Information about indicators and methodology "2013 Global Peace Index"(PDF). Institute for Economics and Peace. Archived from the original (PDF) on 2013-12-10. Retrieved 2013-06-24.
- ↑ In this case, a conflict is defined as, "a contested incompatibility that concerns government and/or territory where the use of armed force between two parties, of which at least one is the government of a state, results in at least 25 battle-related deaths in a year."
- ↑ Excludes militia and national guard forces.
- ↑ This includes, "cash outlays of central or federal government to meet the costs of national armed forces—including strategic, land, naval, air, command, administration and support forces as well as paramilitary forces, customs forces and border guards if these are trained and equipped as a military force."
- ↑ This includes transfers, purchases, or gifts of aircraft, armoured vehicles, artillery, radar systems, missiles, ships, engines
- ↑ Rates the destructive capability of a country's stock of heavy weapons via a categorised system. As of 2013, countries with nuclear capabilities receive a score of five, the highest possible score.
- ↑ Institute for Economics and Peace. "Global Peace Index Report, Methodology, pg. 113-136" (PDF). Visionofhumanity.org.
- ↑ "Endorsers for GPI" (PDF). Vision of Humanity. Retrieved 2013-08-16.
- ↑ "Norway rated most peaceful nation". 2007-05-30. Retrieved 2017-11-27.
- ↑ "Global Peace Index: World Less Peaceful in 2010 Report, Violence Impacting Global Economy $7 Trillion Annually". Phil's Stock World. Retrieved 2017-11-27.
- 1 2 Sputnik. "Terrorism, Conflicts Cost Over $14 Trillion to Global Economy". sputniknews.com. Retrieved 2017-11-27.
- ↑ "King's College London - 2015 Global Peace Index: an increasingly divided world". www.kcl.ac.uk. Retrieved 2017-11-27.
- ↑ "Give peace a rating". The Economist. 2007-05-31. ISSN 0013-0613. Retrieved 2017-11-27.
- ↑ "Give peace a score". The Economist. Retrieved 2017-11-27.
- ↑ "Giving peace a chance? 2017 Global Peace Index". ANU. 2017-06-09. Retrieved 2017-11-27.
- ↑ "Dark underbelly of the world's most 'peaceful' countries". Christian Science Monitor. 2007-07-26. ISSN 0882-7729. Retrieved 2017-11-27.
- ↑ "UAE drops in rank in annual peace index amid increasing regional violence". The National. Retrieved 2017-11-27.
- ↑ Honduras, Republic of. "Honduras Peace Forum Marks National Progress in Crime Prevention". www.prnewswire.com. Retrieved 2017-11-27.
- ↑ "2017 Global Peace Index and World Happiness Report shows Opposition leaders were wrong". NST Online. 2017-07-05. Retrieved 2017-11-27.
- ↑ "2016 Global Peace Index released-Botswana moves up 3 places; still ranked among the world's most peaceful nations – Embassy of the Republic of Botswana". botswana-brussels.com. Retrieved 2017-11-27.
- ↑ "Global Peace Index: Nine trillion reasons to pursue peace | UN DESA | United Nations Department of Economic and Social Affairs". www.un.org. Retrieved 2017-11-27.
- ↑ Romero, A. "Palace Disputes Peace Index Report". www.pressreader.com. Retrieved 2017-11-27.
- ↑ "JPJ Sandy Praises Global Peace Index Report". Sierra Leone Concord Times. Retrieved 2017-11-27.
- ↑ "Last year there were 10 countries in the world entirely free from war. This year it's just four. This is the troubling reason why". The Independent. 2017-06-01. Retrieved 2017-11-27.
- ↑ "World now 0.28% more peaceful - research". BBC News. 2017-06-01. Retrieved 2017-11-27.
- ↑ McCarthy, Niall. "The World's Most and Least Peaceful Countries [Infographic]". Forbes. Retrieved 2017-11-27.
- ↑ McVeigh, Karen (2017-06-01). "Fraught White House campaign blamed as US bucks global trend towards peace". The Guardian. ISSN 0261-3077. Retrieved 2017-11-27.
- ↑ "US Became Less Peaceful After Donald Trump's Election, Influential Study Finds". HuffPost UK. 2017-06-01. Retrieved 2017-11-27.
- ↑ "U.S. ranked the 114th most peaceful nation on earth says annual global ranking". The Washington Times. Retrieved 2017-11-27.
- ↑ "The 12 safest countries in the world". Business Insider. Retrieved 2017-11-27.
- ↑ "India ranks 137th in Global Peace Index 2017, Bhutan most peaceful in South Asia". Zee News. 2017-06-17. Retrieved 2017-11-27.
- ↑ "India ranked 141 in global peace index, Syria least peaceful". hindustantimes.com. 2016-06-08. Retrieved 2017-11-27.
- ↑ Rapaka, K. "IEP released the 2016 Global Peace Index, India ranks 141". Jagranjosh.com. Retrieved 2017-11-27.
- ↑ Sicat, Gerardo P. "The Global Peace Index". philstar.com. Retrieved 2017-11-27.
- ↑ Edmond, C. "These are the most peaceful countries in the world". World Economic Forum. Retrieved 2017-11-27.
- ↑ Wolfsfeld, Gadi; Segev, Elad; Sheafer, Tamir (2013-01-16). "Social Media and the Arab Spring". The International Journal of Press/Politics. 18 (2): 115–137. doi:10.1177/1940161212471716.
- ↑ Achumba, I.; Ighomereho, O.S.; Akpor-Robaro, M.O. "Security Challenges in Nigeria and the Implications for Business Activities and Sustainable Development". Journal of Economics and Sustainable Development. 4.
- ↑ Newman, E. (2009). "Failed States and International Order: Constructing a Post-Westphalian World". Contemporary Security Policy. 30: 421–443. doi:10.1080/13523260903326479.
- ↑ Letendre, Kenneth; Fincher, Corey L.; Thornhill, Randy (2010-08-01). "Does infectious disease cause global variation in the frequency of intrastate armed conflict and civil war?". Biological Reviews. 85 (3): 669–683. doi:10.1111/j.1469-185X.2010.00133.x. ISSN 1469-185X.
- ↑ Skaaning, Svend-Erik (2009-09-22). "Measuring the Rule of Law". Political Research Quarterly. 63 (2): 449–460. doi:10.1177/1065912909346745.
- ↑ Jun, Eunju; Kim, Wonjoon; Chang, Soon Heung. "The analysis of security cost for different energy sources". Applied Energy. 86 (10): 1894–1901. doi:10.1016/j.apenergy.2008.11.028.
- ↑ Alexander, Amy C.; Inglehart, Ronald; Welzel, Christian (2011-11-30). "Measuring effective democracy: A defense". International Political Science Review. 33 (1): 41–62. doi:10.1177/0192512111414682.
- ↑ Cilliers, J.; Hughes, B.; Moyer, J. (2011). "African Futures 2050- The Next Forty Years" (PDF). Institute for Security Studies.
- ↑ UNFPA - United Nations Population Fund (2016). ""Best friends" save women's lives in war-weary Central African Republic". www.unfpa.org. Retrieved 2017-11-27.
- ↑ Meyer, Carsten; Kreft, Holger; Guralnick, Robert; Jetz, Walter (2015-09-08). "Global priorities for an effective information basis of biodiversity distributions". Nature Communications. 6: 8221. doi:10.1038/ncomms9221.
- ↑ Zuckerman, P. (2009). "Why Are Danes and Swedes So Irreligious?" (PDF). Nordic Journal of Religion and Society. 22: 55–69.
- ↑ Cordell, Dana; White, Stuart (2015-04-01). "Tracking phosphorus security: indicators of phosphorus vulnerability in the global food system". Food Security. 7 (2): 337–350. doi:10.1007/s12571-015-0442-0. ISSN 1876-4517.
- ↑ Drezner, Daniel W. (January 2014). "The System Worked: Global Economic Governance during the Great Recession". World Politics. 66 (1): 123–164. doi:10.1017/S0043887113000348. ISSN 0043-8871.
- ↑ Olukayide Ewetan, O.; Urhie, E. (2014). "Insecurity and Socio-Economic Development in Nigeria" (PDF). Journal of Sustainable Development in Nigeria. 5: 40–63.
- ↑ Harris, Ian M. (2007). "Peace Education in a Violent Culture". Harvard Educational Review. 77 (3).
- ↑ Hudson, V.M.; et al. (2009). "The Heart of the Matter: The Security of Women and the Security of States". International Security. 33 (3): 7–45. doi:10.1162/isec.2009.33.3.7.
- ↑ Burns, J.K. (2011). "The Mental Health Gap in South Africa- A Human Rights Issue" (PDF). The Equal Rights Review. 6: 99–113.
- ↑ Walsh, Philip R. (2011-08-01). "Creating a "values" chain for sustainable development in developing nations: where Maslow meets Porter". Environment, Development and Sustainability. 13 (4): 789. doi:10.1007/s10668-011-9291-y. ISSN 1387-585X.
- ↑ "Global Peace Index 2018" (PDF). visionofhumanity.org. Institute for Economics and Peace.
- ↑ Institute for Economics and Peace (2016). "Global Peace Index 2016" (PDF). Visionofhumanity.org.
- ↑ Institute for Economics and Peace (2015). "Global Peace Index 2015" (PDF). Visionofhumanity.org.
- ↑ Institute for Economics and Peace (2014). "Global Peace Index 2014" (PDF). Visionofhumanity.org.
- ↑ Institute for Economics and Peace (2013). "Global Peace Index 2013" (PDF). Visionofhumanity.org.
- ↑ Institute for Economics and Peace (2012). "Global Peace Index 2012" (PDF). Visionofhumanity.org.
- ↑ "Global peace index 2012: the full list". the Guardian. 2012-06-12. Retrieved 2017-11-27.
- ↑ Institute for Economics and Peace (2011). "Global Peace Index 2011" (PDF). visionofhumanity.org.
- ↑ Institute for Economics and Peace (2010). "Global Peace Index 2010" (PDF). visionofhumanity.org. Archived from the original (PDF) on 2017-03-26.
External links
- Vision of Humanity - Global Peace Index Site
- Interactive world map of the Global Peace Index
- Institute for Economics and Peace
- Safest Countries in the World
- Integrated Research Steve Killelea is the founder of technology company Integrated Research
- Uppsala Conflict Data Program, an organized violence database
- Global Peace Index 2013: The Full List
- List of safest countries by Global Peace Index