European emigration
| Total population | |
|---|---|
|
530,000,000 + 6.5% of the total world population (world population of 7.4 billion).[1] (not counting partial European descent) | |
| Regions with significant populations | |
| 250,553,265[2] | |
| 102,051,646[3] | |
| 16,000,000 - 56,000,000[4][5] | |
| 40,900,000[6] | |
| 27,386,890[7] | |
| 22,982,665 | |
| 19,500,350[8][9] | |
| 13,094,085[10][11][12] | |
| 11-13,000,000[13][14] | |
| 10,160,399[15] | |
| 7,472,100[16] | |
| 3,900,000[4] | |
| 3,151,095[17] | |
| 3,064,862[18] | |
| 2,969,391[19] | |
| 2,490,000[20] | |
| 2,000,000+[12] | |
| 6,8,000-9,000,000[12][21] | |
| 2,000,000+[12] | |
| 1,400,000+[22] | |
| 1,300,000+[4] | |
| 1,000,000+[12] | |
| Languages | |
| Languages of Europe (mostly English, Spanish, minoritily Portuguese and French) | |
| Religion | |
|
(mostly Catholic and Protestant, some Orthodox) Irreligion · Other Religions | |
| Related ethnic groups | |
| Europeans | |
European emigration can be defined as subsequent emigration waves from the European continent to other continents. The origins of the various European diasporas[23] can be traced to the people, who left the European nation states or stateless ethnic communities on the European continent.[24]
From 1815 to 1932, 60 million people left Europe (with many returning home), primarily to "areas of European settlement" in the Americas (especially to the United States, Canada, Brazil, the Southern Cone such as Argentina, and Uruguay[24]), Australia,[25] New Zealand and Siberia.[26] These populations also multiplied rapidly in their new habitat; much more so than the populations of Africa and Asia. As a result, on the eve of World War I, 38% of the world's total population was of European ancestry.[26]
More contemporary, European emigration can also refer to emigration from one European country to another, especially in the context of the internal mobility in the European Union (intra-EU mobility) or mobility within the Eurasian Union.
History
Scale of Emigration 1500-1800
The European continent has been a central part of a complex migration system, which included swaths of North Africa, the Middle East and Asia Minor well before the Modern Era. Yet, only the population growth of the late Middle Ages allowed for larger population movements, inside and outside of the continent.[27] The discovery of the Americas in 1492 stimulated a steady stream of voluntary migration from Europe. About 200,000 Spaniards settled in their American colonies prior to 1600, a small settlement compared to the 3 to 4 million Amerindians who lived in Spanish territory in the Americas.
Roughly one and a half million Europeans settled in the New World between 1500 and 1800 (see table). While the absolute number of European emigrants during the early modern period was very small compared to later waves of migration in the nineteenth and twentieth centuries, the relative size of these early modern migrations was nevertheless substantial.
During the 1500s, Spain and Portugal sent a steady flow of government and church officials, members of the lesser nobility, people from the working classes and their families averaging roughly three-thousand people per year from a population of around eight million. A total of around 437,000 left Spain in the 150-year period from 1500 to 1650 to Central, South America and the Caribbean Islands. Between 1500 and 1700 only 100,000 Portuguese crossed the Atlantic to settle in Brazil. However, with the discovery of numerous highly productive gold mines in the Minas Gerais region, the Portuguese emigration to Brazil increased by five fold. From 1700 til 1760, over half a million Portuguese immigrants entered Brazil. In the 18th century, thanks to the gold rush, the capital of the province of Minas Gerais, the town of Villa Rica (today, Ouro Preto) became for a time one of the most populous cities in the New World. This massive influx of Portuguese immigration and influence created a city which remains to this day, one of the best examples of 18th century European architecture in the Americas.[24]
Between one-half and two-thirds of European immigrants to the Thirteen Colonies between the 1630s and the American Revolution came under indentures.[28] The practice was sufficiently common that the Habeas Corpus Act 1679, in part, prevented imprisonments overseas; it also made provisions for those with existing transportation contracts and those "praying to be transported" in lieu of remaining in prison upon conviction.[29] In any case, while half the European immigrants to the Thirteen Colonies had been indentured servants, at any one time they were outnumbered by workers who had never been indentured, or whose indenture had expired. Free wage labour was more common for Europeans in the colonies.[30] Indentured persons were numerically important mostly in the region from Virginia north to New Jersey. Other colonies saw far fewer of them. The total number of European immigrants to all 13 colonies before 1775 was about 500,000-550,000; of these 55,000 were involuntary prisoners. Of the 450,000 or so European arrivals who came voluntarily, Tomlins estimates that 48% were indentured.[31] About 75% were under the age of 25. The age of legal adulthood for men was 24 years; those over 24 generally came on contracts lasting about 3 years.[32] Regarding the children who came, Gary Nash reports that, "many of the servants were actually nephews, nieces, cousins and children of friends of emigrating Englishmen, who paid their passage in return for their labour once in America."[33]
| Number of European Emigrants 1500 - 1783 | |||
| Country of Origin | Number | Dates | |
|---|---|---|---|
| Spain | 437,000 | 1500-1650 | |
| Portugal | 100,000 | 1500-1700 | |
| Great Britain | 400,000 | 1607-1700 | |
| Great Britain (Totals) | 322,000 | 1700-1780 | |
| Scotland, Ireland | 190,000-250,000 | ||
| France | 51,000 | 1608-1760 | |
| Germany (Southwestern, Totals) | 100,000 | 1683-1783 | |
| Switzerland, Alsace Lorraine | |||
| Totals | 1,410,000 | 1500-1783 | |
|
Source: "To Make America"[24] | |||
However, the development of the mining economy in the 18th century raised wages and employment opportunities in the Portuguese colony and emigration increased: in the 18th century alone, about 600,000 Portuguese settled in Brazil, a mass emigration given that Portugal had a population of only 2 million people. In North America, immigration was dominated by British, Irish, French and other Northern Europeans.[34] From 1650 to 1800, almost 800,000 Spaniards emigrated to the New World, especially under the Bourbon Dynasty in the 18th century. Emigration to New France laid the origins of modern Canada, with important early immigration of colonists from Northern France.[35]
Post-independence emigration
Mass European emigration to the Americas and Australia took place in the 19th and 20th centuries. This was the effect of a dramatic demographic transition in 19th-century-Europe, subsequent wars and political changes on the continent. From the end of the Napoleonic Wars until 1920, some 60 million Europeans emigrated. Of these, 71% went to North America, 21% to Latin America (mainly Argentina and Brazil) and 7% to Australia. About 11 million of these people went to Latin America, of whom 38% were Italians, 28% were Spaniards and 11% were Portuguese.[36]
Between 1821 and 1890, 9.55 million Europeans settled in the United States, mainly Germans, Irish, English, Scandinavians, Italians and Scots. 18 million more arrived from 1890 to 1914, including 2.5 million from Canada. Despite the large number of immigrants arriving, people born outside of the United States formed a relatively small number of the U.S. population: in 1910, foreigners accounted for 14.7 percent of the country's population or 13.5 million people. The huge number of immigrants to Argentina, which had a much smaller population, had a much greater impact on the country's ethnic composition. By 1914, 30% of Argentina's population was foreign-born, with 12% of its population born in Italy, the largest immigrant group. Next was Canada: by 1881, 14% of Canada's population was foreign-born, and the proportion increased to 22% in 1921. In Brazil, the proportion of immigrants in the national population was much smaller, and immigrants tended to be concentrated in the central and Southern parts of the country. The proportion of foreigners in Brazil peaked in 1920, at just 7 percent or 2 million people, mostly Italians, Portuguese, Germans and Spaniards; however, the influx of 4 million European immigrants between 1880 and 1920 significantly altered the racial composition of the country.[34] From 1901 to 1920, immigration was responsible for only 7 percent of Brazilian population growth, but in the years of high immigration, from 1891 to 1900, the share was as high as 30 percent (higher than Argentina's 26 percent in the 1880s).[37]
The countries in the Americas that received a major wave of European immigrants from the mid-1800s to the mid-1900s were: the United States (32.6 million), Argentina (6.5 million), Canada (5.1 million), Brazil (5.0 million), Cuba (1.4 million), Uruguay (713,000).[38] Other countries that received a more modest immigration flow (accounting for less than 10 percent of total European emigration to Latin America) were: Mexico (270,000), Colombia (126,000), Chile (90,000), Puerto Rico (62,000), Peru (30,000), and Paraguay (21,000).[38][37]
Immigration arrivals in the 19th and the 20th centuries
| European Emigrants 1800–1960 | |||
|---|---|---|---|
| Destination | Percentage | ||
| United States | 70.0% | ||
| Latin America | 12.0% | ||
| Russian Siberia | 9.0% | ||
| Canada, Australia, New Zealand, South Africa | 9.0% | ||
| Total | 100.0% | ||
|
Source: "World Civilizations: Volume II: Since 1500"[39] | |||
| Destination | Years | Arrivals | Ref(s) |
|---|---|---|---|
| United States | 1821–1932 | 32,244,000 | [40] |
| Argentina | 1856–1932 | 6,405,000 | [40] |
| Brazil | 1872–1972 | 5,350,000 | [40] |
| Canada | 1831–1932 | 5,206,000 | [40] |
| Australia | 1821–1932 | 2,913,000 | [40] |
| Cuba | 1901–1931 | 857,000 | [40] |
| South Africa | 1881–1932 | 852,000 | [40] |
| Uruguay | 1836–1932 | 713,000 | [40] |
| New Zealand | 1821–1932 | 594,000 | [40] |
| Mexico | 1911–1931 | 226,000 | [40] |
By region
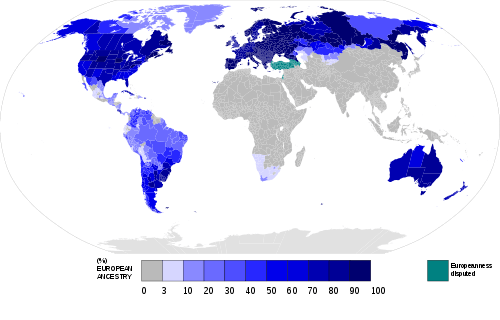
Nations and regions outside of Europe with significant populations of European ancestry:[41] It is important to note, however, that these statistics rely on identification with a European ethnic group in censuses, and as such are subjective (especially in the case of mixed origins).
Africa
(South Africans of European descent): 4,586,838 (8.9% of South Africa's population) [42] (Spaniards who settled the Canary Islands, Canary Islanders).
Asia
The Middle East Small communities of European, white American and white Australian expatriates in the Persian Gulf countries like Bahrain, Kuwait, Qatar and the UAE; and in Aramco compounds in Saudi Arabia. Historically before 1970, small ethnic European (esp. Greek and Italian) enclaves were found in Egypt (Greeks in Egypt, Italian Egyptians) and Syria (Greeks in Syria).
Americas
Total European population in the Americas—approximately 446,394,000
Europeans in Northern America
Total European population—approximately 249,300,000
European Canadian – Canada 2011 Census reported 61% of the population, or 20,000,000 people, mostly divided into Anglophone (18 million) and Francophone (10 million).[44]
European American – 72.4% of the population, or 223,800,000
Europeans in South America and the Caribbean
Middle America (including Central America and the Caribbean) and South America (see Latin Americans of European descent)
Total European population—approximate estimate of ~200,000,000
Argentina: 79% of the population or 38,900,000, may include an unknown percentage of mestizos and mulattos.[45] Other sources[46] put 86.4% of the population. Falkland Islanders mainly European of British descent—total population 3,140.
Oceania
Oceania - Total population of Europeans in Oceania is approximately 23,185,000 or approximately 22,818,000 excluding Hawaii. (European Australians and New Zealanders)
Populations of European descent
- Albanian diaspora
- Armenian diaspora
- Azerbaijani diaspora
- Basque diaspora
- Bosnian diaspora
- British diaspora
- Bulgarian diaspora
- Circassian diaspora
- Croatian diaspora
- Czech diaspora
- Dutch diaspora
- French diaspora
- German diaspora
- Georgian diaspora
- Greek diaspora
- Hungarian diaspora
- Icelandic diaspora
- Irish diaspora
- Italian diaspora
- Kosovan diaspora
- Lithuanian diaspora
- Macedonian diaspora
- Maltese diaspora
- Norwegian diaspora
- Polish diaspora
- Portuguese diaspora
- Romanian diaspora
- Russian diaspora
- Serbian diaspora
- Spanish diaspora
- Swedish diaspora
- Swiss diaspora
- Swiss diaspora
- Turkish diaspora
- Ukrainian diaspora
- Ruthenians or Rusyns
See also
References
- ↑ Current World Population 2016 worldometers
- ↑ "Overview of Race and Hispanic Origin: 2010 Census Briefs". US Census Bureau. March 2011. Archived from the original (PDF) on 5 May 2011.
- ↑ "Tabelas de resultados Branca Preta Amarela Parda Indígena Sem declaração" (PDF). 8 November 2011. Retrieved 2014-07-11.
- 1 2 3 Lizcano Fernández, Francisco (2005). "Composición Étnica de las Tres Áreas Culturales del Continente Americano al Comienzo del Siglo XXI" [Ethnic Composition of the Three Cultural Areas of the American Continent at the Beginning of the 21st Century] (PDF) (in Spanish). UAEM. p. 218. Archived from the original (PDF) on 20 September 2008.
- ↑ "Mexico: People; Ethnic groups". CIA World Factbook. Retrieved 26 November 2007.
- ↑ "South America : Argentina : People and society". The World Factbook. CIA. Retrieved 23 July 2015.
- ↑ "National Household Survey (NHS) Profile, 2011". Retrieved 17 June 2015.
- ↑ Bushnell, David (2010). Rex A. Hudson, ed. Colombia: A Country Study (PDF). U.S. Government Printing Office. p. 87. ISBN 978-0-8444-9502-6. Archived from the original (PDF) on 5 June 2011.
- ↑ Schwartzman, Simon (27 January 2008). "Étnia, condiciones de vida y discriminación" [Ethnicity, living conditions and discrimination] (PDF). schwartzman.org (in Spanish). Retrieved 27 February 2017.
- ↑ "Resultado Basico del XIV Censo Nacional de Población y Vivienda 2011" [Basic Results of the XIV National Population and Housing Census 2011] (PDF) (in Spanish). Caracas: National Institute of Statistics of the Bolivarian Republic of Venezuela. 9 August 2012. p. 14. Retrieved 1 March 2017.
- ↑ "Demográficos: Censos de Población y Vivienda: Población Proyectada al 2016 - Base Censo 2011" [Demographics: Population and Housing Censuses: Population Projected to 2016 - Census Base 2011] (in Spanish). National Institute of Statistics. Retrieved 1 March 2017: adaption of the 42.2% white people from the census with current estimates
- 1 2 3 4 5 "Ethnic groups". The World Factbook. Central Intelligence Agency (CIA). Retrieved 14 September 2013.
- ↑ "Chile". Encyclopædia Britannica. Retrieved 15 September 2012.
Chile's ethnic makeup is largely a product of Spanish colonization. About three-fourths of Chileans are mestizo, a mixture of European and Amerindian ancestries. One fifth of Chileans are of white European (mainly Spanish) descent.
- ↑ Medina Lois, Ernesto; Ana María Kaempffer R. "Elementos de Salud Pública: 5.2.6. Estructura racial" [Elements of Public Health: 5.2.6. Racial structure] (in Spanish). Universidad de Chile. Archived from the original on 16 September 2009. Retrieved 26 October 2009.
- ↑ "Tabla II.4 Población por sexo y zona de residencia según grupos de edades y color de la piel" [Table II.4 Population by sex and area of residence according to age groups and skin colour] (PDF). National Office of Statistics and Information, Republic of Cuba (in Spanish). 2013. Archived from the original (PDF) on 3 June 2014.
- ↑ "South Africa: Statistical release P0302: Mid-year population estimates 2009: Embargoed until: 27 July 2009" (PDF). Statistics South Africa. 2009. Retrieved 19 December 2015.
- ↑ Cabella, Wanda; Mathías Nathan; Mariana Tenenbaum (December 2013). Juan José Calvo, ed. "Atlas sociodemográfico y de la desigualdad del Uruguay, Fascículo 2: La población afro-uruguaya en el Censo 2011: Ancestry" [Atlas of socio-demographics and inequality in Uruguay, Part 2: The Afro-Uruguayan population in the 2011 Census] (PDF) (in Spanish). Uruguay National Institute of Statistics. ISBN 978-9974-32-625-5. Archived from the original (PDF) on 9 February 2014.
- ↑ 2010 Census Data. "2010 Census Data". 2010.census.gov. Archived from the original on 2011-01-02. Retrieved 2011-10-30.
- ↑ "Cultural diversity". 2013 Census QuickStats about national highlights. Statistics New Zealand. 3 December 2013. Retrieved 18 August 2017.
- ↑ INE- Caracterización estadística República de Guatemala 2012 Retrieved, 2015/04/17.
- ↑ . princeton.edu. pp. 4-5.
- ↑ Instituto Nacional de Estadística y Censo del Ecuador INEC.
- ↑ The use of the term "diaspora" in reference to people of European national or ethnic origins is contested and debated- Diaspora and transnationalism : concepts, theories and methods. Bauböck, Rainer., Faist, Thomas, 1959-. Amsterdam: Amsterdam University Press. 2010. ISBN 9789089642387. OCLC 657637171.
- 1 2 3 4 "To Make America": European Emigration in the Early Modern Period edited by Ida Altman, James P. P. Horn (Page: 3 onwards)
- ↑ De Lazzari, Chiara; Bruno Mascitelli (2016). "Migrant "Assimilation" in Australia: The Adult Migrant English Program from 1947 to 1971". In Bruno Mascitelli; Sonia Mycak; Gerardo Papalia. The European Diaspora in Australia: An Interdisciplinary Perspective. Cambridge Scholars Publishing. p. 203. ISBN 978-1-4438-9419-7. Retrieved 28 February 2017.
- 1 2 "European Migration and Imperialism". historydoctor.net. Archived from the original on 22 November 2010. Retrieved 14 September 2013.
The population of Europe entered its third and decisive stage in the early eighteenth century. Birthrates declined, but death rates also declined as the standard of living and advances in medical science provided for longer life spans. The population of Europe including Russia more than doubled from 188 million in 1800 to 432 million in 1900. From 1815 through 1932, sixty million people left Europe, primarily to "areas of European settlement," in North and South America, Australia, New Zealand and Siberia. These populations also multiplied rapidly in their new habitat; much more so than the populations of Africa and Asia. As a result, on the eve of World War I (1914), 38 percent of the world's total population was of European ancestry. This growth in population provided further impetus for European expansion, and became the driving force behind emigration. Rising populations put pressure on land, and land hunger and led to "land hunger." Millions of people went abroad in search of work or economic opportunity. The Irish, who left for America during the great Potato famine, were an extreme but not unique example. Ultimately, one third of all European migrants came from the British Isles between 1840 and 1920. Italians also migrated in large numbers because of poor economic conditions in their home country. German migration also was steady until industrial conditions in Germany improved when the wave of migration slowed. Less than one half of all migrants went to the United States, although it absorbed the largest number of European migrants. Others went to Asiatic Russia, Canada, Argentina, Brazil, Australia and New Zealand.
- ↑ Liberal states and the freedom of movement : selective borders, unequal mobility. Mau, Steffen, 1968-. Houndmills, Basingstoke, Hampshire: Palgrave Macmillan. 2012. ISBN 9780230277847. OCLC 768167292.
- ↑ Galenson 1984: 1
- ↑ Charles II, 1679: An Act for the better secureing the Liberty of the Subject and for Prevention of Imprisonments beyond the Seas., Statutes of the Realm: Volume 5, 1628–80, pp 935–938. Great Britain Record Commission, (1819)
- ↑ John Donoghue, "Indentured Servitude in the 17th Century English Atlantic: A Brief Survey of the Literature," History Compass (2013) 11#10 pp 893–902.
- ↑ Christopher Tomlins, "Reconsidering Indentured Servitude: European Migration and the Early American Labor Force, 1600–1775," Labor History (2001) 42#1 pp 5–43, at p.
- ↑ Tomlins (2001) at notes 31, 42, 66
- ↑ Gary Nash, The Urban Crucible: The Northern Seaports and the Origins of the American Revolution (1979) p 15
- 1 2 Boris Fautos – Fazer a América: a imigração em massa para a América Latina."
- ↑ 1944-, Francis, R. D. (R. Douglas), (1988). Origins : Canadian history to Confederation. Jones, Richard, 1943-, Smith, Donald B. Toronto: Holt, Rinehart and Winston of Canada. ISBN 0039217051. OCLC 16577780.
- ↑ Marília D. Klaumann Cánovas (2004). "A GRANDE IMIGRAÇÃO EUROPÉIA PARA O BRASIL E O IMIGRANTE ESPANHOL NO CENÁRIO DA CAFEICULTURA PAULISTA: ASPECTOS DE UMA (IN)VISIBILIDADE" [The great European immigration to Brazil and immigrants within the Spanish scenario of the Paulista coffee plantations: one of the issues (in) visibility] (PDF) (in Portuguese). cchla.ufpb.br. Archived from the original (PDF) on 3 October 2009.
- 1 2 Blanca Sánchez-Alonso (2005). "European Immigration into Latin America, 1870-1930" (PDF). docentes.fe.unl.pt. Archived from the original (PDF) on 22 October 2008.
- 1 2 Baily, Samuel L.; Míguez, Eduardo José, eds. (2003). Mass Migration to Modern Latin America. Wilmington, Delaware: Rowman & Littlefield. p. 14. ISBN 978-0-8420-2831-8. Retrieved 27 February 2017.
- ↑ World Civilizations: Volume II: Since 1500 By Philip J. Adler, Randall L. Pouwels
- 1 2 3 4 5 6 7 8 9 10 Samuel L. Baily; Eduardo José Míguez (2003). Mass Migration to Modern Latin America. Rowman & Littlefield. p. xiv. ISBN 978-0-8420-2831-8. Retrieved 20 December 2015.
- ↑ Ethnic groups by country. Statistics (where available) from CIA Factbook.
- ↑ "Census 2011 Census in brief, Report No. 03-01-41" (PDF). Statistics South Africa. 2012. Retrieved 21 January 2016.
- ↑ Hill, Fiona (23 February 2004). "Russia — Coming In From the Cold?". The Globalist. Archived from the original on 15 July 2011.
- ↑ "Population Groups (28) and Sex (3) for the Population of Canada, Provinces, Territories, Census Metropolitan Areas and Census Agglomerations, 2006 Census - 20% Sample Data". Statistics Canada. Archived from the original on 4 December 2008. Retrieved 17 June 2015.
- ↑ Argentina: People: Ethnic Groups. World Factbook of CIA
- ↑ Ben Cahoon. "Argentina". worldstatesmen.org. Retrieved 23 July 2015.
| Central Europe | |
|---|---|
| Eastern Europe | |
| Northern Europe | |
| Southeast Europe | |
| Southern Europe | |
| Western Europe | |
1 Russia is a transcontinental country in Eastern Europe and Northern Asia. The vast majority of its population (80%) lives in European Russia, therefore Russia as a whole is included as a European country here. 2 Turkey is a transcontinental country in the Middle East and Southeast Europe. It has a small part of its territory (3%) in Southeast Europe called Turkish Thrace. 3 Armenia, Azerbaijan, and Georgia are transcontinental countries. Both have a small part of their territories in the European part of the Caucasus. 4 Kazakhstan is a transcontinental country. It has a small part of its territories located west of the Urals in Eastern Europe. 5 Cyprus is entirely in Southwest Asia, but has socio-political and historical connections with Europe. | |
- ↑ "Field listing: Location". CIA World Factbook. Retrieved 30 July 2017.
- ↑ "Field listing: Location". CIA World Factbook. Retrieved 30 July 2017.