Dordogne's 2nd constituency
| Dordogne's 2nd constituency | |
|---|---|
|
Constituency for the National Assembly | |
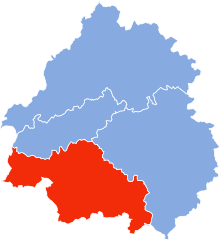 Boundary of Dordogne's 2nd constituency in Dordogne | |
 Location of Dordogne within France | |
| Department | Dordogne |
| Region | Nouvelle-Aquitaine |
| Population | 109,506 (2013)[1] |
| Electorate | 82,415 (2017)[2] |
| Current constituency | |
| Deputy | Michel Delpon |
| Political party | REM |
| Parliamentary group | REM |
Dordogne's 2nd constituency is one of four French legislative constituencies in the department of Dordogne. It is currently represented by Michel Delpon of La République En Marche! (REM).
Historic representation
| Legislature | Start of mandate | End of mandate | Deputy | Party | |
|---|---|---|---|---|---|
| 1st | 9 December 1958 | 9 October 1962 | Henri Sicard | UNR | |
| 2nd | 6 December 1962 | 2 April 1967 | Louis Pimont | DVG | |
| 3rd | 3 April 1967 | 30 May 1968 | SFIO | ||
| 4th | 11 July 1968 | 1 April 1973 | Jean Capelle | DVD | |
| 5th | 2 April 1973 | 9 November 1975 | Louis Pimont | PS | |
| 10 November 1975 | 2 April 1978 | Raoul Jarry | |||
| 6th | 3 April 1978 | 28 September 1980 | Michel Manet | ||
| 29 September 1980 | 29 November 1980 | Vacant | |||
| 30 November 1980 | 22 May 1981 | Michel Suchod | PS | ||
| 7th | 2 July 1981 | 1 April 1986 | |||
| 8th | 2 April 1986 | 14 May 1988 | Proportional representation | ||
| 9th | 23 June 1988 | 1 April 1993 | Michel Suchod | PS | |
| 10th | 2 April 1993 | 21 April 1997 | Daniel Garrigue | RPR | |
| 11th | 12 June 1997 | 18 June 2002 | Michel Suchod | MDC | |
| 12th | 19 June 2002 | 19 June 2007 | Daniel Garrigue | UMP | |
| 13th | 20 June 2007 | 19 June 2012 | |||
| 14th | 20 June 2012 | 20 June 2017 | Brigitte Allain | EELV | |
| 15th | 21 June 2017 | ongoing | Michel Delpon | REM | |
Elections
2017
| Candidate | Label | First round | Second round | |||
|---|---|---|---|---|---|---|
| Votes | % | Votes | % | |||
| Michel Delpon | REM | 14,844 | 34.73 | 22,317 | 66.32 | |
| Robert Dubois | FN | 6,816 | 15.95 | 11,331 | 33.68 | |
| Gaëlle Blanc-Lajonie | LR | 5,922 | 13.85 | |||
| Brigitte Allain | ECO | 5,105 | 11.94 | |||
| Chrystel Boutillier | FI | 4,702 | 11.00 | |||
| Armand Zaccaron | PCF | 3,142 | 7.35 | |||
| Magali Jimenez | ECO | 829 | 1.94 | |||
| Robert Richard | DLF | 715 | 1.67 | |||
| Éric Mercier | DIV | 363 | 0.85 | |||
| Sandrine Ruchot | EXG | 278 | 0.65 | |||
| Éric Villemagne | EXD | 29 | 0.07 | |||
| Votes | 42,745 | 100.00 | 33,648 | 100.00 | ||
| Valid votes | 42,745 | 97.23 | 33,648 | 86.41 | ||
| Blank votes | 800 | 1.82 | 3,711 | 9.53 | ||
| Null votes | 416 | 0.95 | 1,582 | 4.06 | ||
| Turnout | 43,961 | 53.32 | 38,941 | 47.25 | ||
| Abstentions | 38,486 | 46.68 | 43,474 | 52.75 | ||
| Registered voters | 82,447 | 82,415 | ||||
| Source: Ministry of the Interior | ||||||
References
- ↑ "Populations légales des circonscriptions législatives pour les élections de 2017". Institut national de la statistique et des études économiques. 1 December 2016. Retrieved 9 February 2018.
- ↑ "Résultats des élections législatives 2017". Ministère de l'Intérieur. 18 June 2017. Retrieved 9 February 2018.
External links
This article is issued from
Wikipedia.
The text is licensed under Creative Commons - Attribution - Sharealike.
Additional terms may apply for the media files.