Dordogne's 1st constituency
| Dordogne's 1st constituency | |
|---|---|
|
Constituency for the National Assembly | |
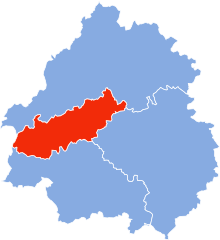 Boundary of Dordogne's 1st constituency in Dordogne | |
 Location of Dordogne within France | |
| Department | Dordogne |
| Region | Nouvelle-Aquitaine |
| Population | 105,553 (2013)[1] |
| Electorate | 76,013 (2017)[2] |
| Current constituency | |
| Deputy | Philippe Chassaing |
| Political party | REM |
| Parliamentary group | REM |
Dordogne's 1st constituency is one of four French legislative constituencies in the department of Dordogne. It is currently represented by Philippe Chassaing of La République En Marche! (REM).
Historic representation
| Legislature | Start of mandate | End of mandate | Deputy | Party | |
|---|---|---|---|---|---|
| 1st | 9 December 1958 | 9 October 1962 | Raoul Rousseau | UNR | |
| 2nd | 6 December 1962 | 2 April 1967 | Yves Guéna | ||
| 3rd | 3 April 1967 | 7 May 1968 | UD-Ve | ||
| 8 May 1968 | 30 May 1968 | Claude Guichard | |||
| 4th | 11 July 1968 | 12 August 1968 | Yves Guéna | RI | |
| 13 August 1968 | 1 April 1973 | Claude Guichard | |||
| 5th | 2 April 1973 | 6 May 1973 | Yves Guéna | UDR | |
| 7 May 1973 | 12 July 1974 | Jean Lovato | |||
| 13 July 1974 | 5 October 1974 | Vacant | |||
| 6 October 1974 | 2 April 1978 | Yves Guéna | UDR | ||
| 6th | 3 April 1978 | 22 May 1981 | RPR | ||
| 7th | 2 July 1981 | 18 January 1984 | Roland Dumas | PS | |
| 19 January 1984 | 1 April 1986 | Christian Défarge | |||
| 8th | 2 April 1986 | 14 May 1988 | Proportional representation | ||
| 9th | 23 June 1988 | 1 April 1993 | Bernard Bioulac | PS | |
| 10th | 2 April 1993 | 21 April 1997 | François Roussel | RPR | |
| 11th | 12 June 1997 | 18 June 2002 | Michel Dasseux | PS | |
| 12th | 19 June 2002 | 19 June 2007 | |||
| 13th | 20 June 2007 | 19 June 2012 | Pascal Deguilhem | ||
| 14th | 20 June 2012 | 20 June 2017 | |||
| 15th | 21 June 2017 | ongoing | Philippe Chassaing | REM | |
Elections
2017
| Candidate | Label | First round | Second round | |||
|---|---|---|---|---|---|---|
| Votes | % | Votes | % | |||
| Philippe Chassaing | REM | 13,785 | 34.59 | 17,298 | 52.53 | |
| Hélène Reys | FI | 7,129 | 17.89 | 15,633 | 47.47 | |
| Marie-Catherine Halliday | FN | 5,491 | 13.78 | |||
| Laurent Mossion | LR | 5,448 | 13.67 | |||
| Michel Moyrand | PS | 4,295 | 10.78 | |||
| Vianney Le Vacon | PCF | 1,673 | 4.20 | |||
| Yann Lavalou | ECO | 1,065 | 2.67 | |||
| Corinne Roethlisberger | EXG | 370 | 0.93 | |||
| Gallo Thiam | DVD | 328 | 0.82 | |||
| Daniel Santalo | DIV | 273 | 0.68 | |||
| Votes | 39,857 | 100.00 | 32,931 | 100.00 | ||
| Valid votes | 39,857 | 96.70 | 32,931 | 89.12 | ||
| Blank votes | 899 | 2.18 | 2,456 | 6.65 | ||
| Null votes | 462 | 1.12 | 1,566 | 4.24 | ||
| Turnout | 41,218 | 54.22 | 36,953 | 48.61 | ||
| Abstentions | 34,808 | 45.78 | 39,060 | 51.39 | ||
| Registered voters | 76,026 | 76,013 | ||||
| Source: Ministry of the Interior | ||||||
References
- ↑ "Populations légales des circonscriptions législatives pour les élections de 2017". Institut national de la statistique et des études économiques. 1 December 2016. Retrieved 9 February 2018.
- ↑ "Résultats des élections législatives 2017". Ministère de l'Intérieur. 18 June 2017. Retrieved 9 February 2018.
External links
This article is issued from
Wikipedia.
The text is licensed under Creative Commons - Attribution - Sharealike.
Additional terms may apply for the media files.