Demography of the Roman Empire
| Latin: Rōmānī | ||||||||||
|---|---|---|---|---|---|---|---|---|---|---|
| ||||||||||
| Total population | ||||||||||
| 61.4 million (164 CE) | ||||||||||
| Regions with significant populations | ||||||||||
| 61.4 million (164 CE) | ||||||||||
| Languages | ||||||||||
| Religion | ||||||||||
| Imperial cult (ancient Rome), ancient Roman religion, Hellenistic religion, Early Christianity, Second Temple Judaism | ||||||||||
| Related ethnic groups | ||||||||||
| other Mediterranean Sea peoples, other Italic peoples | ||||||||||


Demographically, the Roman Empire was a premodern state. There was a high infant mortality, low marriage age, and high fertility within marriage. According to A.H.M. Jones (Later Roman Empire, 1954, vol. II, p. 1041) "The death rate was uniformly high at all ages from ten, below which we have no reliable data"..."the infant and child death rate would have been very much greater than for adults. The female death rate was substantially higher than the male, especially in the child-bearing years. Thus in Africa, of 100 boys of ten 85 survived to 22, 74 to 32, 58 to 42, 47 to 52 and 36 to 62. For girls the corresponding percentages were 73, 54, 47, 39 and 28." These figures correspond to those arrived at by Bruce Frier in Bruce W. "Demography", in Alan K. Bowman, Peter Garnsey, and Dominic Rathbone, eds., The Cambridge Ancient History XI: The High Empire, A.D. 70–192, (Cambridge: Cambridge University Press, 2000), 827–54. Of those still alive at age 10, half would die by the age of 50 according to the African statistics cited by Jones, ibid. Roman women could expect to bear on average 6 to 9 children.. Life expectancy was in the mid-twenties. Of those who reached the age of 22 52% of men reached 52 and 39% of women reached the age of 52. The population curve was heavy at the bottom: the median age of the population of 0 million was 25 more or less. This has importance when considering the numbers of men eligible for military service from age 18 to 45 - on the face of it they were 20 percent plus (there were more males than females) of the population, 15 million(?), but the minimum height of 165cm (5 Roman feet, 7 inches) for rank and file new legionary recruits and the even greater one for elite units[1] eliminated half of them; unfit for service more, and 2.0 million had to be subtracted because they were slaves who were seldom pressed into service except in extreme emergencies leaving 5 million fit for service (of 13 million free men 18-45), i.e. 1 in 10 of qualified men had to be in the armed forces if these numbered 500,000. The pressure was partly relieved by enlisting men from outside the Empire (the so-called 'barbarians') to fill up the ranks which needed 40,000 recruits a year (half of whom had died before the end of their 20 and 25-year enlistments). These taken from a relatively small pool of voluntary and eligible recruits, 2.5 million, between the ages of 18-32.
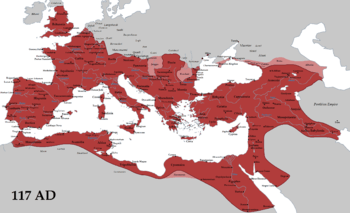
At its peak, after the Antonine Plague of the 160s CE, it had a population of about 60–70 million and a population density of about 16 persons per square kilometer spread evenly. However, the populations tended to be gathered in river valleys and areas suitable for cultivation; and in 2000 towns and cities. In contrast to the European societies of the classical and medieval periods, Rome had unusually high urbanization rates. During the 2nd century CE, the city of Rome had more than one million inhabitants. No Western city would have as many again until the 19th century.
Background
For the lands around the Mediterranean Sea and their hinterlands, the period from the second millennium BCE to the early first millennium CE was one of substantial population growth. What would become the territory of the Roman Empire saw an average annual population growth of about 0.1 per cent from the 12th century BCE to the 3rd century CE, resulting in a quadrupling of the region's total population. Growth was slower around the eastern Mediterranean, which was already more developed at the beginning of the period, on the order of about 0.07 per cent per year.[2] This was stronger growth than that seen in the succeeding period; from about 200 CE to 1800 CE, the European half of the empire only saw about 0.06 to 0.07 per cent annual growth (Europe as a whole saw 0.1 per cent annual growth rates), and the north African and west Asian parts of the empire saw almost no growth at all.[3]
By comparison, what is now the territory of China experienced 0.1 per cent annual growth from 1 CE to 1800 CE. After population decline following the disintegration of the western half of the Roman state in the fifth and sixth centuries, Europe probably re-attained Roman-era population totals in the twelfth and thirteenth centuries and, following another decline associated with the Black Death, consistently exceeded them after the mid-15th century.[3]
There are no reliable surviving records for the general demography of the Roman Empire. There are no detailed local records, such as underlie the demographic study of early modern Europe, either. Large numbers of impressionistic, moralizing, and anecdotal observations on demography survive from the literary sources. They are of little use in the study of Roman demography, which tends to rely instead on conjecture and comparison, rather than records and observations.[4][5]
Mortality
When the high infant mortality rate is factored in (life expectancy at birth) inhabitants of the Roman Empire had a life expectancy at birth of about 25 years. However, when infant mortality is factored out, life expectancy is doubled to the late-50s. If a Roman survived infancy to their mid-teens, they could, on average, expect near six decades of life, although of course many lived much longer or shorter lives for varied reasons. Although this figure relies more on conjecture than ancient evidence, which is sparse and of dubious quality, it is a point of general consensus among historians of the period. It originates in cross-country comparison: given the known social and economic conditions of the Roman Empire, we should expect a life expectancy near the lower bound of known pre-modern populations. Roman demography bears comparison to available data for India and rural China in the early 20th century, where life expectancies at birth were also in the low 20s.[6]
About 300 census returns filed in Egypt in the first three centuries CE survive. R. Bagnall and B. Frier have used them to build female and male age distributions, which show life expectancies at birth of between 22 and 25 years, results broadly consistent with model life tables.[7] Other sources used for population reconstructions include cemetery skeletons, Roman tombstones in North Africa, and an annuities table known as "Ulpian's life table". The basis and interpretation of these sources is disputed: the skeletons cannot be firmly dated, the tombstones show non-representative sample populations, and the sources of "Ulpian's life table" are unknown. Nonetheless, because they converge with low Roman elite survival rates shown in the literary sources, and because their evidence is consistent with data from populations with comparably high mortality rates, such as in 18th century France, and early 20th century China, India, and Egypt, they reinforce the basic assumption of Roman demography: that life expectancies at birth were in the low 20s.[8]
As no population for which accurate observations survive has such a low life expectancy, model life tables must be used to understand this population's age demography. These models, based on historical data, describe 'typical' populations at different levels of mortality. For his demographic synopsis of the Roman Empire, Bruce Frier used the Model West framework, as it is "the most generalized and widely applicable".[9] Because it is based on only one empirical input, the model life table can provide only a very approximate picture of Roman demography. On two important points, the table may seriously misrepresent the Roman situation: the structural relationship between juvenile and adult mortality, and the relative mortality rates across the sexes.[10][11] In any case, Roman mortality should be expected to have varied greatly across times, places, and perhaps classes.[12][notes 1] A variation of ten years would not have been unusual. A life expectancy range of between 20 and 30 years is therefore plausible,[14][8] though it may have been exceeded in either direction in marginal regions (e.g., malarious urban districts on one end; high-altitude, low-density settlements on the other).[8]
| Model West, level 3: a possible life table for the Roman Empire | ||||||
| Females | Males | |||||
| Age | Mortality | Cohort | Life expectancy | Mortality | Cohort | Life expectancy |
| 0 | 0.3056 | 100,000 | 25.0 | 0.3517 | 100,000 | 22.8 |
| 1 | 0.2158 | 69,444 | 34.9 | 0.2147 | 64,826 | 34.1 |
| 5 | 0.0606 | 54,456 | 40.1 | 0.0563 | 50,906 | 39.0 |
| 10 | 0.0474 | 51,156 | 37.5 | 0.0404 | 48,041 | 36.2 |
| 15 | 0.0615 | 48,732 | 34.2 | 0.0547 | 46,099 | 32.6 |
| 20 | 0.0766 | 45,734 | 31.3 | 0.0775 | 43,579 | 29.4 |
| 25 | 0.0857 | 42,231 | 28.7 | 0.0868 | 40,201 | 26.6 |
| 30 | 0.0965 | 38,614 | 26.1 | 0.1002 | 36,713 | 23.9 |
| 35 | 0.1054 | 34,886 | 23.7 | 0.1168 | 33,035 | 21.3 |
| 40 | 0.1123 | 31,208 | 21.1 | 0.1397 | 29,177 | 18.7 |
| 45 | 0.1197 | 27,705 | 18.5 | 0.1597 | 25,101 | 16.4 |
| 50 | 0.1529 | 24,389 | 15.6 | 0.1981 | 21,092 | 14.0 |
| 55 | 0.1912 | 20,661 | 13.0 | 0.2354 | 16,915 | 11.8 |
| 60 | 0.2715 | 16,712 | 10.4 | 0.3091 | 12,932 | 9.6 |
| 65 | 0.3484 | 12,175 | 8.4 | 0.3921 | 8,936 | 7.7 |
| 70 | 0.4713 | 7,934 | 6.5 | 0.5040 | 5,432 | 6.1 |
| 75 | 0.6081 | 4,194 | 4.9 | 0.6495 | 2,694 | 4.6 |
| 80 | 0.7349 | 1,644 | 3.6 | 0.7623 | 944 | 3.4 |
| 85 | 0.8650 | 436 | 2.5 | 0.8814 | 225 | 2.4 |
| 90 | 0.9513 | 59 | 1.8 | 0.9578 | 27 | 1.7 |
| 95 | 1.0000 | 3 | 1.2 | 1.0000 | 1 | 1.2 |
| After Frier, "Demography", 789, table 1.[notes 2] | ||||||
The specifics of any ancient age distribution, moreover, would have seen heavy variation under the impact of local conditions.[8] In pre-modern societies, the major cause of death was not the chronic, end-of-life conditions that characterize mortality in industrialized societies, nor primary malnutrition, but acute infectious disease, which has varied effects on age distributions in populations. Pulmonary tuberculosis, for example, characterized much of the Roman region in antiquity; its deaths tend to be concentrated in the early twenties, where model life tables show a mortality trough.[15] Similarly, in pre-modern societies for which evidence is available, such as early modern England and early eighteenth-century China, infant mortality varies independently of adult mortality, to the extent that equal life expectancies at age twenty can be obtained in societies with infant mortality rates of 15% to 35% (life table models omit this; they depend on the assumption that age-specific mortality ratios co-vary in uniform, predictable ratios).[16] No ancient evidence can gauge this effect (the sources have a strong tendency to overlook infant death), and the model life tables might overstate it, but comparative evidence suggests that it is very high: mortality was strongly concentrated in the first years of life.[17]
Mortality on this scale: (1) discourages investment in human capital, hindering productivity growth (adolescent mortality rates in Rome were two-thirds higher than in early modern Britain); (2) creates large numbers of dependent widows and orphans; and (3) hinders long-term economic planning. With the prevalence of debilitating diseases, the number of effective working years was even worse: health-adjusted life expectancy (HALE), the number of years lived in good health, varies from life expectancy by no more than 8% in modern societies; in high-mortality societies such as Rome, it could be as much as one-sixth (17%) beneath total life expectancy. A HALE of less than 20 years would have left the empire with very depressed levels of economic productivity.[18]
Fertility
To maintain replacement levels under such a mortality regime—much less to achieve sustained growth—fertility figures needed to be very high. With life expectancies of twenty to thirty, women would have to give birth to between 4.5 and 6.5 children to maintain replacement levels. Given elevated levels of divorce, widowhood, and sterility, however, the birth rate would have needed to be higher than that baseline, at around 6 to 9 children per woman.[19] Fertility could not long have either fallen below or outstripped replacement levels. A population which maintained an annual growth or decline of 0.7% would double or halve itself every century. Such rates are feasible locally or over a short period of time, and deaths could consistently outstrip births during epidemics, but, in the long term, convergence to maintenance levels was the rule.[20]
The surviving census returns from Roman Egypt speak to a population that had not yet undergone the "fertility transition"; artificial fertility controls like contraception and abortion were not widely used to alter natural fecundity in the Roman period. Only family limitation, in which couples ceased procreating after they had attained an acceptable level of children, could have been widespread.[21][22] There is no indication that even this limitation was widespread, however; the recorded distribution shows no evidence of being governed by parity or maternal age.[23]
| Marital fertility in Roman Egypt | ||||||
| Age | Natural fertility | |||||
| Attested rates | Gompertz Model | |||||
| 12–14 | 22 | 23 | 225 | |||
| 15–19 | 232 | 249 | 420 | |||
| 20–24 | 343 | 333 | 460 | |||
| 25–29 | 367 | 325 | 431 | |||
| 30–34 | 293 | 299 | 396 | |||
| 35–39 | 218 | 262 | 321 | |||
| 40–44 | 219 | 166 | 167 | |||
| 45–49 | 134 | 37 | 24 | |||
| After Frier, "Natural fertility", 325, table 1.[notes 3] | ||||||
Imperial Rome largely conforms to what is known as the "Mediterranean" pattern of marital fertility: men married late and women married early.[25] The evidence on marriage age is fairly robust for Roman elites: men in the senatorial class were expected to marry in their early twenties; women were expected to marry in their early teens. According to the most plausible interpretation of the evidence from funerary commemoration, in the lower classes, women married in their late teens or early twenties, and men married in their late twenties or early thirties.[26]
The Roman pattern thus stands in contrast to the "Eastern" (i.e., East Asian) pattern, in which both men and women married young.[25] China, the major example of the "Eastern" pattern, also had lower levels of fertility than Rome. This was apparently achieved by a combination of prolonged breastfeeding, female infanticide, and male celibacy, though the details are controversial.[27] Roman families share some features of the "Eastern" pattern. Roman Egypt, for example, had a custom of extended breastfeeding, which may have lengthened birth spacing. Egyptian fertility levels are comparable to those recorded in the early modern Japanese village Nakahara, where about half the population practiced family limitation. On the historian Walter Scheidel's judgment, this speaks to the incidence of family limitation even in what are supposedly "natural fertility" regimes.[28]
Roman and Greek literary and legal tradition also makes frequent reference to the "Eastern" demographic features of infanticide and child exposure. Although the extent of these practices is unlikely to have been small, it is nonetheless impossible to quantify (nor can reported gender ratios permit judgment on the prevalence of femicide). These "Eastern" features did not prevail in medieval or modern Europe, where there were cultural and structural factors directly discouraging them or diminishing their effects on childhood mortality (religious doctrine, legal enforcement, institutions of foundling care, child labor, wet-nursing, etc.). These constraints were weak or absent in Greek and Roman society.[29]
Migration
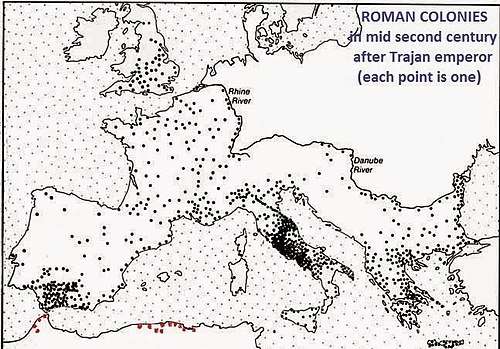
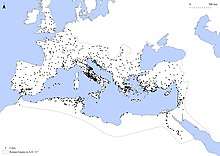
According to the Cavalli–Sforza reconstruction of genetic history, there was little migration in Europe after the Iron Age. Most population growth can therefore be ascribed to the gradual expansion of local populations under conditions of improving fertility, rather than inter-regional transfer. That said, local migration from village to village may have been substantial; for the successful dedication and expansion of new settlements, it would have been necessary. The geography of the Mediterranean made this fairly convenient;[30] at the beginning of the empire, about 750,000 Italians lived in the provinces.[30][31][32] Julius Caesar, Mark Anthony and Octavian–Augustus settled many of their veterans in colonies, in Italy, and the provinces. Those established in Italy up to 14 BCE have been studied by Keppie (1983). In his account of the achievements of his long reign (Res Gestae), Augustus stated that he had settled 120,000 soldiers in twenty colonies in Italy in 31 BCE, then 100,000 men in colonies in Spain and southern Gaul in 14 BCE, followed by another 96,000 in 2 BCE.[33] Brian Campbell also states "From 49 to 32 BCE about 420,000 Italians were recruited" – which would thus be the Veteran (citizen) stock that was largely sent to the provinces (colonies) during Augustus; The Lex Calpurnia however also allowed citizenship to be granted for distinguished bravery – as example the 1,000 Socii from Camerinum after Vercellae 101 BCE (Plutarch Mar. XXXVIII) or the auxiliary (later Legio XXII Deiotariana) after Zela. By the time of Augustus the legions consisted mostly of ethnic Latins/Italics and Cisalpine Gauls.[34] Historian Theodore Mommsen estimated that under Hadrian nearly 1/3 of the eastern Numidia population (roughly modern Tunisia and part of coastal Algeria) was descended from Roman veterans.[35]
Conversely, the foreign population of Rome was very small. Scientific evidence has shown that non-locals were in the minority, and most came from other parts of Italy or nearby provinces in Southern/Central Europe. Biochemical analysis of 166 skeletons from three non-elite imperial-era cemeteries in the vicinity of Rome revealed that only 1 individual definitely came from outside of Europe (North Africa), and another 2 possibly did, but results are inconclusive.[36][37] Other than that, there was no apparent net inter-regional migration in the imperial period, except perhaps a small continuous resettlement of Easterners in the West.[30]
Population
Modern estimates of the population of the Roman Empire derive from the fundamental work of nineteenth-century historian Karl Julius Beloch.[38] His estimates of the area of different components of the empire, based on planimetric estimates by contemporary military cartographers, have not been challenged by any more modern analyst. By providing a check to population densities, these area figures compel a baseline level of plausibility.[39] Beloch's 1886 estimate of the population of the empire in 14 CE has withstood contemporary and more recent criticism, and underlies modern analysis (his 1899 revision of those figures is less esteemed). Only his estimates for Anatolia and Greater Syria required extensive revision; Beloch estimated population figure, 19 million, produced population densities not otherwise achieved in those areas until the 20th century. Bruce Frier, in a recent estimate of the population of the empire, suggested a figure of 12 million as "considerably more plausible".[40] Beloch's figures for Spain and Africa have also been revised downwards.[41]
This estimate produces a population density of 13.6 inhabitants per square kilometer, a very low figure by modern standards (the United Kingdom, for example, has a population density of 254.7/km2). The population density in the Greek East was 20.9/km2, twice as dense as the Latin West at 10.6/km2; only the Western provinces of Italy and Sicily had a density comparable to the East.[42]
| Estimate of the Population of the Empire | ||||||
| Region | Area (1000 km2) |
14 CE Population (millions) |
14 CE Density (per km2) |
164 CE Population (millions) |
164 CE Density (per km2) |
Population increase (per cent) |
|---|---|---|---|---|---|---|
| Greek peninsula[notes 4] | 267 | 2.8 | 10.5 | 3.0 | 11.2 | 7.1 |
| Anatolia | 547 | 8.2 | 15.0 | 9.2 | 16.8 | 12.2 |
| Greater Syria[notes 5] | 109 | 4.3 | 39.4 | 4.8 | 44.0 | 11.6 |
| Cyprus | 9.5 | 0.2 | 21.2 | 0.2 | 21.1 | – |
| Egypt[notes 6] | 28 | 4.5 | 160.7 | 5.0 | 178.6 | 11.1 |
| Libya[notes 7] | 15 | 0.4 | 26.7 | 0.6 | 40.0 | 50.0 |
| Greek East | 975.5 | 20.4 | 20.9 | 22.9 | 23.5 | 12.3 |
| Annexations | 0.2 | |||||
| Greek East (with annexations) | 23.1 | |||||
| Italy | 250 | 7.0 | 28.0 | 7.6 | 30.4 | 8.6 |
| Sicily | 26 | 0.6 | 23.1 | 0.6 | 23.1 | – |
| Sardinia and Corsica | 33 | 0.5 | 15.2 | 0.5 | 15.2 | – |
| Maghreb[notes 8] | 400 | 3.5 | 8.8 | 6.5 | 16.3 | 85.7 |
| Iberia | 590 | 5.0 | 8.5 | 7.5 | 12.7 | 50.0 |
| Gaul and Germany | 635 | 5.8 | 9.1 | 9.0 | 14.2 | 55.2 |
| Danube Region[notes 9] | 430 | 2.7 | 6.3 | 4.0 | 9.3 | 48.1 |
| Latin West | 2,364 | 25.1 | 10.6 | 35.7 | 15.1 | 42.2 |
| Annexations | 2.5 | |||||
| Latin West (with annexations) | 38.2 | |||||
| Roman Empire | 3,339.5 | 45.5 | 13.6 | 61.4 | 15.9 | 34.9 |
| "Area" includes the client kingdoms taken over soon after 14 CE. After Frier, "Demography", 812, table 5, 814, table 6. | ||||||
Slaves constituted about 15 percent of the Empire's total population; the proportionate figure would be much higher in Italy and much lower in Africa and Egypt.[44]
| Estimated Distribution of Citizenship in the Roman Empire[45] | ||||||
| Region | Citizens (per cent) |
Noncitizen residents (per cent) |
Slaves (per cent) | |||
|---|---|---|---|---|---|---|
| Rome | 55 | 15 | 30 | |||
| Italy | 70 | 5 | 25 | |||
| Spain and Gaul | 10 | 70 | 20 | |||
| Other Western Provinces | 3 | 80 | 17 | |||
| Greece and Asia Minor | 3 | 70 | 27 | |||
| North African Provinces | 2 | 70 | 28 | |||
| Other Eastern Provinces | 1 | 80 | 19 | |||
There are few recorded population numbers for the whole of antiquity, and those that exist are often rhetorical or symbolic. Unlike the contemporaneous Han Dynasty, no general census survives for the Roman Empire. The late period of the Roman Republic provides a small exception to this general rule: serial statistics for Roman citizen numbers, taken from census returns, survive for the early Republic through the 1st century CE.[5] Only the figures for periods after the mid-3rd century BCE are reliable, however. Fourteen figures are available for the 2nd century BCE (from 258,318 to 394,736). Only four figures are available for the 1st century BCE, and are feature a large break between 70/69 BCE (910,000) and 28 BCE (4,063,000). The interpretation of the later figures—the Augustan censuses of 28 BCE, 8 BCE, and 14 CE—is therefore controversial.[46] Alternate interpretations of the Augustan censuses (such as those of E. Lo Cascio[47]) produce divergent population histories across the whole imperial period.[48][49]
| Population of Italy and the islands in 165 CE | ||||||
| Population (millions) |
Area (1000 km2) |
Density (per km2) | ||||
|---|---|---|---|---|---|---|
| Standard interpretation of the Augustan censuses | 8–9 | 310 | 26–29 | |||
| Revised interpretation of the Augustan censuses | 12–13 | 310 | 39–42 | |||
| After Scheidel, "Demography", 47 n. 42, 47. | ||||||
The enfranchisement of the Cisalpine provinces and the Italian Allies after the Social War would account for some of the population growth of the 1st century BCE.[50] Alternate readings of the Augustan census both accept the basic accuracy of the figures, but assume different methods on the part of the census-takers. The standard interpretation assumes that the census-takers included all citizens—men, women, and children—in the Augustan censuses; the revised interpretation assumes that the census-takers only counted adult men, as they had during the Republican period. The standard interpretation is not supported by any evidence internal to the text, but reduces the implied population totals for 28 BCE Italy from 10 million to a more plausible 4 million.[50] The high total earns support from recorded conflict over land in the late Republic and other indications of population pressure, but does not accord well with comparative evidence from other periods and other parts of the empire.[49]
Estimates
Beloch's 1886 estimate for the population of the empire during the reign of Augustus:[51][52]
| Region | Population (in millions) |
|---|---|
| Total Empire | 54 |
| European part | 23 |
| Asian part | 19.5 |
| North African part | 11.5 |
Russell's 1958 estimate for the population of the empire in 350 CE:[52]
| Region | Population (in millions) |
|---|---|
| Total Empire | 39.3 |
| European part | 18.3 |
| Asian part | 16 |
| North African part | 5 |
Recent demographic studies have argued for a population peak ranging from 70 million (comparable to the contemporaneous and similarly sized Han empire in China), with one-tenth of them located in Italy itself, to more than 100 million.[53]
Urbanization

By the standards of pre-modern economies, the Roman Empire was highly urbanized.
According to recent work, there were some 1,400 sites with urban characteristics in the Roman world in the Imperial period.[54] At its peak, the city of Rome had at least one million inhabitants, a total not equaled again until the 19th century.[54][55] As the imperial capital, Rome was sustained by transfers in kind from throughout the empire; no other city could be sustained at this level. Other major cities in the empire (Alexandria, Antioch, Carthage, Ephesus, etc.) had populations of about a few hundred thousand.[54][55] Of the remaining cities, most were quite small, usually possessing only 10–15,000 inhabitants. The cumulative urban population of the empire is estimated at around 14 million (using a population threshold of 5,000 individuals), indicating an urbanization rate of at least 25–30 % to be consistent with conventional estimates for the total population, comparable to those in the 19th century.[54][55]
High mortality rates and pre-modern sanitary conditions made urban regions net population sinks, with more local deaths than births. They could only be sustained by constant immigration.[56] The large cities provided a major stimulus to demand, and not only for agricultural products, but for manufactured goods and luxury items as well.[57]
Russell estimated the urban population in Late Antiquity, as follows.[52]
| City | Population (thousands) |
Region |
|---|---|---|
| Rome | 350 | Italy |
| Alexandria | 216 | Egypt |
| Antioch | 90 | Syria |
| Smyrna | 90 | Asia Minor |
| Cadiz | 65 | Hispania |
| Ephesus | 51 | Asia Minor |
| Carthage | 50 | Africa |
| Corinth | 50 | Greece |
| Apamea | 37 | Syria |
| Capua | 36 | Italy |
| Ancyra | 34 | Asia Minor |
| Nicomedia | 34 | Asia Minor |
| Oxyrhyncus | 34 | Egypt |
| Memphis | 34 | Egypt |
| Damascus | 31 | Syria |
| Bostra | 30 | Syria |
| Athens | 28 | Greece |
| Tarragona | 27 | Hispania |
| Cyzicus | 24 | Asia Minor |
| Hermopolis | 24 | Egypt |
| Pergamum | 24 | Asia Minor |
| Mytilene | 23 | Asia Minor |
| Arsinoe | 20 | Egypt |
| Cordoba | 20 | Hispania |
| Cirta | 20 | Africa |
| Hadrumetum | 20 | Africa |
| Pisa | 20 | Italy |
| Rusicade | 20 | Africa |
| Tyre | 20 | Syria |
| Catania | 18 | Italy |
| Nicaea | 18 | Asia Minor |
| Antiochia | 17 | Asia Minor |
| Antinoe | 16 | Egypt |
| Sicca V. | 16 | Africa |
| Mérida | 15 | Hispania |
| Miletus | 15 | Asia Minor |
| Naples | 15 | Italy |
| Heliopolis | 14 | Egypt |
| Baalbek | 13.5 | Syria |
| Thugga | 13 | Africa |
| Isaura | 12 | Asia Minor |
| Sidon | 12 | Syria |
| Bologna | 10 | Italy |
| Cartagena | 10 | Hispania |
| Hippo Regis | 10 | Africa |
| Jerusalem | 10 | Syria |
| Lambraesis | 10 | Africa |
| Pamplona | 10 | Hispania |
| Thysdrus | 10 | Africa |
| Trebizond | 10 | Asia Minor |
Notes
- ↑ Frier elsewhere quotes material to the effect that cross-class variation in life expectancy in high mortality societies is small.[13]
- ↑ "Mortality" is a function predicting the likelihood that a person aged exactly (x) will die before the next indicated interval; "cohort" lists the number of survivors to exact age (x).
- ↑ The Gompertz figures are obtained using linear regression on the census figures to create a relational fertility model, producing a probable schedule of true fertility rates. The model uses two values, α and β, that determine the model's relationship to a standard of early marriage and natural fertility. For this dataset, α, which indicates variation from median age of marital maternity, is −0.05, and β, which indicates the degree of fertility concentration, is 0.80. As the standard figure for β is 1.0, the dataset for Roman Egypt shows a wider spread of childbearing than is typical of the standard.[24]
- ↑ Roughly includes the southern Balkan peninsula; Greece, Albania, Republic of Macedonia, Kosovo, about half of Bulgaria and European Turkey. Or approximately the Roman provinces of Achaea, Macedonia, Epirus and Thracia.[43]
- ↑ Defined to include the modern territories of Lebanon, Israel and Palestine, as well as approximately the western half of Syria (i.e. the coastal Levant).[43]
- ↑ Area figure is only the narrow strip of land along the Nile and its delta. Not the vast deserts of Egypt.[43]
- ↑ Refers only to the coastal area of Cyrenaica.[43]
- ↑ Refers to the coastal area of North Africa. i.e. Northern areas of Morocco, Algeria, Tunisia and most of coastal Libya (except Cyrenaica).[43]
- ↑ Areas generally south of the river Danube. Includes the Roman provinces of Raetia, Noricum, Pannonia Superior, Pannonia Inferior, Illyricum (or Dalmatia) and Moesia (Superior and Inferior). Parts of modern Switzerland, southern Germany and Austria, western Hungary, Slovenia, Croatia, Bosnia, Montenegro, central Serbia and northern Bulgaria.[43]
References
- ↑ Roth, Jonathan P. (1999). The Logistics of the Roman Army at War: 264 B.C. - A.D. 235. Leiden, Boston, Köln: Brill. pp. 9–10.
- ↑ Scheidel 2007, p. 42–43.
- 1 2 Scheidel 2007, p. 43.
- ↑ Frier, "Demography", 787
- 1 2 Scheidel 2007, p. 42.
- ↑ Frier, "Demography", 788.
- ↑ Scheidel 2007, p. 38-39.
- 1 2 3 4 Scheidel 2007, p. 39.
- ↑ Frier, "Demography", 788. On this model, Frier cites A. J. Coale and P. Demeny Regional Model Life Tables and Stable Populations, 2nd ed. (Princeton, 1983).
- ↑ Frier, "Demography", 789
- ↑ Scheidel 2001, p. 1–26.
- ↑ Frier, "Demography", 789.
- ↑ Frier, "Roman life expectancy", 228 n. 36.
- ↑ Frier, "Demography", 789
- ↑ Scheidel 2001, p. 8.
- ↑ Scheidel 2001, p. 6-7.
- ↑ Scheidel 2007, p. 40.
- ↑ Scheidel 2007, p. 40-41.
- ↑ Scheidel 2007, p. 41.
- ↑ Scheidel 2007, p. 41-42.
- ↑ Frier, "Natural fertility", 318–26
- ↑ Scheidel 2007, p. 66-67.
- ↑ Scheidel 2007, p. 67.
- ↑ Frier, "Natural fertility", 325–26.
- 1 2 Scheidel 2007, p. 68.
- ↑ Saller, "Household", 90.
- ↑ Scheidel 2007, p. 68-69.
- ↑ Scheidel 2007, p. 69.
- ↑ Scheidel 2007, p. 69-70.
- 1 2 3 Scheidel 2007, p. 49-50.
- ↑ Scheidel 2007, p. 64.
- ↑ P. A. Brunt, Italian Manpower 225 B.C.–A.D. 14 (Oxford: Oxford University Press, 1987), 263.
- ↑ Pat Southern – The Roman Army: A Social and Institutional History (2006/Oxford Uni.)
- ↑ B. Campbell The Roman Army, 31 BC–AD 337 p.9
- ↑ Abun-Nasr, A History of the Maghrib (1970, 1977) at 35–37.
- ↑ "Isotopic evidence for age-related immigration to imperial Rome". American Journal of Physical Anthropology. 132: 510–519. doi:10.1002/ajpa.20541.
- ↑ "All Roads Lead to Rome: Exploring Human Migration to the Eternal City through Biochemistry of Skeletons from Two Imperial-Era Cemeteries (1st–3rd c AD)". PLOS ONE. 11: e0147585. doi:10.1371/journal.pone.0147585.
- ↑ Frier, "Demography", 811; Maddison, Contours of the World Economy, 32–33.
- ↑ Maddison, Contours of the World Economy, 33.
- ↑ Frier, "Demography", 811, 811 n. 95.
- ↑ Frier, "Demography", 811 n. 97.
- ↑ Frier, "Demography", 811–12.
- 1 2 3 4 5 6 Frier, "Demography", 812 table 5.
- ↑ Frier, "Demography", 812.
- ↑ Goldhill, Simon (2006). Being Greek Under Rome: Cultural Identity, the Second Sophistic and the Development of Empire. Cambridge University Press.
- ↑ Scheidel 2007, p. 45, Augustan census figures are recorded at Res Gestae 8..
- ↑ Lo Cascio, "Size of the Roman Population", 23–40.
- ↑ Maddison, Contours of the World Economy, 33
- 1 2 Scheidel 2007, p. 47.
- 1 2 Scheidel 2007, p. 45.
- ↑ Beloch, Karl Julius (1886). Die Bevölkerung der griechisch-römischen Welt. p. 507.
- 1 2 3 Russell, J. C. (1958). "Late ancient and medieval population". Philadelphia, PA: American Philosophical Society.
- ↑ Scheidel, Walter (April 2006) "Population and demography" in Princeton/Stanford Working Papers in Classics, p. 9
- 1 2 3 4 Hanson, J. W. (2016). An Urban Geography of the Roman World, 100 BC to AD 300. Oxford: Archaeopress. ISBN 9781784914721.
- 1 2 3 Hanson, J. W.; Ortman, S. G. (15 November 2017). "A systematic method for estimating the populations of Greek and Roman settlements". Journal of Roman Archaeology. 30: 301–324. doi:10.1017/S1047759400074134.
- ↑ Frier, "Demography", 813.
- ↑ Kehoe, Dennis P."The Early Roman Empire: Production", in W. Scheidel, I. Morris and R. Saller, eds., The Cambridge Economic History of the Greco-Roman World (Cambridge: Cambridge University Press, 2007), 543.
Bibliography
Ancient sources
- Digest.
- Scott, S. P., trans. The Digest or Pandects in The Civil Law. 17 vols. Cincinnati: Central Trust Company, 1932. Online at the Constitution Society. Accessed 31 August 2009.
- Res Gestae Divi Augusti
- Shipley, F., trans. Compendium of Roman History. Res Gestae Divi Augusti. Loeb Classical Library. Cambridge, MA: Harvard University Press, 1924. Online at LacusCurtius. Accessed 18 June 2010.
- Tacitus. Annales.
- Jackson, J., trans. Annals. Loeb Classical Library. 4 vols. Cambridge, MA: Harvard University Press, 1931–37. Online at LacusCurtius. Accessed 18 June 2010.
Modern sources
- Allen, Robert C. "How prosperous were the Romans? Evidence from Diocletian’s Price Edict (301 AD)", University of Oxford, Department of Economics, Discussion Paper Series No. 363 (October 2007), rept. in Alan Bowman and Andrew Wilson, eds., Quantifying the Roman Economy (Oxford: Oxford University Press, 2009), 327–45.
- Frier, Bruce W (1982). "Roman Life Expectancy: Ulpian's Evidence". Harvard Studies in Classical Philology. 86: 213–51. doi:10.2307/311195.
- Frier, Bruce W (1994). "Natural Fertility and Family Limitation in Roman Marriage". Classical Philology. 89 (4): 318–33. doi:10.1086/367430.
- Frier, Bruce W. "Demography", in Alan K. Bowman, Peter Garnsey, and Dominic Rathbone, eds., The Cambridge Ancient History XI: The High Empire, A.D. 70–192, (Cambridge: Cambridge University Press, 2000), 827–54.
- Hopkins, Keith (1966). "On the Probable Age Structure of the Roman Population". Population Studies. 20 (2): 245–64. doi:10.2307/2172985.
- Lo Cascio, Elio (1994). "The Size of the Roman Population: Beloch and the Meaning of the Augustan Census Figures". Journal of Roman Studies. 84: 23–40. doi:10.2307/300868.
- Lo Cascio, Elio. "The Early Roman Empire: The State and the Economy", in W. Scheidel, I. Morris and R. Saller, eds., The Cambridge Economic History of the Greco-Roman World (Cambridge: Cambridge University Press, 2007), 619–47.
- Maddison, Angus. Contours of the World Economy, 1–2030 AD: Essays in Macro-Economic History. Oxford: Oxford University Press, 2007.
- Morris, Ian, Richard P. Saller, and Walter Scheidel. "Introduction", in W. Scheidel, I. Morris and R. Saller, eds., The Cambridge Economic History of the Greco-Roman World (Cambridge: Cambridge University Press, 2007), 1–12.
- Saller, Richard P. "Household and Gender", in W. Scheidel, I. Morris and R. Saller, eds., The Cambridge Economic History of the Greco-Roman World (Cambridge: Cambridge University Press, 2007), 87–112.
- Scheidel, Walter (2001). "Roman Age Structure: Evidence and Models". Journal of Roman Studies. 91: 1–26. doi:10.1017/s0075435800015811.
- Scheidel, Walter (2007). "Demography". In Scheidel, W.; Morris, I.; Saller, R. The Cambridge Economic History of the Greco-Roman World. Cambridge: Cambridge University Press. pp. 38–86.
- Scheidel, Walter (2010). "Real Wages in Early Economies: Evidence for Living Standards from 1800 BCE to 1300 CE". Journal of the Economic and Social History of the Orient. 53: 425–62. doi:10.1163/156852010x506038.
- Scheidel, Walter; Friesen, Steven J. (2009). "The Size of the Economy and the Distribution of Income in the Roman Empire". Journal of Roman Studies. 99: 61–91. doi:10.3815/007543509789745223.
- Temin, Peter. "Estimating GDP in the Early Roman Empire", in E. Lo Cascio, ed., Innovazione tecnica e progresso economico nel mondo romano (2006), 31–54.