Demography of Japan
| Demographics of Japan | |
|---|---|
| Population | 126,672,000[1] |
The demographic features of the population of Japan include population density, ethnicity, education level, health of the populace, economic status, religious affiliations and other aspects regarding the population.
History
For information on historical demographic data in Japan prior to 1945 refer to:
Population
Historical populations
| Historical population | ||
|---|---|---|
| Year | Pop. | ±% |
| 1910 | 50,984,840 | — |
| 1915 | 54,935,755 | +7.7% |
| 1920 | 55,963,053 | +1.9% |
| 1925 | 59,736,822 | +6.7% |
| 1930 | 64,450,005 | +7.9% |
| 1935 | 69,254,148 | +7.5% |
| 1940 | 73,075,071 | +5.5% |
| 1945 | 71,998,104 | −1.5% |
| 1950 | 83,199,637 | +15.6% |
| 1955 | 89,275,529 | +7.3% |
| 1960 | 93,418,501 | +4.6% |
| 1965 | 98,274,961 | +5.2% |
| 1970 | 103,720,060 | +5.5% |
| 1975 | 111,939,643 | +7.9% |
| 1980 | 117,060,396 | +4.6% |
| 1985 | 121,048,923 | +3.4% |
| 1990 | 123,611,167 | +2.1% |
| 1995 | 125,570,246 | +1.6% |
| 2000 | 126,925,843 | +1.1% |
| 2005 | 127,767,994 | +0.7% |
| 2010 | 128,057,352 | +0.2% |
| 2015 | 127,094,745 | −0.8% |
| 2017 | 126,714,000 | −0.3% |
| 2017 estimate[3] | ||
Based on the census from October 2010, Japan's population was at its peak at 128,057,352. As of October 1, 2015, the population was 127,094,745[4] making it the world's tenth-most populous country at the time. It had declined by 0.8 percent from the time of the census five years ago, the first time it had declined since the 1945 census.[5] Japan's population size can be attributed to high growth rates experienced during the late 19th and early 20th centuries.
Since 2010, Japan has experienced net population loss due to falling birth rates and almost no immigration, despite having one of the highest life expectancies in the world, at 85.00 years as of 2016 (it was 81.25 as of 2006[6]). Using the annual estimate for October of each year, the population peaked in 2008 at 128,083,960 and had fallen 285,256 by October 2011.[7] Japan's population density was 336 people per square kilometer.
Based on 2012 data from the National Institute of Population and Social Security Research, Japan's population will keep declining by about one million people every year in the coming decades, which will leave Japan with a population of 42 million in 2110.[8] More than 40% of the population is expected to be over age 65 in 2060.[9] In 2012, the population had for six consecutive years declined by 212,000, the largest drop on record since 1947 and also a record low of 1.03 million births.[10] In 2014, a new record of population drop happened with 268,000 people.[11] In 2013, more than 20 percent of the population are age 65 and over.[12]
The population ranking of Japan dropped from 7th to 8th in 1990, to 9th in 1998, and to 10th in the early 21st century. In 2015 it dropped further to 11th place, according to both the UN and PRB. Over the period of 2010–2015, the population shrank by almost a million.[13]
Census
Japan collects census information every five years. The exercise is conducted by the Statistics Bureau of the Ministry of Internal Affairs.
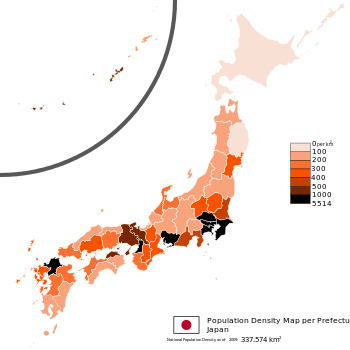
Population density
Japan's population density was 340.8 people per square kilometer (874 people per square mile) according to World Development Indicators. It ranks 35th in a list of countries by population density, ranking directly above Philippines (347 per km2) and directly below Curacao (359 per km2). Between 1955 and 1989, land prices in the six largest cities increased 15,000% (+12% a year). Urban land prices generally increased 40% from 1980 to 1987; in the six largest cities, the price of land doubled over that period. For many families, this trend put housing in central cities out of reach.
The result was lengthy commutes for many workers in the big cities, especially in Tokyo area where daily commutes of two hours each way are common. In 1991, as the bubble economy started to collapse, land prices began a steep decline, and within a few years fell 60% below their peak.[14] After a decade of declining land prices, residents began moving back into central city areas (especially Tokyo's 23 wards), as evidenced by 2005 census figures. Despite nearly 70% of Japan being covered by forests,[15] parks in many major cities—especially Tokyo and Osaka—are smaller and scarcer than in major West European or North American cities. As of 2014, parkland per inhabitant in Tokyo is 5.78 square meters,[16] which is roughly half of the 11.5 square meters of Madrid.[17]
National and regional governments devote resources to making regional cities and rural areas more attractive by developing transportation networks, social services, industry, and educational institutions in attempts to decentralize settlement and improve the quality of life. Nevertheless, major cities, especially Tokyo, Yokohama, and Fukuoka, and to a lesser extent Kyoto, Osaka and Nagoya, remain attractive to young people seeking education and jobs.
Urban distribution
Japan has a high population concentration in urban areas on the plains since 75% of Japan’s land area is made up of mountains,[18] and also Japan has a forest cover rate of 68.5% (the only other developed countries with such a high forest cover percentage are Finland and Sweden).[15] The 2010 census shows 90.7% of the total Japanese population live in cities.[19]
Japan is an urban society with about only 5% of the labor force working in agriculture. Many farmers supplement their income with part-time jobs in nearby towns and cities. About 80 million of the urban population is heavily concentrated on the Pacific shore of Honshu.[20]
Metropolitan Tokyo-Yokohama, with its population of 35 million residents, is the world's most populous city. Japan faces the same problems that confront urban industrialized societies throughout the world: overcrowded cities and congested highways.
Aging of Japan
Japan's population is aging faster than any other nation.[21] The population of those 65 years or older roughly doubled in 24 years, from 7.1% of the population in 1970 to 14.1% in 1994. The same increase took 61 years in Italy, 85 years in Sweden, and 115 years in France.[22] In 2014, 26% of Japan's population was estimated to be 65 years or older,[23] and the Health and Welfare Ministry has estimated that over-65s will account for 40% of the population by 2060.[24] The demographic shift in Japan's age profile has triggered concerns about the nation's economic future and the viability of its welfare state.[25]
 1888-12-31
 1920-10-01 (1st national census of population)
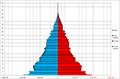 1925-10-01 (2nd national census of population)
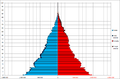 1930-10-01 (3rd national census of population)
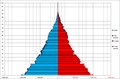 1935-10-01 (4th national census of population)
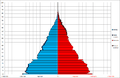 1940-10-01 (5th national census of population)
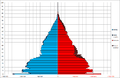 1947-10-01 (6th national census of population)
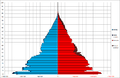 1950-10-01 (7th national census of population)
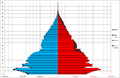 1955-10-01 (8th national census of population)
 1960-10-01 (9th national census of population)
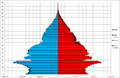 1965-10-01 (10th national census of population)
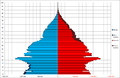 1970-10-01 (11th national census of population)
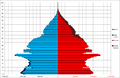 1975-10-01 (12th national census of population)
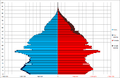 1980-10-01 (13th national census of population)
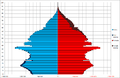 1985-10-01 (14th national census of population)
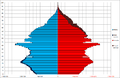 1990-10-01 (15th national census of population)
 1995-10-01 (16th national census of population)
 2000-10-01 (17th national census of population)
 2005-10-01 (18th national census of population)
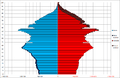 2010-10-01 (19th national census of population)
 2015-10-01 (20th national census of population)
| Year | Total population (census; in thousands) |
Population by age (%) | ||
|---|---|---|---|---|
| 0–14 | 15–64 | 65+ | ||
| 1935 | 69,254 | 36.9 | 58.5 | 4.7 |
| 1940 | 73,075 | 36.1 | 59.2 | 5.7 |
| 1945 | 71,998 | 36.8 | 58.1 | 5.1 |
| 1950 | 84,115 | 35.4 | 59.6 | 4.9 |
| 1955 | 90,077 | 33.4 | 61.2 | 5.3 |
| 1960 | 94,302 | 30.2 | 64.1 | 5.7 |
| 1965 | 99,209 | 25.7 | 68.0 | 6.3 |
| 1970 | 104,665 | 24.0 | 68.9 | 7.1 |
| 1975 | 111,940 | 24.3 | 67.7 | 7.9 |
| 1980 | 117,060 | 23.5 | 67.3 | 9.1 |
| 1985 | 121,049 | 21.5 | 68.2 | 10.3 |
| 1990 | 123,611 | 18.2 | 69.5 | 12.0 |
| 1995 | 125,570 | 15.9 | 69.4 | 14.5 |
| 2000 | 126,962 | 14.6 | 67.9 | 17.3 |
| 2005 | 127,768 | 13.7 | 65.8 | 20.1 |
| 2010 | 128,058 | 13.2 | 63.7 | 23.1 |
| 2015 | 127,095 | 12.6 | 60.7 | 26.6 |
| 2017[26] | 126,714 | 12.3 | 59.9 | 27.8 |
Demographic statistics from the CIA World Factbook
Population
Population in 5 households, 78.7% in urban areas (July 2000). High population density; 329.5 people per square kilometer for total area; 1,523 persons per square kilometer for habitable land. More than 50% of the population lives on 2% of the land. (July 1993). According to research in 2018, the population to land density ratio has gradually increased, now at 127 Million per 337 km2. Compared to the findings of July 1993 as well as in July 2000, the Population density has greatly increased, from 50% of the population living on 2% of the land to 77%. However, as the years have progressed since the last recordings of the population, Japan’s population has decreased immensely, raising concern about the future of Japan. There are many causes, such as the declining birthrates, as well as the ratio of men to women since the last measurements from the years of 2006 and 2010. According to researchers, the birth rate is said to decrease immensely as the year's progress, with an estimation of the population dropping from its current state of 126.26 million to 86.74 million by the year of 2060.
Sex ratio
(2006 est.)
- at birth: 1.05 male(s)/female
- under 15 years: 1.05 male(s)/female
- 15–64 years: 1.01 male(s)/female
- 65 years and over: 0.73 male(s)/female
- total population: 0.95 male(s)/female
(2010 est.)
- at birth: 1.056 male(s)/female
- under 15 years: 1.06 male(s)/female
- 15-64 years: 1.02 male(s)/female
- 65 years and over: 0.74 male(s)/female
- total population: 0.95 male(s)/female
HIV/AIDS
Adult prevalence rate
- less than 0.1% (2009 est.)[28]
People living with HIV/AIDS
- 12,000 (2003 est.)
- 9,600 (2007 est.)
Deaths
- 500 (2003 est.)
- fewer than 100 (2009 est.)[28]
Ethnic groups
Naturalized Japanese citizens and native-born Japanese nationals with multi-ethnic background are all considered to be Japanese in the population census of Japan,[29] therefore no ethnicity census data is available.
Marital status
- Over 15: Never married Male 61.8%, Female 58.2%.
- 16–24: Never married Male 31.8%, Female 23.7%.
- 25–29: Never married Male 69.3%, Female 54.0%.
- 30–34: Never married Male 42.9%, Female 26.6% (July 2000).
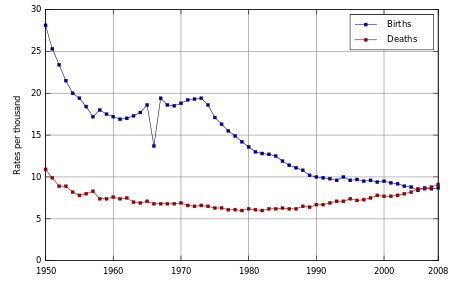
Vital statistics
Live births, birth and death rates and overall fertility rate in Japan from 1899 to present.[30][31][32]
| Average population (x 1000) | Live births | Deaths | Natural change | Crude birth rate (per 1000) | Crude death rate (per 1000) | Natural change (per 1000) | Total fertility rate[23][33] | Infant mortality rate (per 1000 births) | Life expectancy[23] (males) | Life expectancy (females) | |
|---|---|---|---|---|---|---|---|---|---|---|---|
| 1899 | 1 386 981 | 932 087 | 454 894 | 32.0 | 21.5 | 10.5 | 6.33 | 153.8 | |||
| 1900 | 43 847 | 1 420 534 | 910 744 | 509 790 | 32.4 | 20.8 | 11.6 | 6.25 | 155.0 | ||
| 1901 | 44 359 | 1 501 591 | 925 810 | 575 781 | 33.9 | 20.9 | 13.0 | 6.21 | 149.9 | ||
| 1902 | 44 964 | 1 510 853 | 959 126 | 551 709 | 33.6 | 21.3 | 12.3 | 6.16 | 154.0 | ||
| 1903 | 45 546 | 1 489 816 | 931 008 | 558 808 | 32.0 | 20.0 | 13.5 | 6.09 | 152.4 | ||
| 1904 | 46 135 | 1 440 371 | 955 400 | 484 971 | 30.6 | 21.2 | 10.7 | 6.04 | 151.9 | ||
| 1905 | 46 620 | 1 452 770 | 1 004 661 | 448 109 | 30.6 | 21.9 | 10.1 | 5.97 | 151.7 | ||
| 1906 | 47 038 | 1 394 295 | 955 256 | 439 039 | 29.0 | 20.0 | 10.6 | 5.69 | 153.6 | ||
| 1907 | 47 416 | 1 614 472 | 1 016 798 | 597 674 | 33.2 | 21.0 | 13.9 | 5.72 | 151.3 | ||
| 1908 | 47 965 | 1 662 815 | 1 029 447 | 633 368 | 33.7 | 20.9 | 14.5 | 5.79 | 158.0 | ||
| 1909 | 48 554 | 1 693 850 | 1 091 264 | 602 586 | 33.9 | 21.9 | 13.8 | 5.71 | 167.3 | ||
| 1910 | 49 184 | 1 712 857 | 1 064 234 | 648 623 | 33.9 | 21.1 | 14.5 | 5.63 | 161.2 | ||
| 1911 | 49 852 | 1 747 803 | 1 043 906 | 703 897 | 34.1 | 20.4 | 15.5 | 5.19 | 158.4 | ||
| 1912 | 50 577 | 1 737 674 | 1 037 016 | 700 658 | 33.4 | 20.0 | 15.3 | 5.08 | 154.2 | ||
| 1913 | 51 305 | 1 757 441 | 1 027 257 | 730 184 | 33.3 | 19.5 | 15.6 | 5.07 | 152.1 | ||
| 1914 | 52 039 | 1 808 402 | 1 101 815 | 706 587 | 33.8 | 20.6 | 14.9 | 5.14 | 158.5 | ||
| 1915 | 52 752 | 1 799 326 | 1 093 793 | 705 533 | 33.2 | 20.2 | 14.4 | 4.91 | 160.4 | ||
| 1916 | 53 496 | 1 804 822 | 1 187 832 | 616 990 | 32.9 | 21.6 | 12.7 | 4.98 | 170.3 | ||
| 1917 | 54 134 | 1 812 413 | 1 199 669 | 612 744 | 32.7 | 21.6 | 12.5 | 4.95 | 173.2 | ||
| 1918 | 54 739 | 1 791 992 | 1 493 162 | 298 830 | 32.2 | 26.7 | 6.4 | 4.83 | 188.6 | ||
| 1919 | 55 033 | 1 778 685 | 1 281 965 | 496 720 | 31.6 | 22.8 | 10.2 | 4.77 | 170.5 | ||
| 1920 | 55 963 | 2 025 564 | 1 422 096 | 603 468 | 36.2 | 25.4 | 12.0 | 6.45 | 165.7 | ||
| 1921 | 56 666 | 1 990 876 | 1 288 570 | 702 306 | 35.1 | 22.7 | 12.4 | 6.38 | 168.3 | ||
| 1922 | 57 390 | 1 969 314 | 1 286 941 | 682 373 | 34.3 | 22.4 | 11.9 | 5.12 | 166.4 | ||
| 1923 | 58 119 | 2 043 297 | 1 332 485 | 710 812 | 35.2 | 22.9 | 12.2 | 5.26 | 163.4 | ||
| 1924 | 58 876 | 1 998 520 | 1 254 946 | 743 574 | 33.9 | 21.3 | 12.6 | 5.07 | 156.2 | ||
| 1925 | 59 737 | 2 086 091 | 1 210 706 | 875 395 | 34.9 | 20.3 | 14.5 | 5.10 | 142.4 | ||
| 1926 | 60 741 | 2 104 405 | 1 160 734 | 943 671 | 34.6 | 19.1 | 15.5 | 5.19 | 137.5 | ||
| 1927 | 61 659 | 2 060 737 | 1 214 323 | 846 414 | 33.4 | 19.7 | 13.7 | 5 | 141.6 | ||
| 1928 | 62 595 | 2 135 852 | 1 236 711 | 899 141 | 34.1 | 19.8 | 14.4 | 5.09 | 136.7 | ||
| 1929 | 63 461 | 2 077 026 | 1 261 228 | 815 798 | 32.7 | 19.9 | 12.9 | 4.87 | 142.1 | ||
| 1930 | 64 450 | 2 085 101 | 1 170 867 | 914 234 | 32.4 | 18.2 | 14.2 | 4.70 | 124.1 | ||
| 1931 | 65 457 | 2 102 784 | 1 240 891 | 861 893 | 32.1 | 19.0 | 13.2 | 4.76 | 131.5 | ||
| 1932 | 65 800 | 2 182 742 | 1 175 344 | 1 007 398 | 32.9 | 17.7 | 15.2 | 4.86 | 117.5 | ||
| 1933 | 66 790 | 2 121 253 | 1 193 987 | 927 266 | 31.5 | 17.7 | 13.8 | 4.63 | 121.3 | ||
| 1934 | 67 680 | 2 043 783 | 1 234 684 | 809 099 | 29.9 | 18.1 | 11.9 | 4.39 | 124.8 | ||
| 1935 | 68 662 | 2 190 704 | 1 161 936 | 1 028 768 | 31.6 | 16.8 | 14.9 | 4.59 | 106.7 | ||
| 1936 | 69 590 | 2 101 969 | 1 230 278 | 871 691 | 30.0 | 17.5 | 12.4 | 4.34 | 116.7 | 46.92 | 49.63 |
| 1937 | 70 360 | 2 180 734 | 1 207 899 | 972 835 | 30.9 | 17.1 | 13.7 | 4.45 | 105.8 | ||
| 1938 | 70 590 | 1 928 321 | 1 259 805 | 668 516 | 27.2 | 17.7 | 9.4 | 3.88 | 114.4 | ||
| 1939 | 70 930 | 1 901 573 | 1 268 760 | 632 813 | 26.6 | 17.8 | 8.8 | 3.8 | 106.2 | ||
| 1940 | 71 540 | 2 115 867 | 1 186 595 | 929 272 | 29.4 | 16.4 | 12.9 | 4.11 | 90.0 | ||
| 1941 | 72 750 | 2 277 283 | 1 149 559 | 1 127 724 | 31.1 | 15.7 | 15.4 | 3.8 | 84.1 | ||
| 1942 | 73 450 | 2 233 660 | 1 166 630 | 1 067 030 | 30.3 | 15.8 | 14.4 | 4.18 | 85.5 | ||
| 1943 | 73 980 | 2 253 535 | 1 213 811 | 1 039 724 | 30.3 | 16.3 | 13.9 | 4.11 | 86.6 | ||
| 1944 | 73 865 | 2 149 843 | 1 279 639 | 870 204 | 29.2 | 17.4 | 11.8 | 3.8 | |||
| 1945 | 72 410 | 1 685 583 | 2 113 798 | -428 215 | 23.2 | 29.2 | -5.9 | 3.25 | |||
| 1946 | 75 300 | 1 905 809 | 1 326 592 | 579 217 | 25.3 | 17.6 | 7.7 | 4.46 | |||
| 1947 | 78 025 | 2 678 792 | 1 138 238 | 1 540 554 | 34.3 | 14.6 | 19.7 | 4.54 | 76.7 | 50.06 | 53.96 |
| 1948 | 79 500 | 2 681 624 | 950 610 | 1 731 014 | 33.7 | 12.0 | 21.8 | 4.40 | 61.7 | 55.6 | 59.4 |
| 1949 | 81 300 | 2 696 638 | 945 444 | 1 751 194 | 33.2 | 11.6 | 21.5 | 4.32 | 62.5 | 56.2 | 59.8 |
| 1950 | 82 900 | 2 337 507 | 904 876 | 1 432 631 | 28.2 | 10.9 | 17.3 | 3.65 | 60.1 | 58.0 | 61.5 |
| 1951 | 84 235 | 2 137 689 | 838 998 | 1 298 691 | 25.4 | 10.0 | 15.4 | 3.26 | 57.5 | 59.57 | 62.97 |
| 1952 | 85 503 | 2 005 162 | 765 068 | 1 240 094 | 23.5 | 8.9 | 14.5 | 2.98 | 49.4 | 61.9 | 65.5 |
| 1953 | 86 695 | 1 868 040 | 772 547 | 1 095 493 | 21.5 | 8.9 | 12.6 | 2.69 | 48.9 | 61.9 | 65.7 |
| 1954 | 87 976 | 1 769 580 | 721 491 | 1 048 089 | 20.1 | 8.2 | 11.9 | 2.48 | 44.6 | 63.41 | 67.69 |
| 1955 | 89 020 | 1 730 692 | 693 523 | 1 037 169 | 19.4 | 7.8 | 11.7 | 2.37 | 39.8 | 63.60 | 67.75 |
| 1956 | 89 953 | 1 665 278 | 724 460 | 940 818 | 18.5 | 8.1 | 10.5 | 2.22 | 40.6 | 63.59 | 67.54 |
| 1957 | 90 734 | 1 566 713 | 752 445 | 814 268 | 17.3 | 8.3 | 9.0 | 2.04 | 40.0 | 63.24 | 67.60 |
| 1958 | 91 546 | 1 653 469 | 684 189 | 969 280 | 18.1 | 7.5 | 10.6 | 2.11 | 34.5 | 64.98 | 69.61 |
| 1959 | 92 434 | 1 626 088 | 689 959 | 936 129 | 17.6 | 7.5 | 10.1 | 2.04 | 33.7 | 65.21 | 69.88 |
| 1960 | 94 094 | 1 606 041 | 706 599 | 899 442 | 17.3 | 7.6 | 9.7 | 2.00 | 30.7 | 65.32 | 70.19 |
| 1961 | 94 943 | 1 589 372 | 695 644 | 893 728 | 17.0 | 7.4 | 9.6 | 1.96 | 28.6 | 66.03 | 70.79 |
| 1962 | 95 832 | 1 618 616 | 710 265 | 908 351 | 17.1 | 7.5 | 9.6 | 1.98 | 26.4 | 66.23 | 71.16 |
| 1963 | 96 812 | 1 659 521 | 670 770 | 988 751 | 17.4 | 7.0 | 10.4 | 2.00 | 23.2 | 67.21 | 72.34 |
| 1964 | 97 826 | 1 716 761 | 673 067 | 1 043 694 | 17.8 | 6.9 | 10.8 | 2.05 | 20.4 | 67.67 | 72.87 |
| 1965 | 98 883 | 1 823 697 | 700 438 | 1 123 259 | 18.7 | 7.1 | 11.5 | 2.14 | 18.5 | 67.74 | 72.92 |
| 1966 | 99 790 | 1 360 974 | 670 342 | 690 632 | 13.8 | 6.8 | 7.1 | 1.58 | 19.3 | 68.35 | 73.61 |
| 1967 | 100 725 | 1 935 647 | 675 006 | 1 260 641 | 19.4 | 6.7 | 12.7 | 2.23 | 14.9 | 68.91 | 74.15 |
| 1968 | 102 061 | 1 871 839 | 686 555 | 1 185 284 | 18.5 | 6.8 | 11.8 | 2.13 | 15.3 | 69.05 | 74.30 |
| 1969 | 103 172 | 1 889 815 | 693 787 | 1 196 028 | 18.5 | 6.8 | 11.7 | 2.13 | 14.2 | 69.18 | 74.67 |
| 1970 | 104 345 | 1 934 239 | 712 962 | 1 221 277 | 18.7 | 6.9 | 11.9 | 2.13 | 13.1 | 69.31 | 74.66 |
| 1971 | 105 697 | 2 000 973 | 684 521 | 1 316 452 | 19.1 | 6.5 | 12.6 | 2.16 | 12.4 | 70.17 | 75.58 |
| 1972 | 107 188 | 2 038 682 | 683 751 | 1 354 931 | 19.2 | 6.4 | 12.8 | 2.14 | 11.7 | 70.50 | 75.94 |
| 1973 | 108 709 | 2 091 983 | 709 416 | 1 382 567 | 19.2 | 6.5 | 12.7 | 2.14 | 11.3 | 70.70 | 76.02 |
| 1974 | 110 162 | 2 029 989 | 710 510 | 1 319 479 | 18.4 | 6.4 | 12.0 | 2.05 | 10.8 | 71.16 | 76.31 |
| 1975 | 111 573 | 1 901 440 | 702 275 | 1 199 165 | 17.0 | 6.3 | 10.7 | 1.91 | 10.0 | 71.73 | 76.89 |
| 1976 | 112 775 | 1 832 617 | 703 270 | 1 129 347 | 16.3 | 6.2 | 10.0 | 1.85 | 9.3 | 72.15 | 77.35 |
| 1977 | 113 872 | 1 755 100 | 690 074 | 1 065 026 | 15.4 | 6.1 | 9.4 | 1.80 | 8.9 | 72.69 | 77.95 |
| 1978 | 114 913 | 1 708 643 | 695 821 | 1 012 822 | 14.9 | 6.1 | 8.8 | 1.79 | 8.4 | 72.97 | 78.33 |
| 1979 | 115 890 | 1 642 580 | 689 664 | 952 916 | 14.2 | 6.0 | 8.2 | 1.77 | 7.9 | 73.46 | 78.89 |
| 1980 | 116 807 | 1 576 889 | 722 801 | 854 088 | 13.5 | 6.2 | 7.3 | 1.75 | 7.5 | 73.35 | 78.76 |
| 1981 | 117 661 | 1 529 455 | 720 262 | 809 193 | 13.0 | 6.1 | 6.9 | 1.74 | 7.1 | 73.79 | 79.13 |
| 1982 | 118 480 | 1 515 392 | 711 883 | 803 509 | 12.8 | 6.0 | 6.8 | 1.77 | 6.6 | 74.22 | 79.66 |
| 1983 | 119 307 | 1 508 687 | 740 038 | 768 649 | 12.6 | 6.2 | 6.4 | 1.80 | 6.2 | 74.20 | 79.78 |
| 1984 | 120 083 | 1 489 780 | 740 247 | 749 533 | 12.4 | 6.2 | 6.2 | 1.81 | 6.0 | 74.54 | 80.18 |
| 1985 | 120 837 | 1 431 577 | 752 283 | 679 294 | 11.8 | 6.2 | 5.6 | 1.76 | 5.5 | 74.78 | 80.48 |
| 1986 | 121 482 | 1 382 946 | 750 620 | 632 326 | 11.4 | 6.2 | 5.2 | 1.72 | 5.2 | 75.23 | 80.93 |
| 1987 | 122 069 | 1 346 658 | 751 172 | 595 486 | 11.0 | 6.2 | 4.9 | 1.69 | 5.0 | 75.61 | 81.39 |
| 1988 | 122 578 | 1 314 006 | 793 014 | 520 992 | 10.7 | 6.5 | 4.3 | 1.66 | 4.8 | 75.54 | 81.30 |
| 1989 | 123 069 | 1 246 802 | 788 594 | 458 208 | 10.1 | 6.4 | 3.7 | 1.57 | 4.6 | 75.91 | 81.77 |
| 1990 | 123 478 | 1 221 585 | 820 305 | 401 280 | 10.0 | 6.7 | 3.2 | 1.54 | 4.6 | 75.92 | 81.90 |
| 1991 | 123 964 | 1 223 245 | 829 797 | 393 448 | 9.9 | 6.7 | 3.2 | 1.53 | 4.4 | 76.11 | 82.11 |
| 1992 | 124 425 | 1 208 989 | 856 643 | 352 346 | 9.8 | 6.9 | 2.9 | 1.50 | 4.5 | 76.09 | 82.22 |
| 1993 | 124 829 | 1 188 282 | 878 532 | 309 750 | 9.6 | 7.1 | 2.5 | 1.46 | 4.3 | 76.25 | 82.51 |
| 1994 | 125 178 | 1 238 328 | 875 933 | 362 395 | 10.0 | 7.1 | 2.9 | 1.50 | 4.2 | 76.57 | 82.98 |
| 1995 | 125 472 | 1 187 064 | 922 139 | 264 925 | 9.6 | 7.4 | 2.2 | 1.42 | 4.3 | 76.38 | 82.85 |
| 1996 | 125 757 | 1 206 555 | 896 211 | 310 344 | 9.7 | 7.2 | 2.5 | 1.43 | 3.8 | 77.01 | 83.59 |
| 1997 | 126 057 | 1 191 665 | 913 402 | 278 263 | 9.5 | 7.3 | 2.2 | 1.39 | 3.7 | 77.19 | 83.82 |
| 1998 | 126 400 | 1 203 147 | 936 484 | 266 663 | 9.6 | 7.5 | 2.0 | 1.38 | 3.6 | 77.16 | 84.01 |
| 1999 | 126 631 | 1 177 669 | 982 031 | 195 638 | 9.4 | 7.8 | 1.6 | 1.34 | 3.4 | 77.10 | 83.99 |
| 2000 | 126 843 | 1 190 547 | 961 653 | 228 894 | 9.5 | 7.7 | 1.8 | 1.36 | 3.2 | 77.72 | 84.60 |
| 2001 | 127 130 | 1 170 662 | 970 331 | 200 331 | 9.3 | 7.7 | 1.6 | 1.33 | 3.1 | 78.07 | 84.93 |
| 2002 | 127 386 | 1 153 855 | 982 379 | 171 476 | 9.2 | 7.8 | 1.4 | 1.32 | 3.0 | 78.32 | 85.23 |
| 2003 | 127 670 | 1 123 610 | 1 014 951 | 108 659 | 8.9 | 8.0 | 0.9 | 1.29 | 3.0 | 78.36 | 85.33 |
| 2004 | 127 680 | 1 110 721 | 1 028 602 | 82 119 | 8.8 | 8.2 | 0.7 | 1.29 | 2.8 | 78.64 | 85.59 |
| 2005 | 127 760 | 1 062 530 | 1 083 796 | -21 266 | 8.4 | 8.6 | -0.2 | 1.26 | 2.8 | 78.56 | 85.52 |
| 2006 | 127 710 | 1 092 674 | 1 084 450 | 8 224 | 8.7 | 8.6 | 0.1 | 1.32 | 2.6 | 79.00 | 85.81 |
| 2007 | 127 750 | 1 089 818 | 1 108 334 | -18 516 | 8.6 | 8.8 | -0.1 | 1.34 | 2.6 | 79.19 | 85.99 |
| 2008 | 127 680 | 1 091 156 | 1 142 407 | -51 251 | 8.7 | 9.1 | -0.4 | 1.37 | 2.6 | 79.29 | 86.05 |
| 2009 | 127 550 | 1 070 035 | 1 141 865 | -71 830 | 8.5 | 9.1 | -0.6 | 1.37 | 2.4 | 79.59 | 86.44 |
| 2010 | 127 430 | 1 071 304 | 1 197 012 | -125 708 | 8.5 | 9.5 | -1.0 | 1.39[34] | 2.3 | 79.64 | 86.39 |
| 2011 | 127 770 | 1 050 806 | 1 253 066 | -202 260 | 8.3 | 9.9 | -1.6 | 1.39 | 2.3 | 79.44 | 85.90 |
| 2012 | 127 400 | 1 037 231 | 1 256 359 | -219 128 | 8.2 | 10.0 | -1.7 | 1.41 | 2.2 | 79.93 | 86.37 |
| 2013 | 127 150 | 1 029 816 | 1 268 436 | -238 620 | 8.2 | 10.1 | -1.9 | 1.43 | 2.1 | 80.19 | 86.56 |
| 2014 | 127 083 | 1 003 539 | 1 273 004 | -269 465 | 8.0 | 10.1 | -2.1[11] | 1.42 | 80.48 | 86.77 | |
| 2015 | 126 900 | 1 005 677 | 1 290 444 | -284 767 | 8.0 | 10.3 | -2.3 | 1.45 | 80.75 | 86.98 | |
| 2016 | 126 585 | 976 978 | 1 307 748 | –330 770 | 7.8 | 10.5 | -2.6 | 1.44 | 80.98 | 87.14 | |
| 2017 p | 126 490 | 946 060 | 1 340 433 | –394 373 | 7.6 | 10.8 | -3.2 | 1.43 | 81.09 | 87.26 |
2012 (and 2011) update:[35]
Total fertility rate
Japan's total fertility rate (TFR) in 2012 was estimated at 1.41 children per woman, increasing slightly from 1.32 in the 2001–05 period. In 2012, the highest TFR was 1.90, in Okinawa, and the lowest was 1.09, in Tokyo. TFR by prefecture for 2000–05, as well as future estimates, have been released.[36]:page 30
Life expectancy
Sources: Our World In Data and the United Nations.
1865-1949
| Years | 1865 | 1870 | 1875 | 1880 | 1885 | 1890 | 1895 | 1900 | 1905 | 1910 | 1915 | 1920 | 1922 | 1927 | 1935 | 1945 | 1947 | 1948 | 1949 | 1950[37] |
|---|---|---|---|---|---|---|---|---|---|---|---|---|---|---|---|---|---|---|---|---|
| Life expectancy in Japan | 36.4 | 36.6 | 36.8 | 37.0 | 37.3 | 37.7 | 38.1 | 38.6 | 39.2 | 40.0 | 40.9 | 42.0 | 42.6 | 45.7 | 48.2 | 30.5 | 51.7 | 56.8 | 57.7 | 59.2 |
1950-2015
| Period | Life expectancy in Years |
Period | Life expectancy in Years |
|---|---|---|---|
| 1950–1955 | 62.8 | 1985–1990 | 78.5 |
| 1955–1960 | 66.4 | 1990–1995 | 79.4 |
| 1960–1965 | 69.2 | 1995–2000 | 80.5 |
| 1965–1970 | 71.4 | 2000–2005 | 81.8 |
| 1970–1975 | 73.3 | 2005–2010 | 82.7 |
| 1975–1980 | 75.4 | 2010–2015 | 83.3 |
| 1980–1985 | 77.0 |
Source: UN World Population Prospects[38]
Migration
Internal migration
Between 6 million and 7 million people moved their residences each year during the 1980s. About 50% of these moves were within the same prefecture; the others were relocations from one prefecture to another. During Japan's economic development in the twentieth century, and especially during the 1950s and 1960s, migration was characterized by urbanization as people from rural areas in increasing numbers moved to the larger metropolitan areas in search of better jobs and education. Out-migration from rural prefectures continued in the late 1980s, but more slowly than in previous decades.
In the 1980s, government policy provided support for new urban development away from the large cities, particularly Tokyo, and assisted regional cities to attract young people to live and work there. Regional cities offered familiarity to those from nearby areas, lower costs of living, shorter commutes, and, in general, a more relaxed lifestyle than could be had in larger cities. Young people continued to move to large cities, however, to attend universities and find work, but some returned to regional cities (a pattern known as U-turn) or to their prefecture of origin (a pattern referred to as "J-turn").
Government statistics show that in the 1980s significant numbers of people left the largest central cities (Tokyo and Osaka) to move to suburbs within their metropolitan areas. In 1988 more than 500,000 people left Tokyo, which experienced a net loss through migration of nearly 73,000 for the year. Osaka had a net loss of nearly 36,000 in the same year.
Due to decreasing total population of the country, only 8 prefectures show increase in population. These are Okinawa(2.9%), Tokyo(2.7%), Aichi(1.0%), Saitama(1.0%), Kanagawa(0.9%), Fukuoka(0.6%), Shiga(0.2%), and Chiba(0.1%).[39]
Emigration
About 663,300 Japanese were living abroad, approximately 75,000 of whom had permanent foreign residency, more than six times the number who had that status in 1975. More than 200,000 Japanese went abroad in 1990 for extended periods of study, research, or business assignments. As the government and private corporations have stressed internationalization, greater numbers of individuals have been directly affected, decreasing Japan's historical insularity. By the late 1980s, these problems, particularly the bullying of returnee children in schools, had become a major public issue both in Japan and in Japanese communities abroad.
Cities with significant populations of Japanese nationals
- Los Angeles, United States: 68,689
- Bangkok, Thailand: 48,700
- Shanghai, China: 46,115
- New York, United States: 44,636
- Singapore: 36,963
- London, United Kingdom: 36,721
- Sydney, Australia: 30,448
- Vancouver, Canada: 26,999
- Hong Kong, China: 26,869
- San Francisco, United States: 18,777
- Toronto, Canada: 13,410
Note: The above data shows the number of Japanese nationals living overseas. It was published by the Ministry of Foreign Affairs of Japan and relates to 2015.[40]
Immigration
According to the Japanese immigration centre,[29] the number of foreign residents in Japan has steadily increased, and the number of foreign residents (excluding a small number of illegal immigrants and short-term visitors, such as foreign nationals staying less than 90 days in Japan),[41] exceeded 2.2 million people in 2008.[29]
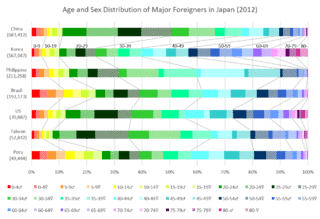
In 2010, the number of foreigners in Japan was 2,134,151. This includes 209,373 Filipinos, many of whom are married to Japanese nationals,[42] 210,032 Brazilians, the majority possessing some degree of Japanese ancestry,[42] 687,156 Chinese and 565,989 Koreans. Chinese, Filipinos, Koreans, and Brazilians account for about 69.5% of foreign residents in Japan.[43]
The current issue of the shrinking workforce in Japan alongside its aging population has resulted in a recent need to attract foreign labour to the country. Reforms which took effect in 2015 relax visa requirements for "Highly Skilled Foreign Professionals" and create a new type of residence status with an unlimited period of stay.
The number of naturalizations peaked in 2008 at 16,000, declining to over 9,000 in the most recent year for which data are available.[44] Most of the decline is accounted for by a steep reduction in the number of Japan-born Koreans taking Japanese citizenship. Historically the bulk of those taking Japanese citizenship have not been foreign-born immigrants but rather Japanese-born descendants of Koreans and Taiwanese who lost their citizenship in the Japanese Empire in 1947 as part of the American Occupation policy for Japan.
Japanese statistical authorities do not collect information on ethnicity, only nationality. As a result, both native and naturalized Japanese citizens are counted in a single group.[29] Although official statistics show near homogeneity, one analysis describe the population as “multi-ethnic”, although unofficial statistics still show that ethnic minorities are small compared with many other countries.[45]
In 2015 the Japanese government under prime minister Shinzō Abe announced that its policy of restricting immigration would not change despite the current declining population.[46][47] In the long term, its plan is to improve technology to address the labour shortage, while increasing Japanese fertility rates from the current level of 1.4 to 1.8, eventually stabilizing the population at approximately 100 million. [48]
Languages
The Japanese society of Yamato people is linguistically homogeneous with small populations of Koreans (0.9 million), Chinese/Taiwanese (0.65 million), Filipino (306,000 some being Japanese Filipino; children of Japanese and Filipino parentage).[49] Brazilians (300,000, many of whom are ethnically Japanese) as well as Peruvians and Argentineans of both Latin American and Japanese descent. Japan has indigenous minority groups such as the Ainu and Ryukyuans, who generally speak Japanese.
Japanese citizenship is conferred jus sanguinis, and monolingual Japanese-speaking minorities often reside in Japan for generations under permanent residency status without acquiring citizenship in their country of birth, although legally they are allowed to do so. This is because Japanese law does not recognise dual citizenship after the age of adulthood, and so people becoming naturalised Japanese citizens must relinquish citizenship of other countries when they reach the age of 20. Some ethnic Koreans and Chinese and their descendants (who may speak only Japanese and may never have even visited the country whose nationality they hold) do not wish to abandon this other citizenship.
In addition, people taking Japanese citizenship must take a name using the Japanese character sets hiragana, katakana, and/or kanji. Names using Western alphabet, Korean alphabet, Arabic characters, etc. are not acceptable as legal names. Chinese characters are usually legally acceptable as nearly all Chinese characters are recognized as valid by the Japanese government. Transliterations of non-Japanese names using katakana (e.g. スミス "Sumisu" for "Smith") are also legally acceptable.
However, some naturalizing foreigners feel that becoming a Japanese citizen should mean that they have a Japanese name and that they should abandon their foreign name, and some foreign residents do not wish to do this—although most Special Permanent Resident Koreans and Chinese already use Japanese names. Nonetheless, some 10,000 Zainichi Koreans naturalize every year. Approximately 98.6% of the population are Japanese citizens, and 99% of the population speak Japanese as their first language. Non-ethnic Japanese in the past, and to an extent in the present, also live in small numbers in the Japanese archipelago.[45]
Society
Lifestyle
Japanese people enjoy a high standard of living, and nearly 90% of the population consider themselves part of the middle class. However, many studies on happiness and satisfaction with life tend to find that Japanese people average relatively low levels of life satisfaction and happiness when compared with most of the highly developed world; the levels have remained consistent if not declining slightly over the last half century.[50][51][52][53] Japanese have been surveyed to be relatively lacking in financial satisfaction.[54]
The suicide rates per 100,000 in Japan in 2009 were 29.2 for men and 10.5 for women.[55] In 2010, 32,000 Japanese committed suicide, which translates to an average of 88 Japanese suicides a day in 2010.[56]
Minorities
Discrimination against ethnic minorities
Three native Japanese minority groups can be identified. The largest are the hisabetsu buraku or "discriminated communities", also known as the burakumin. These descendants of premodern outcast hereditary occupational groups, such as butchers, leatherworkers, funeral directors, and certain entertainers, may be considered a Japanese analog of India's Dalits. Discrimination against these occupational groups arose historically because of Buddhist prohibitions against killing and Shinto notions of pollution, as well as governmental attempts at social control.
During the Tokugawa period, such people were required to live in special buraku and, like the rest of the population, were bound by sumptuary laws based on the inheritance of social class. The Meiji government abolished most derogatory names applied to these discriminated communities in 1871, but the new laws had little effect on the social discrimination faced by the former outcasts and their descendants. The laws, however, did eliminate the economic monopoly they had over certain occupations. The buraku continued to be treated as social outcasts and some casual interactions with the majority caste were perceived taboo until the era after World War II.
Estimates of their number range from 2 to 4 million (about 2% to 3% of the national population). Although members of these discriminated communities are physically indistinguishable from other Japanese, they often live in urban ghettoes or in the traditional special hamlets in rural areas, and membership can be surmised from the location of the family home, occupation, dialect, or mannerisms. Checks on family background designed to ferret out buraku were commonly performed as part of marriage arrangements and employment applications, but have been illegal since 1985 in Osaka.
Past and current discrimination has resulted in lower educational attainment and socioeconomic status among hisabetsu buraku than among the majority of Japanese. Movements with objectives ranging from "liberation" to encouraging integration have tried to change this situation, with some success. Nadamoto Masahisa of the Buraku History Institute estimates that as of 1998, between 60 and 80% of burakumin marry a non-burakumin.[57]
Ryukyuans
One of the largest minority groups among Japanese citizens is the Ryukyuan people[58]. They are primarily distinguished from their use of several distinct Ryukyuan languages though use of Ryukyuan is dying out. The Ryukyuan people and language originated in the Ryukyu Islands, which are in Okinawa prefecture.
Ainu
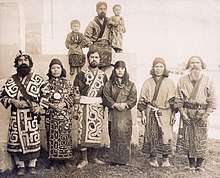
The third largest minority group among Japanese citizens is the Ainu, whose language is an isolate. Historically, the Ainu were an indigenous hunting and gathering population who occupied most of northern Honshū as late as the Nara period (A.D. 710–94). As Japanese settlement expanded, the Ainu were pushed northward, by the Tokugawa shogunate, the Ainu were pushed into the island of Hokkaido.[59]
Characterized as remnants of a primitive circumpolar culture, the fewer than 20,000 Ainu in 1990 were considered racially distinct and thus not fully Japanese. Disease and a low birth rate had severely diminished their numbers over the past two centuries, and intermarriage had brought about an almost completely mixed population.
Although no longer in daily use, the Ainu language is preserved in epics, songs, and stories transmitted orally over succeeding generations. Distinctive rhythmic music and dances and some Ainu festivals and crafts are preserved, but mainly in order to take advantage of tourism.
Hāfu
Hāfu is a term used for people who are biracial and ethnically half Japanese. Of the 1 million children born in Japan in 2013, 2.2% had one or more non-Japanese parent.[70] According to the Japanese Ministry of Health, Labor and Welfare, one in forty-nine babies born in Japan today are born into families with one non-Japanese parent.[60] Most intermarriages in Japan are between Japanese men and women from other Asian countries, including China, the Philippines and South Korea.[61] Southeast Asia too, also has significant populations of people with half-Japanese ancestry, particularly in the Philippines, Indonesia, Malaysia, Singapore and Thailand.
In the 1940s, biracial Japanese children (Ainoko) encountered social problems such as poverty, perception of impurity and discrimination due to negative treatment in Japan.[62] In the 21st century, discrimination against hāfu occurs based on how different their identity, behaviour and appearance is from a typical Japanese person.
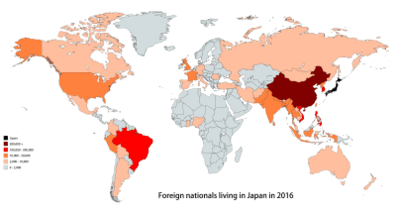
Foreign residents
In 2005, there were 1,555,505 foreign residents in Japan, representing 1.22% of the Japanese population.[63] Foreign Army personnel, of which there were up to 430,000 from the SCAP (post-occupation, United States Forces Japan) and 40,000 BCOF in the immediate post-war years, have not been at any time included in Japanese foreign resident statistics.[64] Most foreign residents in Japan come from Brazil or from other Asian countries, particularly from China, South Korea, the Philippines, Vietnam and Nepal.[65][66]
A number of long-term resident Koreans in Japan today retain familial links with the descendants of Koreans,[67] that either immigrated voluntarily or were forcibly relocated during the Japanese Occupation of the Korea. Within this group, a number hold Special Permanent Resident status, granted under the terms of the Normalisation Treaty (22. June 1965) between South Korea and Japan.[68] In many cases special residents, despite being born in Japan and speaking Japanese, have chosen not to take advantage of the mostly automatic granting of citizenship to special resident applicants.[69]
Beginning in 1947 the Japanese government started to repatriate Korean nationals, who had nominally been granted Japanese citizenship during the years of military occupation. When the Treaty of San Francisco came into force many ethnic Koreans lost their Japanese citizenship from April 28, 1952 and with it the right to welfare grants, to hold a government job of any kind or to attend Japanese schools.[64] In the following year the government contrived, with the help of the Red Cross, a scheme to "repatriate" Korean residents, who mainly were from the Southern Provinces, to their "home" of North Korea.[70] Between 1959 and 1984 93,430 people used this route. 6,737 were Japanese or Chinese dependents. Most of these departures – 78,276 – occurred before 1962.[71]
Source:Japan Statistics Bureau[72]
All non-Japanese without special residential status (people whose residential roots go back to before WWII) are required by law to register with the government and carry alien registration cards. From the early 1980s, a civil disobedience movement encouraged refusal of the fingerprinting that accompanied registration every five years.
Opponents of fingerprinting argued that it was discriminatory because the only Japanese who were fingerprinted were criminals. The courts upheld fingerprinting, but the law was changed so that fingerprinting was done once rather than with each renewal of the registration, which until a law reform in 1989 was usually required every six months for anybody from the age of 16. Those refusing fingerprinting were denied re-entry permits, thus depriving them of freedom of movement.
Of these foreign residents below, the new wave started 2014 comes to Japan as students or trainees. These foreigners are registered under student visa or trainee visa which gives them the student residency status, Most of these new foreigners are under this visa. Almost all of these foreign students and trainees will return to their home country after 3–4 years (one valid period), few students extend their visa. Vietnamese makes the largest increase, however Burmese, Cambodians, Filipinos and Chinese are also increasing.
Asian migrant wives of Japanese men have also contributed to the foreign-born population in the country. Many young single Japanese male farmers choose foreign wives, mainly from the Philippines, Sri Lanka, Thailand, China and South Korea, due to a lack of interest from Japanese women living a farming life.[73] Migrant wives often travel as mail-order brides as a result of arranged marriages with Japanese men.[74] Additionally, Japanese men in urban parts of the country have also begun marrying foreign Asian women.
| Country | 2017[75] | 2015[76] | 2014[77] | 2012[78] | 2011 | 2010 | 2005 | 2000 | 1990 | Main Articles |
|---|---|---|---|---|---|---|---|---|---|---|
| 711,486 | 665,847[79] | 654,777[79] | 652,555[79] | 674,879 | 687,156 | 519,561 | 335,575 | 137,499 | Chinese people in Japan | |
| 452,953 | 457,772 | 501,230 | 530,046 | 545,401 | 565,989 | 598,687 | 635,269 | 681,838 | Koreans in Japan | |
| 251,934 | 229,595 | 217,585 | 209,974 | 209,376 | 210,181 | 187,261 | 144,871 | 38,925 | Filipinos in Japan | |
| 232,562 | 146,956 | 99,865 | 52,364 | 44,690 | 41,781 | 28,932 | 16,908 | 6,316 | Vietnamese people in Japan | |
| 185,967 | 173,437 | 175,410 | 190,581 | 210,032 | 230,552 | 302,080 | 254,394 | 14,258 | Brazilians in Japan | |
| 74,300 | 54,775 | 42,346 | 24,069 | 20,383 | 17,525 | 6,953 | 3,649 | 399 | Nepalis in Japan | |
| 54,918 | 52,271 | 51,256 | 48,357 | 49,815 | 50,667 | 49,390 | 44,856 | 34,900 | Americans in Japan | |
| 54,358 | 48,723 | 40,197 | 22,773 | Taiwanese people in Japan | ||||||
| 48,952 | 45,379 | 43,081 | 40,130 | 42,750 | 41,279 | 37,703 | 29,289 | 5,542 | Thais in Japan | |
| 47,861 | 47,721 | 47,978 | 49,248 | 52,842 | 54,636 | 57,728 | 46,171 | 4,121 | Peruvian migration to Japan | |
| 46,350 | 35,910 | 30,210 | 25,530 | 24,660 | 24,895 | 25,097 | 19,346 | 2,781 | Indonesians in Japan | |
| 31,674 | 33,939 | Koreans in Japan | ||||||||
| 30,048 | 26,244 | 24,524 | 21,653 | 21,501 | 22,497 | 16,988 | 10,064 | 2,926 | Indians in Japan | |
| 20,716 | 13,152 | 10,741 | 8,427 | 9,303 | 9,097 | 9,013 | 5,655 | 1,064 | ||
| 20,346 | 13,737 | 10,252 | 8,045 | 8,692 | 8,577 | 5,342 | 4,851 | 894 | Burmese people in Japan | |
| 16,498 | 15,826 | 15,262 | 14,652 | 15,496 | 16,044 | 17,494 | 16,525 | 9,272 | Britons in Japan | |
| 14,312 | 12,708 | 11,802 | 10,597 | 10,849 | 10,299 | 8,789 | 7,498 | 1,875 | Pakistanis in Japan | |
| 13,033 | 10,835 | 9,641 | 8,622 | 9,413 | 10,175 | 11,015 | 7,176 | 2,205 | Bangladeshis in Japan | |
| 12,273 | 10,672 | 9,641 | 8,455 | 8,423 | 9,060 | 7,337 | 5,371 | 2,881 | French people in Japan | |
| 10,085 | 9,538 | 9,286 | 9,006 | 9,484 | 9,995 | 12,022 | 10,088 | 4,172 | ||
| 9,981 | 9,843 | 9,350 | 8,888 | 9,166 | 9,756 | 11,277 | 9,188 | 3,073 | Australians in Japan | |
| 9,598 | 6,111 | 4,090 | 2,862 | 2,770 | 2,683 | 2,263 | 1,761 | 1,148 | ||
| 9,394 | 8,738 | 8,288 | 7,848 | 8,136 | 8,364 | 7,910 | 8,386 | 4,309 | ||
| 8,500 | 8,092 | 7,859 | 7,295 | 7,566 | 7,814 | 7,110 | 4,893 | 340[80] | Russians in Japan | |
| 8,364 | 6,590 | 5,796 | 4,837 | 4,774 | 4,949 | 3,762 | 1,209 | 23 | Mongolians in Japan | |
| 6,755 | 6,336 | 5,864 | 5,223 | 5,303 | 5,971 | 5,356 | 4,295 | 3,410 | Germans in Japan | |
| 5,657 | 5,412 | 5,333 | 5,283 | 5,567 | 5,720 | 6,139 | 3,915 | 238 | ||
| 5,167 | 4,157 | 3,654 | 2,528 | 2,613 | 2,547 | 2,275 | 1,424 | 190 | Turks in Japan・Kurds in Japan | |
| 4,019 | 3,536 | 3,267 | 2,629 | 2,642 | 2,731 | 2,083 | 1,579 | 890 | ||
| 3,988 | 3,996 | 3,976 | 3,996 | 4,725 | 4,841 | 5,227 | 6,167 | 988 | Iranians in Japan | |
| 3,217 | 3,152 | 3,119 | 3,109 | 3,146 | 3,250 | 3,824 | 3,264 | 967 | ||
| 2,873 | 2,639 | 2,154 | 1,609 | 1,355 | 1,148 | 593 | 430 | Afghans in Japan | ||
| 2,852 | 2,495 | 2,309 | 1,822 | 1,883 | 1,907 | 1,585 | 1,338 | 827 | ||
| 2,845 | 2,638 | 2,518 | 2,377 | 2,730 | 2,729 | 2,389 | 1,741 | 140 | Nigerians in Japan | |
| 2,763 | 2,501 | 2,366 | 2,135 | 2,440 | 2,512 | 2,283 | 1,940 | 1,042 | ||
| 2,730 | 2,592 | 2,556 | 2,521 | 2,584 | 2,639 | 2,393 | 1,677 | 864 | ||
| 2,710 | 2,630 | 2,651 | 2,722 | 2,970 | 3,181 | 3,834 | 3,072 | 1,704 | ||
| 2,410 | 2,408 | 2,245 | 2,185 | 2,281 | 2,409 | 3,574 | 2,449 | 34 | Romanians in Japan | |
| 2,393 | 2,141 | 2,033 | 1,935 | 1,909 | 1,956 | 1,825 | 1,740 | 691 | ||
| 2,366 | 2,268 | 2,244 | 2,253 | 2,505 | 2,606 | 2,902 | 2,496 | 373 | ||
| 2,235 | 2,005 | 1,915 | 1,729 | 1,891 | 1,883 | 1,824 | 1,657 | 518 | Ghanaians in Japan | |
| Total Foreign Residents | 2,471,458 | 2,232,189 | 2,121,831 | 2,033,656 | 2,078,508 | 2,134,151 | 2,011,555 | 1,686,444 | 984,455 |
Foreign residents as of 2015
There was an increase of 110,358 foreign residents from 2014 to 2015. Vietnamese made the largest proportion of these new foreign residents, whilst Nepalese, Filipino, Chinese and Taiwanese are also significant in numbers. Together these countries makes up 91,126 or 82.6% of all new residents from 2014 to 2015. However, the majority of these immigrants will only remain in Japan for a maximum of five years, as many of them have entered the country in order to complete trainee programmes. Once they complete their programmes, they will be required to return to their home countries.[81]
As of December 2014 there were 2,121,831 foreigners residing in Japan, 677,019 of whom were long-term residents in Japan, according to national demographics figures. The majority of long-term residents were from Asia, totalling 478,953. Chinese made up the largest portion of them with 215,155, followed by Filipinos with 115,857, and Koreans with 65,711. Thai, Vietnamese, and Taiwanese long-term residents totaled 47,956, and those from other Asian countries totaled 34,274. The Korean figures do not include zainichi Koreans with tokubetsu eijusha ("special permanent resident") visas, of whom there were 354,503 (of a total of 358,409 of all nationalities with such visas). The total number of permanent residents had declined over the previous 5 years due to high cost of living.[77]
Foreign residents on short term employment contracts
A significant number of foreign residents of Japan are employed on a short term contractual basis under programs administered by the Japanese government. Well known programs include:
- The JET Programme employing up to 5,000 foreign university graduates as native language teachers in Japanese schools and as international support staff in local government offices.
- The Technical Intern Training Program employing in excess of 200,000 mainly manual laborers in variety of industries including construction, ship building, manufacturing, agriculture, retail and food processing.
In the light of current demographic trends Japan is likely to experience a decrease in tax revenue without a corresponding decrease in welfare expenses for an increasingly elderly population.[82] Given growing manpower shortages, immigrant workers continue to play an important role taking low skilled and manual labour jobs. A recent growth in blue collar employment using documented short term contractual labour from developing countries has also contributed to the rise in the resident foreign population.[83] The government administered Technical Intern Training Program, first established in 1993, provided over 190,000 short term contracted workers in 2015. However, it has been claimed that many of these workers often work at reduced pay and are required to undertake significant amounts of overtime in order to make up for labor shortages. As trainees, labor standards law and minimum wage legislation has on occasion been ignored by unscrupulous employers.[84] The Japanese government has begun to examine this problem and has sought to both strengthen the vocational training aspect of the work program oversight.
Koseki
Foreign residents were recorded only in an alien registration system separate from the koseki (family registry) and jūminhyō (resident registry) systems in which Japanese citizens were registered until a new registration system was enacted in July 2012. Since then, all residents are recorded by municipal offices in the jūminhyō system.[85] The koseki system continues for Japanese citizens, while foreigners are recorded in a separate residency management system administered by immigration offices which combines the previous immigration status and local alien registration systems.[86]
Foreigner-reporting website and hotline
The Japanese Ministry of Justice maintains a website and hotline for "receiving report on [sic] illegal stay foreigner." The criteria for reporting include "feeling anxious about a foreigner", and anonymous submissions are permitted. Japanese immigration authorities work in unison with police to investigate those reported, and human rights groups such as Amnesty International have argued that those reported do not receive proper legal protection.
The Daiyo Kangoku system allows police to detain suspects without charges, access to legal counsel or telephone calls for up to 23 days. In October 2006, the foreigner reporting hotline's operating hours were extended to include Saturday, Sunday and national holidays.
Fingerprinting foreigners when entering Japan
As of November 20, 2007, all foreigners entering Japan must be biometrically registered (photograph and fingerprints) on arrival; this includes people living in Japan on visas as well as permanent residents, but excludes people with special permanent resident permission, diplomats, and those under 16.[87][88]
- Immigration Control 2006, the Immigration Bureau, the Ministry of Justice (Japan), 2006.
- 平成19年版「出入国管理」の発刊について (Publication of Immigration Control 2007), 法務省入国管理局, 2007-9-21.
Religion
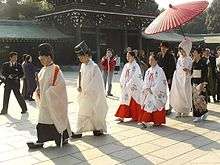
Shinto and Buddhism are Japan's two major religions. They have co-existed for more than a thousand years. However, most Japanese identify as either atheists, irreligious, or do not identify themselves as adherents of one religion, but rather incorporate various elements in a syncretic fashion.[89] There are small Christian and other minorities as well, with the Christian population dating to as early as the 1500s, as a result of European missionary work before sakoku was implemented from 1635–1853.
See also
- Ethnic issues in Japan
- Elderly people in Japan
- Japanese people
- Aging of Japan
- Suicide in Japan
- Shimojō, Nagano, a village whose birthrate is increasing
- Largest cities in Japan by population by decade
References
- ↑ 最新結果一覧 政府統計の総合窓口 GL08020101. Statistics Bureau of Japan. Retrieved April 27, 2016.
- ↑ Clyde Haberman (1987-01-15). "Japan's Zodiac: '66 was a very odd year". The New York Times. Retrieved 2015-10-21.
- ↑ "最新結果一覧 政府統計の総合窓口 GL08020101". www.e-stat.go.jp.
- ↑ See links to the Census and the monthly Population Estimate through the Japan Statistical Agency homepage.
- ↑ "Japan's population declines in 2015 for first time since 1920". Retrieved October 26, 2016.
- ↑ "The World Factbook — Central Intelligence Agency". Cia.gov. Retrieved 2017-04-17.
- ↑ Japan Statistical Agency monthly Population Estimate.
- ↑ "Population Statistics of Japan 2012". National Institute of Population and Social Security Research. January 2012. Retrieved 4 January 2015.
- ↑ "Japan population to shrink by one-third by 2060". BBC News. January 30, 2012.
- ↑ "Japan's Population Falls by Record in 2012 as Births Decrease". Bloomberg. Retrieved February 9, 2013.
- 1 2 "Japanese women have world's longest life expectancy at 86.41 years". Daily News. New York. 2013-07-25.
- ↑ "Japan's population falls by record 244,000 in 2013". January 2, 2014.
- ↑ Richard Smart. "Japan's population declines for first time since 1920s – official census | World news". The Guardian. Retrieved 2017-04-17.
- ↑ Krugman, Paul (2009). The Return of Depression Economics and the Crisis of 2008. W.W. Norton Company Limited. ISBN 978-0-393-07101-6.
- 1 2 "Forest area (% of land area)". The World Bank. Retrieved 2015-10-14.
- ↑ "公園の現況". Bureau of Construction Tokyo Metropolitan Government. Retrieved 2015-10-14.
- ↑ "Madrid Now". The Now Institute - Urban research, planning and speculations. Retrieved 2015-10-14.
- ↑ "地形分類" (PDF). Geospatial Information Authority of Japan. Retrieved 2015-10-14.
- ↑ "平成22年国勢調査最終報告書 人口の地域分布" (PDF). The Ministry of Internal Affairs and Communications Statistics Bureau. Retrieved 2015-10-14.
- ↑ "Japan - Places in the News | Library of Congress". www.loc.gov. Retrieved 2017-01-30.
- ↑ "Japan's demography: The incredible shrinking country". The Economist. 25 March 2014. Retrieved 14 January 2016.
- ↑ "Statistical Handbook of Japan". Ministry of Internal Affairs and Communication. 2015. Retrieved 14 January 2016.
- 1 2 3 4 "Statistics Bureau Home Page/JAPAN STATISTICAL YEARBOOK 2016 - Chapter 2 Population and Households". Stat.go.jp. Retrieved 2017-04-17.
- ↑ "Japan population to shrink by a third by 2060". The Guardian. 30 January 2014. Retrieved 14 January 2016.
- ↑ Hashimoto, Ryutaro (attributed). General Principles Concerning Measures for the Aging Society. Ministry of Foreign Affairs of Japan. Retrieved 2011-3-5.
- ↑ "Statistics Bureau Home Page/Population Estimates Monthly Report". Stat.go.jp. Retrieved 2017-04-17.
- ↑ "Changing Patterns of Nonmarital Childbearing in the United States". CDC/National Center for Health Statistics. May 13, 2009. Retrieved September 24, 2011.
- 1 2 Holtz, Carol (2012-05-30). Global Health Care. Jones & Bartlett Publishers. p. 46. ISBN 9780763799649.
- 1 2 3 4 "平成20年末現在における外国人登録者統計について(Number of Foreign residents in Japan)". Moj.go.jp. Retrieved 2011-11-09.
- ↑ B.R. Mitchell. International historical statistics: Africa. Asia & Oceania 1750–2000.
- ↑ "United Nations Statistics Division - Demographic and Social Statistics". Unstats.un.org. Retrieved 2017-04-17.
- ↑ Archived 2012-02-21 at the Wayback Machine.
- ↑ Max Roser (2014), "Fertility Rate", Our World In Data, Gapminder Foundation
- ↑ "Japan Today". Japan Today. Retrieved 2017-04-17.
- ↑ "Japan's birthrate drops to 1.03 million, number of deaths keep increasing". The Japan Daily Press. 2013-06-07. Retrieved 2017-04-17.
- ↑ "Archived copy" (PDF). Archived from the original (PDF) on 2012-04-20. Retrieved 2012-03-09.
- ↑ "Life expectancy". Our World in Data. Retrieved 2018-08-28.
- ↑ "World Population Prospects - Population Division - United Nations". Retrieved 2017-07-16.
- ↑ 総務省統計局. "統計局ホームページ/日本の統計 2018-第2章 人口・世帯". www.stat.go.jp (in Japanese). Retrieved 2018-06-15.
- ↑ "(Annual Report of Statistics on Japanese Nationals Overseas". Retrieved 8 April 2018.
- ↑ "Archived copy". Archived from the original on 2012-03-17. Retrieved 2014-06-17.
- 1 2 "平成23年末現在における外国人登録者統計について 法務省" [Statistics of Registered Foreigners in 2011] (in Japanese). Japan: Ministry of Justice. February 22, 2012.
- ↑ "Archived copy". Archived from the original on 2011-06-05. Retrieved 2014-06-17.
- ↑ "法務省". Moj.go.jp. Retrieved 2017-04-17.
- 1 2 John Lie, Multiethnic Japan (Cambridge, Mass.: Harvard University Press, 2001) ISBN 0-674-01358-1
- ↑ McCurry, Justin (2015-09-30). "Japan says it must look after its own before allowing in Syrian refugees". The Guardian. Retrieved 2015-12-26.
- ↑ Roberts, Marcus (2015-10-28). "Germany and Japan: on different immigration paths". MercatorNet. Retrieved 2015-12-26.
- ↑ "Japan's population slips for sixth consecutive year but foreign residents slowing the fall". The Japan Times. 2017-04-15. Retrieved 2018-10-07.
- ↑ "Embassy taps help of Pinoy groups in Japan". Japan. March 12, 2011.
- ↑ "Archived copy". Archived from the original on 2008-01-04. Retrieved 2007-11-29.
- ↑ "nation" (PDF). Worlddatabaseofhappiness.eur.nl. Retrieved 2017-04-17.
- ↑ "Countries Compared by Lifestyle > Life satisfaction. International Statistics at". Nationmaster.com. Retrieved 2017-04-17.
- ↑ "Archived copy". Archived from the original on 2007-12-06. Retrieved 2007-12-07.
- ↑ "Countries Compared by Lifestyle > Financial satisfaction. International Statistics at". Nationmaster.com. Retrieved 2017-04-17.
- ↑ Mental Health, WHO
- ↑ "Suicides cost Japan economy $32bn". 7 September 2010 – via www.bbc.co.uk.
- ↑ "Kyoto Ijin: Nadamoto Masahisa". Nancho.net. Retrieved 2017-04-17.
- ↑ The international handbook of the demography of race and ethnicity. Saenz, Rogelio,, Embrick, David G.,, Rodriguez, Néstor,. Dordrecht. ISBN 9789048188918. OCLC 910845577.
- ↑ Shinichiro, Takakura (1960). The Ainu of Northern Japan: A Study in Conquest and Acculturation. Independence Square: The American Philosophical Society. pp. 24–25.
- ↑ "About the film | Hafu". hafufilm.com. Retrieved 2016-09-14.
- ↑ "Being 'hafu' in Japan: Mixed-race people face ridicule, rejection". Retrieved 2017-05-01.
- ↑ Kosaka, Kristy (2009-01-27). "Half, bi or double? One family's trouble". Japan Times. Retrieved 2011-11-20.
- ↑ "Archived copy". Archived from the original on 2008-01-07. Retrieved 2008-01-19.
- 1 2 Morris-Suzuki, Tessa; Borderline Japan: foreigners and frontier controls in the post-war era; Cambridge 2010; ISBN 978-0-521-86460-2, Ch. 1: "Border Politics," Ch. 8: "A point of no return"
- ↑ https://www.japantimes.co.jp/news/2016/03/11/national/japan-sees-record-high-number-foreign-residents-justice-ministry/#.W0loCdIzbD4
- ↑ https://www.nippon.com/en/features/h00137/
- ↑ "衆議院会議録情報 第023回国会 法務委員会 第3号". Kokkai.ndl.go.jp. Retrieved 2017-04-17.
- ↑ Morris-Suzuki (2010), p. 230
- ↑ ""Koreans in Japan: Past and Present"". HAN. Retrieved 2017-04-17.
- ↑ Agreement signed in Calcutta, brokered by the ICRC. Morris-Suzuki (2010), p. 208
- ↑ detailed in: Morris-Suzuki, Tessa; Exodus to North Korea: shadows from Japan's cold war; Lanham, Md. 2006; ISBN 978-0-7425-5441-2
- ↑ Japan Statistics Bureau Archived December 25, 2007, at the Wayback Machine., accessed 8 December 2007
- ↑ Sugimoto, Yoshio (22 June 2010). "An Introduction to Japanese Society". Cambridge University Press – via Google Books.
- ↑ Yusuf, Shahid; Wu, Weiping; Evenett, Simon J. (16 September 2017). "Local Dynamics in an Era of Globalization: 21st Century Catalysts for Development". World Bank Publications – via Google Books.
- ↑ "在留外国人統計(旧登録外国人統計) 2017年6月 | ファイルから探す | 統計データを探す | 政府統計の総合窓口". www.e-stat.go.jp (in Japanese). Retrieved 2018-02-10.
- ↑ "統計表一覧 政府統計の総合窓口 GL08020103". E-stat.go.jp. Retrieved 2017-04-17.
- 1 2 "統計表一覧 政府統計の総合窓口" [General counter of statistical tables list government statistics] (in Japanese). 2015-04-24. Retrieved 2015-12-26.
- ↑ National Statistics Center. "統計表一覧 政府統計の総合窓口 GL08020103". E-stat.go.jp. Retrieved 2017-04-17.
- 1 2 3 excluding Taiwan
- ↑ Soviet Union
- ↑ "第1表 国籍・地域別 在留資格(在留目的)別 在留外国人". E-stat.go.jp. Retrieved 2017-04-17.
- ↑ "Implications of Japan's Changing Demographics". nbr.org. Retrieved 2016-01-19.
- ↑ "Japan's Resilient Demand for Foreign Workers". migrationpolicy.org. Retrieved 2016-01-19.
- ↑ "Japanese Immigration Policy: Responding to Conflicting Pressures". migrationpolicy.org. Retrieved 2016-01-19.
- ↑ "Start of new residency management system". March 2012.
- ↑ "To all foreign nationals residing in Japan Beginning on Monday, July 9, 2012, Start of a new residency management system!". www.immi-moj.go.jp. Archived from the original on 1 October 2017. Retrieved 11 October 2017.
- ↑ Chris Hogg Japan ups checks for foreigners, BBC News, 20 November 2007.
- ↑ The Immigration Bureau introduced new immigration procedures on November 20th, 2007., Immigration Bureau, Ministry of Justice (Japan).
- ↑ Edwin O. Reischauer The Japanese Today: Change and Continuity; Cambridge, Massachusetts: Belknap Press of Harvard University Press (1988), pg. 215.

- United Nations World Population Prospects (2004 revision). Data is for 2005.
External links
| Wikimedia Commons has media related to Demographics of Japan. |
- Japan Population Census 2010
- Expatriates in Japan
- The Dilemma Posed by Japan's Population Decline, discussion paper by Julian Chapple in the electronic journal of contemporary japanese studies, 18 October 2004.
- The Exodus to North Korea Museum (commemorates the story of the 93,340 people who migrated from Japan to North Korea in the period 1959-1984)
- Another Tsunami Warning: Caring for Japan’s Elderly, Brief on what the future of Japan looks like for an increasingly aging population, and if this demographic transition is limited to Japan alone.
- Morita, Kiriro and Saskia Sassen. "The New Illegal Immigration in Japan, 1980-1992." International Migration Review, Vol. 28, No. 1 (Spring, 1994), pp. 153–163
| History |
|  | |||||
|---|---|---|---|---|---|---|---|
| Geography | |||||||
| Politics |
| ||||||
| Economy | |||||||
| Society |
| ||||||
| |||||||
| Americas |  | |
|---|---|---|
| Asia | ||
| Europe | ||
| Africa | ||
| Oceania | ||
| See also | ||