Daxin County
| Daxin County 大新县 · Dasinh Yen | |
|---|---|
| County | |
 Daxin County bus terminal | |
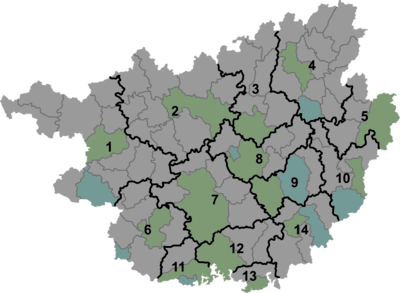 Daxin Location of the seat in Guangxi | |
| Coordinates: 22°50′10″N 107°11′59″E / 22.83611°N 107.19972°ECoordinates: 22°50′10″N 107°11′59″E / 22.83611°N 107.19972°E | |
| Country | People's Republic of China |
| Autonomous region | Guangxi |
| Prefecture-level city | Chongzuo |
| Area | |
| • Total | 2,742 km2 (1,059 sq mi) |
| Population (2010) | 359,800 |
| Time zone | UTC+8 (China Standard) |
| Website |
www |
Daxin County (simplified Chinese: 大新县; traditional Chinese: 大新縣; pinyin: Dàxīn Xiàn, Zhuang: Dasinh Yen) is a county in the west of Guangxi Zhuang Autonomous Region, China. It is under the administration of Chongzuo city.
The southwest border of Daxin County is along Cao Bằng Province, Vietnam. The legal description is mainly determined for a part of its length by the midline of the watercourse along the Guichun River and its Detian Falls.
Climate
| Climate data for Daxin (1981−2010) | |||||||||||||
|---|---|---|---|---|---|---|---|---|---|---|---|---|---|
| Month | Jan | Feb | Mar | Apr | May | Jun | Jul | Aug | Sep | Oct | Nov | Dec | Year |
| Record high °C (°F) | 29.7 (85.5) |
35.3 (95.5) |
35.6 (96.1) |
38.5 (101.3) |
39.0 (102.2) |
38.0 (100.4) |
37.9 (100.2) |
39.3 (102.7) |
37.2 (99) |
34.9 (94.8) |
32.4 (90.3) |
30.0 (86) |
39.3 (102.7) |
| Average high °C (°F) | 17.4 (63.3) |
18.9 (66) |
22.0 (71.6) |
27.1 (80.8) |
30.4 (86.7) |
32.0 (89.6) |
32.5 (90.5) |
32.6 (90.7) |
31.2 (88.2) |
28.3 (82.9) |
24.3 (75.7) |
20.1 (68.2) |
26.4 (79.5) |
| Daily mean °C (°F) | 13.3 (55.9) |
15.0 (59) |
18.1 (64.6) |
22.8 (73) |
25.7 (78.3) |
27.3 (81.1) |
27.7 (81.9) |
27.6 (81.7) |
26.0 (78.8) |
23.1 (73.6) |
18.8 (65.8) |
14.9 (58.8) |
21.7 (71) |
| Average low °C (°F) | 10.6 (51.1) |
12.5 (54.5) |
15.5 (59.9) |
19.8 (67.6) |
22.4 (72.3) |
24.2 (75.6) |
24.6 (76.3) |
24.4 (75.9) |
22.6 (72.7) |
19.6 (67.3) |
15.2 (59.4) |
11.3 (52.3) |
18.6 (65.4) |
| Record low °C (°F) | 0.8 (33.4) |
1.6 (34.9) |
2.6 (36.7) |
9.4 (48.9) |
13.3 (55.9) |
16.3 (61.3) |
19.5 (67.1) |
21.6 (70.9) |
15.7 (60.3) |
9.6 (49.3) |
3.9 (39) |
−0.3 (31.5) |
−0.3 (31.5) |
| Average precipitation mm (inches) | 36.2 (1.425) |
33.9 (1.335) |
57.0 (2.244) |
90.2 (3.551) |
159.7 (6.287) |
226.9 (8.933) |
246.8 (9.717) |
220.2 (8.669) |
120.5 (4.744) |
71.0 (2.795) |
47.1 (1.854) |
22.9 (0.902) |
1,332.4 (52.456) |
| Average relative humidity (%) | 76 | 78 | 79 | 78 | 78 | 81 | 81 | 81 | 79 | 76 | 75 | 73 | 78 |
| Source: China Meteorological Data Service Center | |||||||||||||
See also
This article is issued from
Wikipedia.
The text is licensed under Creative Commons - Attribution - Sharealike.
Additional terms may apply for the media files.