Climate of New Zealand

Köppen climate types of New Zealand

The climate of New Zealand is varied due to the country's diverse landscape. Most regions of New Zealand belong to the temperate zone with a maritime climate (Köppen climate classification: Cfb) characterised by four distinct seasons. The main factors are similar to those found in the British Isles owing to the Pacific Ocean and latitude, although the mountain ranges can cause significant climate variations in locations barely tens of kilometres from each other. Conditions vary from extremely wet on the West Coast of the South Island to almost semi-arid in Central Otago and subtropical in Northland.[1]

Weather

The Meteorological Service of New Zealand Limited (MetService), established as a State-Owned Enterprise in 1992, issues weather forecasts and official weather warnings.

Rainfall

Rainfall is generally plentiful in New Zealand, with most cities receiving between 620 mm or 24 in (as in Christchurch) and 1,317 mm or 51.9 in (Whangarei) of precipitation annually.[2] Rainfall is normally distributed evenly throughout the year in most parts of the country, especially in the South Island. Northern and eastern parts of the country, including Auckland, Christchurch and Wellington see a slight winter maximum consistent with a Mediterranean climate, although the difference between the wettest and driest months is too small to justify the designation. Summer and autumn maxima can be found in places closer to the southwest, such as Invercargill and Milford Sound.

How much rain a place receives is highly dependent on topography. The Southern Alps, the North Island Volcanic Plateau and surrounding ranges can produce large variation in rainfalls in places barely tens of kilometres apart. Milford Sound receives over 6,700 mm of the rainfall a year on average while barely 100 km away Alexandra in Central Otago receives only slightly greater than 300 mm annually, giving it a borderline oceanic/semi-arid climate.[3]

August 2011 winter's snowfall in Dunedin, Otago

Snowfall

Snow falls in New Zealand's South Island and at higher altitudes in the North Island. It is extremely rare at sea level in the North Island. It is also extremely rare in Auckland and Wellington with one snowfall each in 2011 after nearly 40 years where none occurred.[4] Snow is more common inland in both main islands, though snow to sea level does occur on average once or twice per year in the central and southern South Island.

Midland Line blanketed in heavy snow

Temperature

As with many islands in the world, the influence of the ocean curtails any extremes in coastal temperature. The greater temperature ranges are found in the interior of the Canterbury and Southland regions, and especially Central Otago. Central Otago and inland Canterbury's Mackenzie Basin have the closest New Zealand has to continental climates, being generally drier (due in part to föhn winds) and less directly modified by the ocean. These areas can experience summer temperatures in the low 30s °C (high 80s/low 90s °F) and snow and severe frosts in winter, the latter exacerbated by hoar frosts in the river valleys and basins.

Many parts of the country, especially in the upper North Island, have high humidity all year round, which can have the effect of it feeling warmer in summer and cooler in winter than the thermometer indicates.

Annual mean temperature

Mean annual temperatures range from 10 °C (50 °F) in the south to 16 °C (61 °F) in the north.[5] The coldest month is usually July and the warmest month is usually January or February. Generally there are relatively small variations between summer and winter temperatures. An example of this is Auckland which has a variation of just 9 °C or 16 °F between the average mid-winter high temperature (14.7 °C or 58.5 °F) and average mid-summer high temperature (23.7 °C or 74.7 °F). Temperature variation throughout the day is also relatively small. The exception to this is inland areas and to the east of the ranges with daily variations that can be over 25 °C and differences of up to 14 °C between the average summer and winter high temperatures. Temperatures also drop about 0.7 °C or 1.3 °F for every 100 m of altitude.

Northern cities such as Auckland, Whangarei, and Tauranga experience mean yearly maxima of between 19–20 °C (66–68 °F) and mean yearly minima of around 11–12 °C (52–54 °F). Eastern cities on the North Island such as Gisborne, Napier, and Hastings also have mean yearly maxima of between 19–20 °C (66–68 °F) but have slightly lower yearly mean minima of around 9–10 °C (48–50 °F). The two largest cities on the South Island, Christchurch and Dunedin, have mean yearly maxima of 17.3 °C (63.1 °F) and 14.6 °C (58.3 °F) and yearly mean minima of 7.3 °C (45.1 °F) and 7.6 °C (45.7 °F) respectively.

Summer

Daily maximum temperatures are normally in the mid to low 20s (°C) over most of the country. They are higher in northern, eastern and interior part of the country; Hastings is the warmest city on average with 25.5 °C followed by Gisborne with 24.9 °C and Napier with 24.5 °C. Eastern parts of the South Island are highly susceptible to the norwester, a Fohn wind which can result in temperatures going into the high 30s and even the low 40s. Rangiora in Canterbury holds the record maximum of 42.4 °C recorded in 1973, with Christchurch recording 41.6 °C in that same year. More recently, Timaru reached 41.3 °C on Waitangi Day in 2011. Due to these winds, the cooler southern cities of Dunedin and Invercargill have higher all-time record temperatures than places further north such as Wellington, Auckland and Whangarei.

Winter

Winter temperatures are much milder in New Zealand compared to other areas of similar latitude, with the exception of the Central Otago and Mackenzie Basin regions mentioned above. Maxima are generally 10–15 °C (50–59 °F) in the North Island, decreasing as one goes further south or inland. The South Island is a bit cooler, with maximum temperatures around 7–12 °C (45–54 °F), though sometimes lower. The lowest temperature ever recorded was −25.6 °C (−14.1 °F) at Ranfurly in Otago in 1903, with a more recent temperature of −21.6 °C (−6.9 °F) recorded in 1995 in nearby Ophir.[6]

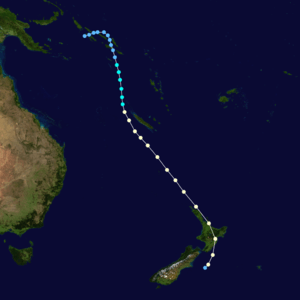
Track map of Cyclone Giselle

Severe weather events

July 1863 The blizzard and flood of 1863 was a series of consecutive natural disasters in Central Otago in New Zealand's South Island. From July to August 1863 the Otago gold fields suffered from a combination of floods, snowstorms, and blizzards that caused heavy loss of life among the gold miners. At least 40 died during the July rains and more than 11 in the August snows. Sources using the earliest reports of loss of life tend to greatly overstate the numbers who died.[7]

1–6 February 1868: The Great storm of 1868 was a violent storm that swept across much of New Zealand wrecking 12 ships and causing extensive flooding. About 40 lives were known lost and at the time an estimated £500,000 to £1 million worth of damage was caused. The storm is currently thought to have been an extratropical cyclone.

16 April 1897: The storm of 1897 was a severe storm that struck the lower to central North Island of New Zealand on 16 April 1897. It caused the ship Zuleika to run aground near Cape Palliser, with the loss of 12 lives, and severe flooding. At Clive the flooding caused the loss of a further 12 lives and one person was drowned near Kapiti. There were 6 further unconfirmed reports of drowning, bringing the total loss of life directly related to the storm event to between 25 and 31. Based on descriptions of the storm, particularly that of Captain Marten of the Waiapu, it may have been an extratropical cyclone.

2 February 1936: The Cyclone of 1936 was the worst storm of the 20th century in New Zealand.[8]

10 April 1968: Cyclone Giselle caused peak gusts of 145 knots (270 km/h) near Wellington, after colliding with an Antarctic storm moving north. Giselle led to the sinking of the interisland ferry TEV Wahine, and the loss of 53 lives. Total damage caused by the storm was estimated at $14 million.[9]

20 December 1976: Heavy rain caused widespread flooding and landslides in Wellington City and Hutt Valley. Hutt River burst its stopbanks and workers in Petone took refuge on factory roofs while rail links between Wellington city and the Hutt were suspended stranding thousands of commuters. Landslides destroyed houses and a boy was killed by a collapsing wall when a slip struck a hall in Crofton Downs. More than 350 mm of rain fell in 24 hours.[9]

6–10 March 1988: New Zealand is hit by a tropical cyclone once every eight to nine years. Cyclone Bola was one of the costliest cyclones in the history of New Zealand, causing severe damage as an extratropical cyclone when it passed near the country.

4 October 1997: More than 60 homes were flooded and residents in Lower Hutt riverside areas were evacuated during downpours. Two people died, and isolated landslips closed some Wellington roads and parts of State Highway 1.[9]

26 June 1998: A severe thunderstorm affected Karori and Kelburn, with rain breaking all previous records and falling at a rate with a return period of well over 200 years. Rainfall at Kelburn totalled 69.5 mm between 7.35pm and 9.10pm.[9]

13–27 October 1998: Gale force northwesterlies blew throughout the lower North Island. On 18 October, gusts of 183 km/h were recorded at Castlepoint. Winds were most severe on the following two days, when a gust of 215 km/h was recorded on a Wairarapa farm. A truck was overturned, ships ripped from their moorings in Wellington, and some houses lost their roofs.[9]

10 January 2002: Thunderstorms over Wellington resulted in torrential rainfall, about 40 mm in 30 minutes, and flash floods in the city centre. Similar storms, some with hail and surface flooding also happened in Whanganui, Manawatu, the central and eastern North Island, Buller and Nelson. The average recurrence interval of this rainfall event was estimated at more than 100 years.[9]

14–16 February 2004: The Valentine's Day storms left hundreds of people homeless, and silt and floodwaters inundated considerable areas of farmland. Many rivers breached their banks, bridges were damaged and stock was swept away by floodwaters. A civil state of emergency was declared in Whanganui, Manawatu and Rangitikei. About 500 Lower Hutt residents were evacuated because of floodwaters, and many commuters were unable to enter Wellington. The event produced galeforce southerlies, with gusts of 230 km/h in the Tararua Range, and swells of 11m in Cook Strait.[9]

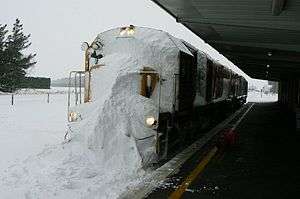
25 July and 14 August 2011 New Zealand snowstorms: The first severe winter storm brought the coldest winter snap in fifteen years. During August snow fell consistently down to sea level in Wellington for the first time since 1976,[10] and snowflakes even fell for a brief time in Auckland for the first time in 80 years.[10]

20–21 June 2013 New Zealand storm: This extra-tropical system was first felt in the South Island by heavy snowfall on 18 and 19 June. Late on 20 June, the storm pushed northeast to the North Island, bringing very strong winds until early 23 June. Schools were cancelled during the shortest day (21 June), due to massive damage.

Statistics

By area

Auckland
Climate chart (explanation)
JFMAMJJASOND
 
 
75
 
 
23
15
 
 
65
 
 
24
16
 
 
94
 
 
22
15
 
 
105
 
 
20
12
 
 
103
 
 
17
10
 
 
139
 
 
15
8
 
 
146
 
 
15
7
 
 
121
 
 
15
8
 
 
116
 
 
16
9
 
 
91
 
 
18
11
 
 
93
 
 
20
12
 
 
91
 
 
22
14
Average max. and min. temperatures in °C
Precipitation totals in mm
Hamilton
Climate chart (explanation)
JFMAMJJASOND
 
 
85
 
 
24
13
 
 
71
 
 
24
13
 
 
87
 
 
23
12
 
 
95
 
 
20
9
 
 
102
 
 
17
7
 
 
119
 
 
14
5
 
 
126
 
 
14
4
 
 
117
 
 
15
5
 
 
102
 
 
16
7
 
 
96
 
 
18
8
 
 
93
 
 
20
10
 
 
95
 
 
22
12
Average max. and min. temperatures in °C
Precipitation totals in mm
Taupo
Climate chart (explanation)
JFMAMJJASOND
 
 
85
 
 
23
12
 
 
77
 
 
23
12
 
 
83
 
 
21
10
 
 
74
 
 
18
7
 
 
87
 
 
14
5
 
 
99
 
 
12
3
 
 
105
 
 
11
2
 
 
109
 
 
12
3
 
 
90
 
 
14
5
 
 
102
 
 
17
7
 
 
85
 
 
19
8
 
 
108
 
 
21
10
Average max. and min. temperatures in °C
Precipitation totals in mm
Napier
Climate chart (explanation)
JFMAMJJASOND
 
 
48
 
 
24
15
 
 
62
 
 
24
15
 
 
85
 
 
23
13
 
 
75
 
 
20
10
 
 
62
 
 
17
7
 
 
81
 
 
15
5
 
 
92
 
 
14
5
 
 
67
 
 
15
5
 
 
65
 
 
17
7
 
 
55
 
 
19
9
 
 
57
 
 
21
11
 
 
56
 
 
23
13
Average max. and min. temperatures in °C
Precipitation totals in mm
Wellington
Climate chart (explanation)
JFMAMJJASOND
 
 
72
 
 
20
13
 
 
62
 
 
21
14
 
 
92
 
 
19
13
 
 
100
 
 
17
11
 
 
117
 
 
14
9
 
 
147
 
 
12
7
 
 
136
 
 
11
6
 
 
123
 
 
12
7
 
 
100
 
 
14
8
 
 
115
 
 
15
9
 
 
99
 
 
17
10
 
 
86
 
 
19
12
Average max. and min. temperatures in °C
Precipitation totals in mm
Nelson
Climate chart (explanation)
JFMAMJJASOND
 
 
72
 
 
22
13
 
 
57
 
 
22
13
 
 
78
 
 
21
11
 
 
86
 
 
18
8
 
 
77
 
 
15
5
 
 
85
 
 
13
2
 
 
86
 
 
12
2
 
 
90
 
 
13
3
 
 
73
 
 
15
5
 
 
92
 
 
17
8
 
 
82
 
 
19
10
 
 
75
 
 
21
12
Average max. and min. temperatures in °C
Precipitation totals in mm
Hokitika
Climate chart (explanation)
JFMAMJJASOND
 
 
250
 
 
19
12
 
 
172
 
 
20
12
 
 
217
 
 
19
11
 
 
249
 
 
17
8
 
 
245
 
 
14
6
 
 
233
 
 
12
4
 
 
232
 
 
12
3
 
 
224
 
 
13
4
 
 
250
 
 
14
6
 
 
286
 
 
15
7
 
 
240
 
 
17
9
 
 
278
 
 
18
11
Average max. and min. temperatures in °C
Precipitation totals in mm
Christchurch
Climate chart (explanation)
JFMAMJJASOND
 
 
42
 
 
23
12
 
 
39
 
 
22
12
 
 
54
 
 
20
11
 
 
54
 
 
18
8
 
 
56
 
 
15
5
 
 
66
 
 
12
2
 
 
79
 
 
11
2
 
 
69
 
 
12
3
 
 
47
 
 
15
5
 
 
53
 
 
17
7
 
 
44
 
 
19
9
 
 
49
 
 
21
11
Average max. and min. temperatures in °C
Precipitation totals in mm
Alexandra
Climate chart (explanation)
JFMAMJJASOND
 
 
29
 
 
24
11
 
 
22
 
 
24
11
 
 
40
 
 
22
9
 
 
34
 
 
18
5
 
 
35
 
 
12
2
 
 
26
 
 
8
−2
 
 
23
 
 
8
−2
 
 
24
 
 
11
0
 
 
27
 
 
15
3
 
 
41
 
 
18
6
 
 
26
 
 
20
8
 
 
43
 
 
22
10
Average max. and min. temperatures in °C
Precipitation totals in mm
Dunedin
Climate chart (explanation)
JFMAMJJASOND
 
 
73
 
 
19
11
 
 
59
 
 
19
11
 
 
70
 
 
18
10
 
 
62
 
 
15
8
 
 
67
 
 
13
6
 
 
68
 
 
10
4
 
 
61
 
 
10
3
 
 
55
 
 
11
4
 
 
48
 
 
13
6
 
 
64
 
 
15
7
 
 
67
 
 
16
9
 
 
76
 
 
18
10
Average max. and min. temperatures in °C
Precipitation totals in mm

[11]

LocationJanuary mean (°C)[12]July mean (°C)[12]Annual rainfall (mm)[13]
Kaitaia19.512.11351
Whangarei19.911.61304
Auckland19.110.91212
Tauranga19.410.21181
Hamilton18.48.91108
Rotorua17.77.81342
Gisborne19.29.7996
Taupo17.06.5960
New Plymouth17.89.51386
Napier19.59.4785
Wanganui18.39.5918
Palmerston North17.88.6917
Masterton18.17.6928
Wellington16.98.91207
Nelson17.87.2960
Blenheim18.07.0711
Westport16.38.72121
Kaikoura16.48.1710
Hokitika15.67.42901
Christchurch17.56.6618
Mount Cook14.72.24485
Lake Tekapo15.21.4592
Timaru15.95.0548
Milford Sound14.75.36715
Queenstown15.83.0749
Alexandra18.02.9359
Manapouri14.73.81129
Dunedin15.36.6738
Invercargill14.25.31149
Chatham Islands14.98.2911

Records

RecordMeasurementLocationDate
Highest temperature42.4 °C (108.3 °F)Rangiora, Canterbury7 February 1973
Lowest temperature−25.6 °C (−14.1 °F)Ranfurly, Otago17 July 1903
Highest rainfall in an hour134 mm (5.3 in)Cropp River, West Coast8 January 2004
Highest rainfall in 24 hours758 mm (29.8 in)Cropp River, West Coast27–28 December 1989
Highest rainfall in a calendar year16,617 mm (654.2 in)Cropp River, West Coast1998
Lowest rainfall in a calendar year212 mm (8.3 in)Alexandra, Otago1964
Highest wind gust250 km/h (160 mph)Mount John, Canterbury18 April 1970
Highest sunshine in a month356 hoursNew Plymouth, TaranakiJanuary 2015
Highest sunshine in a calendar year2840Richmond, Tasman2016
Lowest sunshine in a month27 hoursTaumarunuiJune 2002
Lowest sunshine in a calendar year1333 hoursInvercargill1983

Historical climate

Data collection for determining the New Zealand climate began in the late 19th century, although European explorers made valid observations of climate indicators such as glaciers and moraines early in that century. Scientific study of early New Zealand climate is quite recent and ongoing. It has settled some of the debate regarding links between the Little Ice Age (LIA) in the Northern Hemisphere and the climate in New Zealand at the same time. The key facts to emerge are that New Zealand did experience a noticeable cooler climate, but at a slightly later date than in the Northern Hemisphere.[14] The onset of cooler climate was about 1450 and lasted until 1850. Indications are that temperatures were in the range of 1.5-2.0 degree Celsius lower than present during the New Zealand LIA. Since 2000 various scientific investigations looked at the behaviour of glaciers in relation to climate and found they were excellent indicators of temperatures, especially in summer. Glacial evidence of climate is matched by evidence of variations in tree ring growth and studies of ice core and ocean sediment samples indicating the types of microorganisms (some flourish in warm temperatures, other in cooler temperatures) and historical carbon dioxide ratios.[14]

Evidence found that the climate was more strongly influenced by the impact of tropical air masses in warm periods and polar air masses in cool periods. Recent (2010) studies by Victoria University have shown that the regional climates most affected were in coastal Otago and Southland. The dominant temperature influence here was the relative warmth of the sea to the south of New Zealand during the Medieval Warm Period (MWP). From about 1350 this region was notably warmer but then cooled relatively quickly from 1450. This cooling may have had a substantial impact on population in those areas. The limited historical record suggests that from 1450 the population of New Zealand underwent significant cultural change which may have links to climate cooling and dramatic changes in food supplies.[14]

See also

References

  1. Walrond, Carl (March 2009). "Natural environment – Climate". Te Ara – the Encyclopedia of New Zealand. Retrieved 13 November 2016.
  2. Mean monthly rainfall, NIWA.
  3. "NIWA Climate Data". NIWA. Retrieved 24 July 2013.
  4. Chapman, Paul (15 August 2011). "'Once in a lifetime' snow storm hits New Zealand". Telegraph.co.uk. Wellington. Retrieved 14 November 2016.
  5. Mullan, Brett; Tait, Andrew; Thompson, Craig (March 2009). "Climate – New Zealand's climate". Te Ara – the Encyclopedia of New Zealand. Retrieved 14 November 2016.
  6. "NZ's temperature record hits new low - minus 25.6degC". The New Zealand Herald. 12 July 2011. Retrieved 12 July 2011.
  7. McLintock, A. H., ed. (22 April 2009) [originally published 1966]. "Blizzard and flood of 1863". An Encyclopaedia of New Zealand via Te Ara: the Encyclopedia of New Zealand.
  8. "Winds and storms: Looking back at the Wahine Storm". NIWA. Retrieved 23 June 2013.
  9. 1 2 3 4 5 6 7 Chug, Kiran (15 February 2011). "Seven biggest storms to hit Wellington". The Dominion Post. Retrieved 23 June 2013.
  10. 1 2 Felim McMahon (15 August 2011). "Kiwis marvel at Auckland and Wellington snow". Storyful. Retrieved 1 May 2013.
  11. "Climate Data". NIWA. Retrieved 5 February 2012.
  12. 1 2 "Mean monthly temperatures (°C) - NIWA". Retrieved 26 February 2017.
  13. "Mean monthly rainfall (mm) - NIWA". Retrieved 26 February 2017.
  14. 1 2 3 David Wratt; Jim Salinger; Rob Bell; Drew Lorrey & Brett Mullan. "Past climate variations over New Zealand". NIWA. Retrieved 5 June 2014.

Further reading

  • State of the Climate 2010: A snapshot of recent climate in New Zealand (PDF), NIWA Science & Technology Series No. 56, NIWA, 2010, ISSN 1173-0382
  • Insurance Council of New Zealand: Cost of Disaster Events in New Zealand
This article is issued from Wikipedia. The text is licensed under Creative Commons - Attribution - Sharealike. Additional terms may apply for the media files.