Climograph
A climograph is a graphical representation of basic climatic parameters, that is monthly average temperature and precipitation, at a certain location.[1] It is used for a quick-view of the climate of a location.
Representation
| Tucson, AZ | ||||||||||||||||||||||||||||||||||||||||||||||||||||||||||||
|---|---|---|---|---|---|---|---|---|---|---|---|---|---|---|---|---|---|---|---|---|---|---|---|---|---|---|---|---|---|---|---|---|---|---|---|---|---|---|---|---|---|---|---|---|---|---|---|---|---|---|---|---|---|---|---|---|---|---|---|---|
| Climate chart (explanation) | ||||||||||||||||||||||||||||||||||||||||||||||||||||||||||||
| ||||||||||||||||||||||||||||||||||||||||||||||||||||||||||||
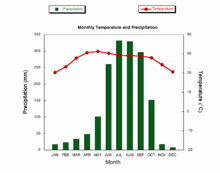
One form of representation uses an overlapped combination of a bar and line chart used to show the climate of a place over a 12-month period.
Another method and uses a common horizontal axis while different vertical axis. Here both the precipitation and temperature are shown in bar charts. This method has an advantage that the range of temperature (average of minimum and maximum temperatures) can be shown, rather than just the average temperature.
Climographs display temperatures in a clear and concise manner, however they may be misinterpreted when used in inappropriate situations. For this reason, it is important that they are utilized in a reasonable situation. This kind of graph is usually used in social studies.
References
External links
- "How to make a Climograph" (PDF). Archived from the original (PDF) on 2011-07-24.
- https://climatecharts.net/ - Webapplication for generating climographs for places worldwide dynamically.