Ishikawa diagram
| Ishikawa diagram | |
|---|---|
 | |
| One of the Seven Basic Tools of Quality | |
| First described by | Kaoru Ishikawa |
| Purpose | To break down (in successive layers of detail) root causes that potentially contribute to a particular effect |
Ishikawa diagrams (also called fishbone diagrams, herringbone diagrams, cause-and-effect diagrams, or Fishikawa) are causal diagrams created by Kaoru Ishikawa that show the causes of a specific event.[1]
Common uses of the Ishikawa diagram are product design and quality defect prevention to identify potential factors causing an overall effect. Each cause or reason for imperfection is a source of variation. Causes are usually grouped into major categories to identify and classify these sources of variation.
Overview
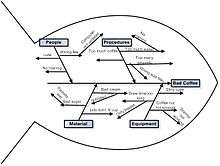
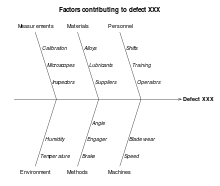
The defect is shown as the fish's head, facing to the right, with the causes extending to the left as fishbones; the ribs branch off the backbone for major causes, with sub-branches for root-causes, to as many levels as required.[2]
Ishikawa diagrams were popularized in the 1960s by Kaoru Ishikawa,[3] who pioneered quality management processes in the Kawasaki shipyards, and in the process became one of the founding fathers of modern management.
The basic concept was first used in the 1920s, and is considered one of the seven basic tools of quality control.[4] It is known as a fishbone diagram because of its shape, similar to the side view of a fish skeleton.
Mazda Motors famously used an Ishikawa diagram in the development of the Miata (MX5) sports car.[5]
Root causes
Root-cause analysis is intended to reveal key relationships among various variables, and the possible causes provide additional insight into process behavior.
The causes emerge by analysis, often through brainstorming sessions, and are grouped into categories on the main branches off the fishbone. To help structure the approach, the categories are often selected from one of the common models shown below, but may emerge as something unique to the application in a specific case.
Each potential cause is traced back to find the root cause, often using the 5 Whys technique.
Typical categories include:
The 5 Ms (used in manufacturing)
Originating with lean manufacturing and the Toyota Production System, the 5 Ms is one of the most common frameworks for root-cause analysis:[6]
- Machine (equipment, technology)
- Method (process)
- Material (includes raw material, consumables, and information)
- Man / mind power (physical or knowledge work, includes: kaizens, suggestions)
- Measurement / medium (inspection, environment)
These have been expanded by some to include an additional three, and are referred to as the 8 Ms:[7]
- Mission / mother nature (purpose, environment)
- Management / money power (leadership)
- Maintenance
The 8 Ps (used in product marketing)
This common model for identifying crucial attributes for planning in product marketing is often also used in root-cause analysis as categories for the Ishikawa diagram:[7]
- Product (or service)
- Price
- Promotion
- Place
- Process
- People (personnel)
- Physical evidence
- Performance
The 8 Ps are primarily used in product marketing.
The 4 Ss (used in service industries)
An alternative used for service industries, uses four categories of possible cause:[8]
- Surroundings
- Suppliers
- Systems
- Skill
Fishbone Diagram in Lean
A recurring theme in a lean or six-sigma transformation is removing the clutter to allow you to see waste or opportunities for improvement. A fishbone diagram aims to break down and organise the Causes of an issue to reveal what elements have the greatest impact. Grouping the “causes” means you can think about the different elements of the problem as separate from the overall process. One or two of these “causes” will have a greater effect than the others and will guide you to the root of the problem. This structure also allows you to tackle smaller chunks which have a large impact on the problem. Looking at elements of the problem and not the whole process will likely make finding your solution less daunting and problem solving more manageable.
After you have determined your root cause, prioritise or screen the causes to determine which are having the largest effect. Once identified focus on these. An easy Cause screening method involves looking at each one and asking two questions:
How likely is this cause to be the major source of the issue or variation?
- V - Very Likely
- S - Somewhat Likely
- N - Not Likely
How easy would it be to fix or control?
- V - Very Easy
- S - Somewhat Easy
- N - Not Easy
Put the answers of the two questions together. Work on the Causes that have a result of VV, VS, and SV.[9]
See also
References
- ↑ Ishikawa, Kaoru (1968). Guide to Quality Control. Tokyo: JUSE.
- ↑ Ishikawa, Kaoru (1976). Guide to Quality Control. Asian Productivity Organization. ISBN 92-833-1036-5.
- ↑ Hankins, Judy (2001). Infusion Therapy in Clinical Practice. p. 42.
- ↑ Tague, Nancy R. (2004). "Seven Basic Quality Tools". The Quality Toolbox. Milwaukee, Wisconsin: American Society for Quality. p. 15. Retrieved 2010-02-05.
- ↑ Frey, Daniel D.; 1943-, Fukuda, S. (Shūichi),; Georg., Rock, (2011). Improving complex systems today : proceedings of the 18th ISPE International Conference on Concurrent Engineering. Springer-Verlag London Ltd. ISBN 0857297996. OCLC 769756418.
- ↑ Weeden, Marcia M. (1952). Failure mode and effects analysis (FMEAs) for small business owners and non-engineers : determining and preventing what can go wrong. ISBN 0873899180. OCLC 921141300.
- 1 2 Bradley, Edgar. Reliability engineering : a life cycle approach. ISBN 1498765378. OCLC 963184495.
- ↑ Dudbridge, Michael (2011). Handbook of Lean Manufacturing in the Food Industry. John Wiley & Sons. ISBN 1444393111. OCLC 904826764.
- ↑ "Fishbone Diagram – How to Make and Use a Fishbone Diagram". www.lbspartners.ie. LBSPartners. Retrieved 17 August 2017.
Further reading
- Ishikawa, Kaoru (1990); (Translator: J. H. Loftus); Introduction to Quality Control; 448 p; ISBN 4-906224-61-X OCLC 61341428
- Dale, Barrie G. et al. (2007); Managing Quality 5th ed; ISBN 978-1-4051-4279-3 OCLC 288977828
| Wikimedia Commons has media related to Ishikawa diagrams. |