California housing shortage
Since about 1970, California has been experiencing an extended and increasing housing shortage,[1]:3 such that by 2018, California has the 49th lowest ratio of housing units per resident.[2]:1 [3] The shortage has been estimated at 3-4 million housing units (20% - 30% of California's current housing stock, 14 million[4] as of 2017).[5]
The cause is the imbalance between supply and demand;[6]:1 [2]:1 [1]:3 [7]:1 a result of strong economic growth creating hundreds of thousands of new jobs (which increases demand for housing) and the insufficient construction of new housing units to provide enough supply to meet the demand.[8][9][1]:14,17 [10] For example, from 2012 to 2017, San Francisco Bay area cities added 400,000 new jobs, but only issued 60,000 permits for new housing units.[11] (For California as a whole, from 2011 to 2016, the state added only one new housing unit for every five new residents.)[12]
This shortage has driven home prices and rents to extremely high levels. In 2017, the median price of a home in California was more than 2.5 times the median in the U.S. as a whole, and in California's coastal urban areas, the shortage was greater than the inland areas, as demonstrated by the median prices of homes in those respective markets: $1.3M in San Francisco, $1M in San Jose, and $600k in Los Angeles, while only $250k in Fresno.[13][14][15] In the rental market, California now has the lowest vacancy rate the state has ever seen, at 3.6%;[16] and while the median rent throughout the state for a two-bedroom apartment is $2,400, the median rent in coastal urban areas is even higher, surpassing $4,000 per month in San Francisco.[17]:1
The shortage is taking its toll on Californians in multiple ways: less than a third can afford a median priced home (whereas nationally, slightly more than half can), more than 20% of residents are in poverty (6% more than would be with lower housing costs), homelessness per capita is now the third highest in the nation, California's economy is suppressed by $150 - $400 billion annually (5-14%) (because money that residents must spend on housing cannot be spent elsewhere), and the displacement and suburban sprawl caused by high housing costs in the urban centers (where jobs are located) has resulted in several of California's cities being home to the largest share of super commuters in the nation, as well as hindering California's ability to meet it's CO2 emissions goals.[18]
Background
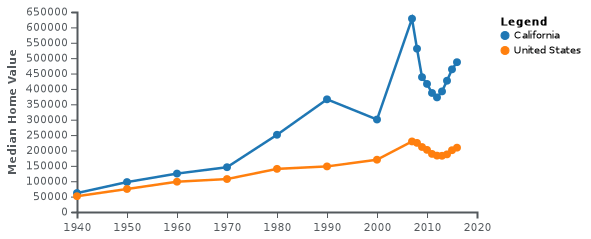
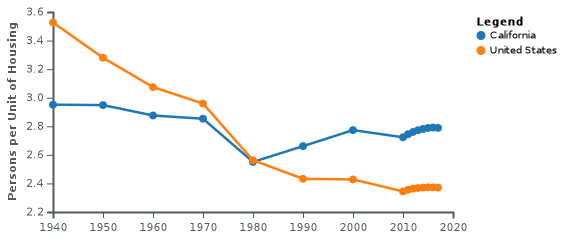
From 1940 to 1970, California's population grew far more quickly than the national average, while its median home value stayed very close to the national average because new homes were being built quickly enough to house the new arrivals. But starting in 1970, three major forces caused housing prices to rise dramatically: more powerful environmentalism (which led to greater land-use restrictions), density restrictions (which limited many places to single-family homes or no more than two stories), and community involvement in the development process (which allowed current but not future residents a say in who could live there).[25][1]:3,5
By 2016, the median price of a home in California, at $409,300, was more than twice the median price of a home in the U.S. as a whole, more expensive than any state other than Hawaii.[26] The shortage is state-wide--from 2010 to 2017, the state added only one new housing unit for roughly every five new residents--but is especially acute in employment centers such as the Bay Area and Los Angeles.[12]
Causes
The shortage has resulted from fewer housing units built in the urban and coastal areas relative to the demand created by economic growth in those areas, resulting in higher prices for housing and spillover to the inland areas.[1]:3
For example, from 2012 to 2017, San Francisco Bay area cities added 400,000 new jobs, but only issued 60,000 permits for new housing units.[11] (For California as a whole, from 2011 to 2016, the state added only 2 new housing units for every 10 new residents.)[12]
Demand is driven from domestic and foreign (global) sources. In major cities like San Francisco, real estate investors may be local, regional, or may represent the global marketplace and purchase real estate for personal or investment purposes in order to capitalize on the city's geographic location and strong technology economy. Illegal immigration also plays a significant role in escalating housing demand. The Pew Research Center reports that as of 2014, 2.35 and 2.6M illegal immigrants reside in California, [27] and the Los Angeles Times reports that one in ten workers is an illegal immigrant to the United States [28]. In communities such as Napa Valley, where immigrant labor is required for cost-effective agricultural production, this can have a severe impact on local low and mid-range rental housing markets; the Napa Register reported in August 2018 the area has a rental vacancy rate of 1%.[29]
Community resistance (NIMBYism)
NIMBY ("Not In My Back Yard") resistance by existing residents to new development is a major contributor to the difficulty of developing new housing in the state. People who already live in an area often perceive any new development or change as driving increased negative traffic and population impacts. Using various means (political pressure, protests, and voting power), NIMBYs to try to keep newcomers out by defeating development projects in the local government permitting process, or slowing them down to the point that they become uneconomical for the builders.[1]:15 [30]
Environmental laws
Environmental laws—primarily the California Environmental Quality Act (CEQA)—can be a hurdle to housing development. CEQA requires the permitting agency, usually a local government, to review each new project in accordance with CEQA (be it a small duplex or 600-unit apartment complex) to provide a full disclosure of the project's impacts to the approval body (usually a planning commission or city council) and the public. Individual single-family homes are exempt, as well as some smaller multi-family projects, but most mid-size and larger projects must go through a Negative Declaration or EIR to provide the required level of disclosure of project impacts. The CEQA process must take place prior to a local government acting to permit a new development. Additionally, CEQA opens the door for legal challenges against the CEQA review process itself that was carried out for the project, which may result in lawsuits by those opposed to a project even after a local government has approved the project.[1]:15 As the Orange County Register notes: "CEQA requires all development projects to complete environmental impact reports (intended to explore the development’s effect on local plants and animals) prior to final project approval by city hall. A clean report, however, can be challenged in a lawsuit by anyone concerned, which immediately halts development. Labor unions and other advocacy organizations discovered that they could use frivolous CEQA challenges to “greenmail” businesses and further their own policy agendas."[31][32]:1
Tax structures
Partially because Proposition 13 limits the property tax that local and state governments can collect, cities are incentivized to permit commercial development rather than residential development. Commercial development can potentially yield both sales tax revenue (car dealerships and shopping malls are especially favored due to their density of revenue), as well as business tax revenue (many cities levy either a payroll tax or a gross-receipts tax on all businesses located within their boundaries: for example, San Francisco levys a 1.5% payroll tax but is shifting to a ~0.5% gross-receipts tax).
Residential development is typically seen as a net loss to a city's budget due to costs associated with service delivery (public safety, roads, parks, etc.) to residents exceeding the tax revenue received from those residents.[1]:15 For example, the city of Brisbane, when considering developing a greenfield, (Brisbane Baylands development) was told that a housing-heavy development would bring in $1 million annually in additional income for the town, but a commercial development with no housing and a larger hotel would bring in $9 million annually--and that without building hotels, the development would be a net loss to the city budget.[33][34]
High land cost and low density
High land cost and low-density development with very small increases in housing density, which in turn keep land prices high.[1]:12 The Sacramento Bee notes that residential land prices are more than 600% greater in coastal California than the average of America's other large metropolitan areas.[35]
Construction costs
The higher cost of construction due to government fees, labor, and materials:
- Greater government-imposed development fees for building a single-family home than in the rest of the country. (The California Legislative Analyst's Office reported it to be 266% greater, $22k vs. $6k).[1]:14 For example, the developer planning to redevelop the site of a former Naval Hospital in Oakland with a residential community of 935 homes will be paying $20M (= $21k / home) in fees to the City of Oakland's affordable housing fund.[36]
- Higher cost of labor, because of both prevailing wage laws and that often projects are only approved if union labor is used. (Estimated at 20% more by the California LAO.)[1]:13[31][37]
- Higher material costs, due to building codes and standards requiring better quality materials and higher energy efficiency.[1]:13
Demand factors
The supply-demand dynamic with respect to California housing prices was partly addressed by Bloomberg in February 2017 in an article titled "Why Trump's Immigration Crackdown Could Sink U.S. Home Prices", which states that illegal immigrants "and workers with green cards and work visas under the H1-B program for skilled foreign workers" are concerned about the recent focus on law enforcement and other foreign worker restrictions. The article states that "The housing markets most at risk include... Silicon Valley, Los Angeles, [and] San Francisco... which have the biggest concentrations of foreign-born buyers", all of which are California economic hubs and political enclaves.[38]
Effects
Affordability
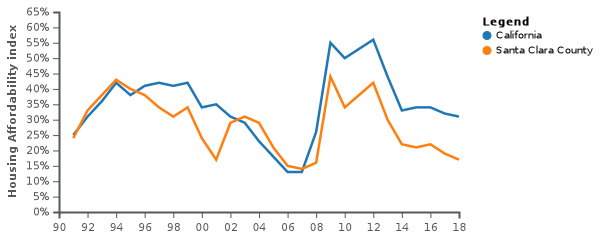
Housing affordability has declined over the last three decades; as of 2018, less than a third of Californians could afford a median-priced home; in job centers such as the San Francisco Bay Area, that number is less than a quarter. (Nationally, more than half of American households can afford the median-priced American home.)[39]
Displacement and Environmental impact
As a result, workers have moved to more affordable inland locations which force longer commutes. As of 2018, the three cities in the United States with the largest share of super commuters--workers spending an hour and a half or more each way to get to and from their jobs--are Stockton, Modesto and Riverside.[40][41]:1 Workers have been displaced outside of the state as well; from 2007 to 2016, California saw net out-migration among all groups making under $110,000 a year, largely to Sun Belt states like Arizona, Nevada and Texas.[42]
Longer commutes and worse traffic caused by suburban sprawl due to housing shortages concentrated in job centers increase greenhouse gas emissions. Because of California's mild climate and heavily-renewable energy mix, transportation is the largest category of emissions in the state.[43] When Californians emigrate to states with higher per-capita greenhouse gas emissions, they drive more, consume more energy for air conditioning, and use more fossil fuel-dependent electricity generation. Scarce, low-density housing is directly at odds with California's stated climate goals.[44]:1
Poverty
When the cost of housing is factored into the poverty rate, as the Census Bureau now does in its releases of the "Supplemental Poverty Measure,"[45] California's poverty rate lists as the highest in the nation, (and has since 2011, when the Census Bureau first started releasing poverty by this measure) currently at 20.4%, or just over 1 in 5 people.[46]:1 [47] The Public Policy Institute of California estimates that if the housing costs in California matched those for the nation overall, California's poverty rate would instead be 14%.[46]:1
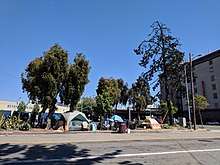
Homelessness
.jpg)
California in 2017 is home to an over-sized share of the nation's homeless: 22%, for a state whose residents only make up 12% of the country's total population.[48] The Sacramento Bee notes that large cities like Los Angeles and San Francisco both attribute their increases in homeless to the housing shortage.[48] Homeless persons in California now number 135,000 (a 15% increase from 2015).[16]
A study by the California Housing Partnership found that from 2016-2017 homelessness increased by 47% in Sacramento County (home to the state's capital, Sacramento), 36% in Alameda County, and 13% in Santa Clara County.[12]
Nationwide, California ranks third for the most homeless persons per capita, behind New York and Hawaii.[49][50]
Economy
A 2017 study[51] by Nobel Laureate in economics Edward Prescott, Lee Ohanian (senior fellow at the Hoover Institution), and Kyle Herkenhoff, estimates that if California were to roll back its land use regulations to where they stood in 1980, the state's GDP could permanently increase by almost $400 billion (a 14% increase).[9] "If every state rolled back land regulations to 1980 levels, [total US] GDP could rise by as much as $1.8 trillion [9%]." [9][52]:1
A McKinsey Global Institute report estimates that the housing shortage is costing the California economy between 143 and 233 billion dollars per year, because money people spend on housing cannot be spent on other consumer goods, and that new construction activity would also increase economic output.[53] [17]:1
Quantifying the shortage
Estimated under-supply of housing units
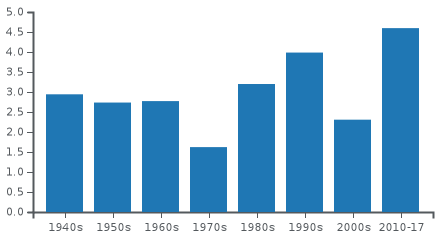
The California Legislative Analyst's Office 2015 report "California's High Housing Costs - Causes and Consequences" estimates that for the state to have kept housing prices no more than 80% higher than the median for the U.S. as a whole (the price differential which existed in 1980, as opposed to the >150% differential which exists today), California would have needed to add approximately 210,000 new housing units each year over the past three decades (1980-2010), rather than the 120,000 / year which were built. Their midpoint estimate of the underbuilding for the last three decades is 90,000 units per year, an estimated shortage of 2.7 million housing units (20%) by 2010.[1]:21
Since 2010, the state's construction of new housing units has averaged well below 90,000 units per year.[54] It took a drastic drop after the 2008 Great Recession, but has increased to about 90,000 / year in 2016.[54]
In September of 2017, a team of economists from UCLA forecast that "it would take 20 percent more housing to achieve a 10 percent reduction in prices. Such a reduction throughout California would bring costs down roughly to 2014 levels..."[55]
In October 2017, lieutenant governor and gubernatorial candidate Gavin Newsom said that California should set a goal to produce 3.5 million new homes by 2025. This would require a quadrupling of the current rate of building to almost 400,000 units per year, a rate the state has not experienced since 1954.[56]
In April of 2018, state Senator Scott Wiener, author of several bills to reduce the housing shortage, estimated it at 4 million units.[57]
Ratio of residents and jobs to housing units
In 2018, California has the 49th lowest ratio of housing units per resident.[2]:1 [3]

While some people claim that a "healthy" ratio of jobs to housing units is around 2, many California metros are far from that, with San Diego at 3.9, Los Angeles at 4.7, and San Francisco at 6.8.[7]:1
Responses
Whitehouse "Housing Development Toolkit" recommendations
In a September 2016 report from the Executive Office of the President of the United States titled "Housing Development Toolkit",[60]:2 [61]:1 [62]:1 [63]:1 [64]:1 [52]:1 the authors cited several of California state and localities' attempted legislative fixes for the housing shortage as models that it recommends other states and localities also follow to abate their housing shortages,[60]:12 including:
- establish by-right development,[60]:14
- tax vacant land or donate it to non-profit developers,[60]:15
- streamline or shorten permitting processes and timelines,[60]:16
- eliminate off-street parking requirements,[60]:17
- allow accessory dwelling units,[60]:17 and
- establish density bonuses.[60]:18
The report also highlighted one of President Obama's remarks to the U.S. Conference of Mayors on January 21, 2016:
| “ | We can work together to break down rules that stand in the way of building new housing and that keep families from moving to growing, dynamic cities. | ” |
2016 legislation
In September 2016, Governor Jerry Brown signed AB 2406, AB 2299, and SB 1069, all of which reduce the cost and bureaucracy needed to construct an ADU (Accessory Dwelling Unit), also known as a granny flat, or in-laws unit.[65][66] The Bay Area Council notes that if only 10 percent of the Bay Area’s 1.5 million single family homeowners build ADU's, that would create 150,000 units of new housing.[66]
2017 legislation
On the final day of the 2017 legislative session, the California legislature approved and Governor Brown signed fifteen separate bills aimed at starting to address some of the driving factors of the shortage, such as requiring cities to allow developments that meet their zoning and general plans, and allowing microapartments as small as 150 sq. ft.[67][68][69]
One of those bills was SB 35, authored by state Senator Scott Wiener which will require the cities that have fallen behind on their state housing production goals to streamline approval of new housing.[70][71] Wiener said, "Local control is about how a community achieves its housing goals, not whether it achieves those goals... SB 35 sets clear and reasonable standards to ensure that all communities are part of the solution by creating housing for our growing population."[70]
2018 legislative session
Senate Bill 827, introduced in the 2018 legislative session by Scott Wiener, would require localities to allow buildings of at least 4 or 8 stories within a half-mile of a high-frequency transit stop, or within a quarter-mile of a bus or transit corridor, as well as waiving minimum parking requirements in those areas.[2]:1 Regarding the issue of local control, he stated: "In education and healthcare, the state sets basic standards, and local control exists within those standards. Only in housing has the state abdicated its role. But housing is a statewide issue, and the approach of pure local control has driven us into the ditch."[72]
Other efforts
Since 2014, several YIMBY (Yes In My Back Yard) groups have sprung up in the San Francisco Bay Area, including the San Francisco Bay Area Renters' Federation, headed by Sonja Trauss, as well as YIMBY Action, East Bay for Everyone, Palo Alto Forward, Catalyze SV, and CaRLA.[73][74] These groups lobby both locally and in Sacramento for increased housing production at all price levels, as well as using California's Housing Accountability Act ("the anti-NIMBY law") to sue cities when they attempt to block, restrict, or down-size housing development.[73] Ms. Trauss, in a comment to the San Francisco Planning Commission supporting the construction of a new 75-unit mostly market rate housing development stated that: "The 100 or so higher income people, who are not going to live in this project if it isn’t built, are going to live somewhere,” she said. “They will just displace someone somewhere else, because demand doesn’t disappear.”[75]
As a way to rapidly create inexpensive housing, a Bay-Area startup company converts 8' x 20' shipping containers into homes for as little as $8,000, though due to expensive ($3,000 - $5,000 for a permit) and restrictive zoning in many cities, has found it hard to find locations that will allow the homes.[76]
Currently, the federal government has a voucher system known as the “Section 8” program where the residents pay 30% of their salary and the Housing Authority pays the difference of the rental cost (Metcalf, 2018).[77] As indicated by Metcalf, “In 2015, 2.2 million households, comprising 5 million people, used rental vouchers to secure housing in the private market.[77]
See also
References
- 1 2 3 4 5 6 7 8 9 10 11 12 13 Taylor, Mac (2015-03-17). California's High Housing Costs - Causes and Consequences (PDF) (Report). California Legislative Analysts Office. Archived (PDF) from the original on 2015-04-06. Retrieved 2017-10-26.
- 1 2 3 4 Roberts, David (2018-02-23). "A sweeping new bill targets California's housing crisis". Vox Media. Archived from the original on 2018-03-01. Retrieved 2018-03-01.
- 1 2 "A TOOL KIT TO CLOSE CALIFORNIA'S HOUSING GAP". McKinsey Global Institute. 2016-10-01. Archived from the original on 2016-11-05. Retrieved 2018-03-01.
California ranks 49th among the 50 US states for housing units per capita.
- ↑ Annual Estimates of Housing Units for the United States, Regions, Divisions, States, and Counties: April 1, 2010 to July 1, 2017 (Report). United States Census Bureau. 2017-07-01. Retrieved 2018-09-20.
- ↑ See the section on Quantifying_the_shortage for a more thorough discussion of the multiple estimates with all sources cited.
- ↑ Levin, Matt (2018-05-04). "5 Reasons California's Housing Costs Are So High". KQED. Archived from the original on 2018-05-05. Retrieved 2018-09-24.
- 1 2 Schneider, Benjamin (2018-03-05). "In California, Momentum Builds for Radical Action on Housing". Citylab - The Atlantic. Archived from the original on 2018-05-03. Retrieved 2018-05-25.
- ↑ Cutler, Kim-Mai (Apr 14, 2014). "How Burrowing Owls Lead To Vomiting Anarchists (Or SF's Housing Crisis Explained)". TechCrunch. Archived from the original on 2014-04-30. Retrieved 2017-12-11.
...in most parts of the country, home prices are at or near the raw costs of construction. But in places where zoning regulations create artificial limits on home production, the final prices to home buyers jump far above construction costs. In the 1980s and 1990s, they found that virtually all of San Francisco’s home prices were at least 140 percent above base construction costs.
- 1 2 3 Ohanian, Lee; Prescott, Edward (2017-12-01). "What in the Sam Hill Are Cows Doing on Sand Hill Road? They're eating the priciest grass in America, thanks to California's out-of-control land-use rules". The Wall Street Journal. Archived from the original on 2018-01-06. Retrieved 2018-05-23.
If California rolled back its land rules to where they stood in 1980, our research estimates that the state’s population could ultimately grow to 18% of the country. U.S. gross domestic product could permanently increase by about 2%, or $375 billion. If every state rolled back land regulations to 1980 levels, GDP could rise by as much as $1.8 trillion.
Note: This article is behind a paywall. - ↑ Nagourney, Adam; Dougherty, Conor (2017-07-17). "The Cost of a Hot Economy in California: A Severe Housing Crisis". The New York Times Company. Archived from the original on 2017-08-11. Retrieved 2017-11-02.
For California, this crisis is a price of this state’s economic boom. Tax revenue is up and unemployment is down. But the churning economy has run up against 30 years of resistance to the kind of development experts say is urgently needed. California has always been a desirable place to live and over the decades has gone through periodic spasms of high housing costs, but officials say the combination of a booming economy and the lack of construction of homes and apartments have combined to make this the worst housing crisis here in memory.
- 1 2 Clark, Patrick (2017-06-23). "Why Can't They Build More Homes Where the Jobs Are?". Bloomberg. Archived from the original on 2017-08-28. Retrieved 2017-12-01.
San Francisco's metropolitan area added 373,000 net new jobs in the last five years—but issued permits for only 58,000 units of new housing. The lack of new construction has exacerbated housing costs in the Bay Area, making the San Francisco metro among the cruelest markets in the U.S. Over the same period, Houston added 346,000 jobs and permitted 260,000 new dwellings, five times as many units per new job as San Francisco.
- 1 2 3 4 Chronicle Editorial Board (2018-05-11). "Editorial: The Bay Area's housing crisis has become an emergency". The San Francisco Chronicle. Archived from the original on 2018-05-15. Retrieved 2018-05-15.
- ↑ Scheinin, Richard (2017-11-16). "As housing supply shrinks, San Francisco, San Jose and Oakland are nation's three most competitive markets". Bay Area News Group. Archived from the original on 2017-11-17. Retrieved 2017-11-19.
- ↑ Romero, Dennis (2017-03-27). "A Middle-of-the-Road L.A. Home Now Costs Nearly $600,000". LA Weekly. Archived from the original on 2017-06-11. Retrieved 2017-11-19.
- ↑ Lee, Bonhia (2017-08-09). "How much do you have to make to buy a home in Fresno?". The Fresno Bee. Archived from the original on 2017-08-10. Retrieved 2017-11-19.
- 1 2 Fagan, Kevin; Graham, Alison (2017-09-08). "California's homelessness crisis expands to country". San Francisco Chronicle. Archived from the original on 2017-09-11. Retrieved 2017-12-12.
With the county’s rental vacancy rate hovering around 1 percent — California’s is 3.6 percent, an all-time low for the state —
- 1 2 Levin, Matt (2017-08-28). "California's housing crisis – it's even worse than you think". The San Jose Mercury News. Archived from the original on 2017-08-30. Retrieved 2017-11-02.
- ↑ See the section on Effects for a more thorough explanation of these issues with all sources cited.
- ↑ U.S. Census Bureau (2000-06-01). "Historical Census of Housing Tables Home Values". Retrieved 2018-06-13.
- ↑ U.S. Census Bureau. "MEDIAN HOUSING VALUE OF OWNER-OCCUPIED HOUSING UNITS". American Community Survey. Retrieved 2018-06-13.
- ↑ Federal Reserve Bank of Minneapolis Community Development Project. "Consumer Price Index (estimate) 1800–". Federal Reserve Bank of Minneapolis. Retrieved January 2, 2018.
- 1 2 3 "Table 12-13". United States Summary: 2010 Population and Housing Unit Counts (PDF). United States Census Bureau. 2012. p. 30. Retrieved 2018-06-15.
- 1 2 3 Annual Estimates of Housing Units for the United States, Regions, Divisions, States, and Counties: April 1, 2010 to July 1, 2017 (Report). United States Census Bureau. 2017-07-01. Retrieved 2018-06-15.
- 1 2 Annual Estimates of the Resident Population: April 1, 2010 to July 1, 2017 (Report). United States Census Bureau. 2017-07-01. Retrieved 2018-06-15.
- ↑ Romem, Issi (2018-03-28). "California's Housing Prices Need to Come Down". CityLab - The Atlantic Monthly. Archived from the original on 2018-03-30. Retrieved 2018-05-03.
- ↑ "MEDIAN HOUSING VALUE OF OWNER-OCCUPIED HOUSING UNITS (DOLLARS)". American Fact Finder. U.S. Census Bureau. 2016. Retrieved 2018-06-17.
- ↑ http://www.ppic.org/publication/undocumented-immigrants-in-california/
- ↑ http://www.latimes.com/local/lanow/la-me-ln-new-immigrants-california-economy-20140903-story.html
- ↑ https://napavalleyregister.com/news/local/napa-s-rental-vacancies-bottom-out-at-percent/article_bbf6a75a-8473-5748-8464-7526926927ac.html
- ↑ Dougherty, Conor (2017-12-01). "The Great American Single-Family Home Problem". The New York Times Company. Archived from the original on 2017-12-04. Retrieved 2017-12-05.
Around the country, many fast-growing metropolitan areas are facing a brutal shortage of affordable places to live, leading to gentrification, homelessness, even disease. As cities struggle to keep up with demand, they have remade their skylines with condominium and apartment towers — but single-family neighborhoods, where low-density living is treated as sacrosanct, have rarely been part of the equation.
- 1 2 Saltsman, Michael (2016-06-05). "Unions' fight against affordable housing". The Orange County Register. Archived from the original on 2017-11-08. Retrieved 2017-11-07.
- ↑ Johnson, Chip (2016-03-10). "Bay Area housing crisis fueled by greed, study finds". San Francisco Chronicle. Archived from the original on 2016-04-04. Retrieved 2018-09-20.
- ↑ Dillon, Liam (2017-07-28). "A Bay Area developer wants to build 4,400 sorely needed homes. Here's why it won't happen". Los Angeles Times. Archived from the original on 2017-09-01. Retrieved 2018-06-16.
- ↑ Keyser Marston Associates, Inc. (March 2016). "Preliminary Assessment of Fiscal Impacts: Brisbane Baylands" (PDF). Archived (PDF) from the original on 2017-08-22. Retrieved 2018-06-16.
- ↑ Hart, Angela (2017-08-21). "How California's housing crisis happened". The Sacramento Bee. Archived from the original on 2017-10-01. Retrieved 2018-01-28.
Residential property is valued at a staggering $150,000 per acre or more in California’s coastal regions, compared to $20,000 per acre, on average, in other large metropolitan areas of the country.
- ↑ Li, Roland (2016-10-26). "Housing development's latest enemy: Bay Area construction unions". San Francisco Business Times. Archived from the original on 2017-06-29. Retrieved 2018-01-07.
Angered by some developers’ attempts to use cheaper non-union labor, Bay Area construction unions have filed appeals challenging projects’ approvals and allied themselves with community groups who oppose the projects for different reasons. Labor groups are also fighting policies that supporters say would help address the region’s housing crisis, such as more use of modular housing and streamlined project approvals. It’s a high-stakes game: Unions say the appeals give them leverage to pressure developers to commit to using union labor and to hire locally.
- ↑ https://www.bloomberg.com/news/articles/2017-02-22/why-trump-s-immigration-crackdown-could-sink-u-s-home-prices
- 1 2 "Housing Affordability Index - Traditional". California Association of Realtors. Retrieved 2018-06-16.
C.A.R.'s Traditional Housing Affordability Index (HAI) measures the percentage of households that can afford to purchase the median priced home in the state and regions of California based on traditional assumptions.
- ↑ Bennet, Sydney (2018-04-24). "Rise of the Super Commuters". Rentonomics. Retrieved 2018-06-16.
- ↑ Dougherty, Conor; Burton, Andrew (2017-08-17). "A 2:15 Alarm, 2 Trains and a Bus Get Her to Work by 7 A.M. - Like many in the housing-starved San Francisco region, Sheila James has moved far inland, gaining affordable space at the price of a brutal commute". The New York Times. Archived from the original on 2017-09-20. Retrieved 2018-09-27.
- ↑ Uhler, Brian; Garosi, Justin (2018-02-21). "California Losing Residents Via Domestic Migration [EconTax Blog]". Legislative Analyst's Office. Retrieved 2018-06-16.
- ↑ California Air Resources Board (2017-06-06). "California Greenhouse Gas Emission Inventory". Retrieved 2018-06-16.
- ↑ Dougherty, Conor; Plumer, Brad (2018-03-16). "A Bold, Divisive Plan to Wean Californians From Cars". The New York Times. Archived from the original on 2018-04-07. Retrieved 2018-06-16.
- ↑ "Supplemental Poverty Measure". United States Census Bureau. 2017-03-16. Retrieved 2018-01-04.
The official poverty measure, which has been in use since the 1960s, estimates poverty rates by looking at a family's or an individual's cash income. The new measure is a more complex statistic incorporating additional items such as tax payments and work expenses in its family resource estimates. Thresholds used in the new measure are derived from Consumer Expenditure Survey expenditure data on basic necessities (food, shelter, clothing and utilities) and are adjusted for geographic differences in the cost of housing.
- 1 2 Levin, Matt (2017-09-28). "How sky-high housing costs make California the poorest state". Bay Area News Group. Archived from the original on 2017-09-28. Retrieved 2017-11-09.
- ↑ Huang, Josie (2017-09-12). "California's housing costs are driving its No. 1 poverty ranking". Southern California Public Radio. Archived from the original on 2017-10-05. Retrieved 2017-11-07.
- 1 2 Hart, Angela (2017-08-21). "How California's housing crisis happened". The Sacramento Bee. Archived from the original on 2017-10-01. Retrieved 2018-01-28.
California is home to 12 percent of the U.S. population, but 22 percent of its homeless people. Cities that have seen dramatic rent increases, such as San Francisco and Los Angeles, attribute their spikes in homelessness directly to a state housing shortage that has led to an unprecedented affordability crisis.
- ↑ Nichols, Chris (2018-03-27). "Has California's homeless population 'skyrocketed'? And how does it rate nationwide?". PolitiFact California. Archived from the original on 2018-04-02. Retrieved 2018-05-24.
California has the third highest rate nationally with 34 in every 10,000 people in the state experiencing homelessness. Two states are worse off: New York and Hawaii. New York ranks second with 45 homeless people per 10,000. Hawaii, meanwhile, ranks first with 51 per 10,000.
- ↑ Kushel, Margot (June 14, 2018). "Why there are so many unsheltered homeless people on the West Coast". The Conversation. Retrieved 25 June 2018.
- ↑ Herkenhoff, Kyle; Ohanian, Lee; Prescott, Edward (2017-11-09). "Tarnishing the golden and empire states: Land-use restrictions and the U.S. economic slowdown" (PDF). Journal of Monetary Economics. doi:10.1016/j.jmoneco.2017.11.001. Retrieved 2018-05-23.
- 1 2 Florida, Richard (2017-10-26). "The Flip Side of NIMBY Zoning". CityLab. Archived from the original on 2017-12-28. Retrieved 2018-10-06.
- ↑ Smith, Kevin (2017-01-04). "California needs to build a staggering number of homes and we are way behind". Pasadena Star-News. Archived from the original on 2018-01-23. Retrieved 2018-01-22.
The McKinsey Global Institute estimates that California’s housing shortage is costing the state $143 billion to $233 billion in lost economic output, primarily from consumption that’s crowded out by high housing costs and lost construction activity.
- 1 2 Khouri, Andrew (2017-05-01). "Housing construction is on the rise in California, but it's still not enough". Los Angeles Times. Archived from the original on 2017-05-10. Retrieved 2017-11-05.
- ↑ Fimrite, Peter (2017-09-27). "Report: To cut housing prices 10 percent, California needs 20 percent more units". San Francisco Chronicle. Archived from the original on 2017-10-04. Retrieved 2018-02-21.
- ↑ Dillon, Liam (2017-10-23). "Gavin Newsom calls for California to nearly quadruple its annual housing production". Los Angeles Times. Archived from the original on 2018-02-02. Retrieved 2018-06-01.
- ↑ Dillon, Liam (2018-04-17). "California lawmakers killed one of the biggest housing bills in the country". The Los Angeles Times. Archived from the original on 2018-04-23. Retrieved 2018-04-23.
Wiener said the bill would help the state reduce a shortage of homes he has estimated at 4 million.
- ↑ Economy at a Glance - California (Report). United States Department of Labor - Bureau of Labor Statistics. 2017-11-04. Retrieved 2017-11-04.
- ↑ Labor Force Statistics from the Current Population Survey (Report). United States Department of Labor - Bureau of Labor Statistics. 2017-11-04. Retrieved 2017-11-04.
- 1 2 3 4 5 6 7 8 "Housing Development Toolkit" (PDF). Executive Office of the President of the United States. 2016-09-01. Archived (PDF) from the original on 2016-10-01. Retrieved 2018-09-17.
- ↑ Woellert, Lorraine (2016-09-26). "Obama takes on zoning laws in bid to build more housing, spur growth". Politico. Archived from the original on 2016-10-01. Retrieved 2018-09-17.
- ↑ Walker, Alissa (2016-09-28). "Obama's new housing toolkit aims to make cities more affordable - Wealthy communities have pulled up the 'ladders of opportunity' from lower-income residents, says the White House". Curbed. Archived from the original on 2016-11-03. Retrieved 2018-09-17.
- ↑ Grabar, Henry (2016-09-26). "The Obama Administration Is Finally Targeting the NIMBY Nonsense That's Made Cities Unaffordable". Slate. Archived from the original on 2016-10-01. Retrieved 2018-09-17.
- ↑ Beyer, Scott (2016-09-30). "The Verdict Is In: Land Use Regulations Increase Housing Costs". Forbes. Archived from the original on 2016-10-01. Retrieved 2018-09-17.
- ↑ Pender, Kathleen (2016-12-03). "New California housing laws make granny units easier to build". San Francisco Chronicle. Archived from the original on 2018-06-15. Retrieved 2018-07-12.
- 1 2 Wong, Queenie (2016-09-27). "California eases restrictions on 'granny units'". San Jose Mercury News. Archived from the original on 2016-10-19. Retrieved 2018-07-12.
- ↑ Collins, Jeff (2017-09-25). "Housing crisis: See how California lawmakers are putting more teeth — and more money — into reform". Southern California News Group. Archived from the original on 2017-09-25. Retrieved 2017-11-01.
- ↑ Koseff, Alexei; Luna, Taryn (September 14, 2017). "Efforts to control California housing costs go to Jerry Brown after tight vote". Sacramento Bee. Archived from the original on 2017-11-12. Retrieved 2018-05-29.
- ↑ Dillon, Liam (2017-09-29). "Gov. Brown just signed 15 housing bills. Here's how they're supposed to help the affordability crisis". Los Angeles Times. Archived from the original on 2017-11-01. Retrieved 2018-05-29.
- 1 2 Dillon, Liam (2017-01-23). "California cities would have to make it easier to build houses under new legislation". Los Angeles Times. Archived from the original on 2017-06-07. Retrieved 2018-05-28.
- ↑ Dillon, Liam (2017-10-05). "How a new California law could kill a 30-year-old rule that slowed development in Los Angeles". Los Angeles Times. Archived from the original on 2017-12-01. Retrieved 2018-05-29.
- ↑ Hiltzik, Michael (2018-03-29). "California's housing crisis reaches from the homeless to the middle class — but it's still almost impossible to fix". Los Angeles Times. Archived from the original on 2018-03-31. Retrieved 2018-06-27.
- 1 2 Murphy, Katy (2017-11-12). "'Homes for human beings': Millennial-driven anti-NIMBY movement is winning with a simple message". San Jose Mercury News. Archived from the original on 2017-11-23. Retrieved 2018-06-14.
- ↑ Dougherty, Conor (2016-04-16). "In Cramped and Costly Bay Area, Cries to Build, Baby, Build". The New York Times. Archived from the original on 2016-04-25. Retrieved 2018-07-02.
- ↑ McCormick, Erin (2017-10-02). "Rise of the yimbys: the angry millennials with a radical housing solution". The Guardian. Archived from the original on 2017-11-07. Retrieved 2018-08-23.
- ↑ Kendall, Marisa (2017-11-03). "Can't afford housing? You could move into a shipping container". Bay Area News Group. Archived from the original on 2017-11-03. Retrieved 2017-11-08.
- 1 2 Metcalf, G. (2018). Sand castles before the tide? affordable housing in expensive cities. The Journal of Economic Perspectives, 32(1), 59-80. doi:http://dx.doi.org.csuglobal.idm.oclc.org/10.1257/jep.32.1.59