Bethe–Slater curve
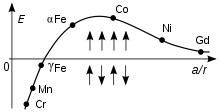
Bethe–Slater curve: elements above the horizontal axis are ferromagnetic, and those below are antiferromagnetic
The Bethe–Slater curve is a graphical representation of exchange energy for transition metals as a function of the ratio of the interatomic distance a to the radius r of the 3d electron shell.[1]
The curve illustrates why certain metals are ferromagnetic and other antiferromagnetic.
For a pair of atoms, the exchange interaction wij (responsible for the energy E) is calculated as:[2]

where: J = exchange integral; S = electron spins; i and j = indices of the two atoms.
References
- ↑ http://www.nitt.edu/home/academics/departments/physics/faculty/lecturers/justin/students/magnetic/exchange/
- ↑ Soshin Chikazumi, Physics of Ferromagnetism, Oxford University Press, New York, 1997, p. 125, ISBN 0-19-851776-9
This article is issued from
Wikipedia.
The text is licensed under Creative Commons - Attribution - Sharealike.
Additional terms may apply for the media files.